Answered step by step
Verified Expert Solution
Question
1 Approved Answer
assess the signifcant trends you see for the companys profitability by discussing how the net profit margin affects return on assets, and how the depreciation
assess the signifcant trends you see for the companys profitability by discussing how the net profit margin affects return on assets, and how the depreciation of assets affects the profitability ratios 


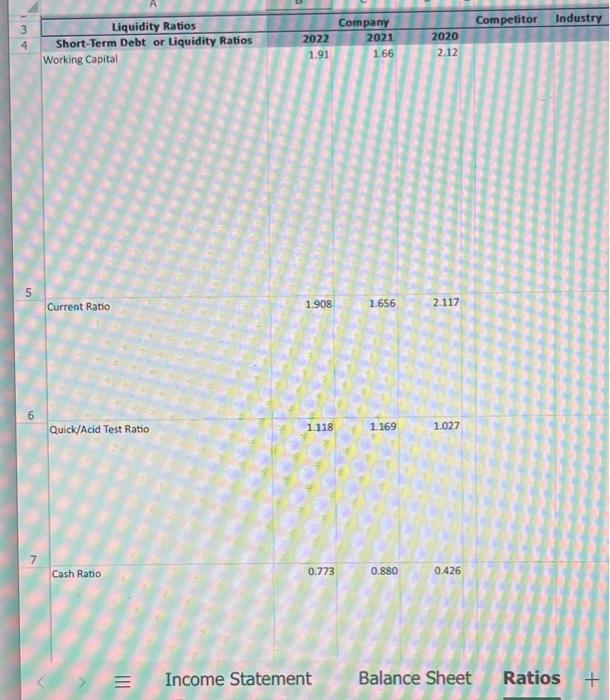
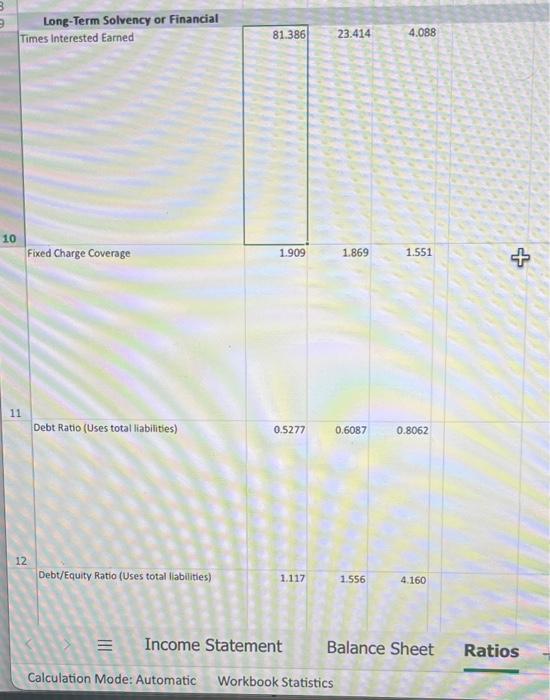
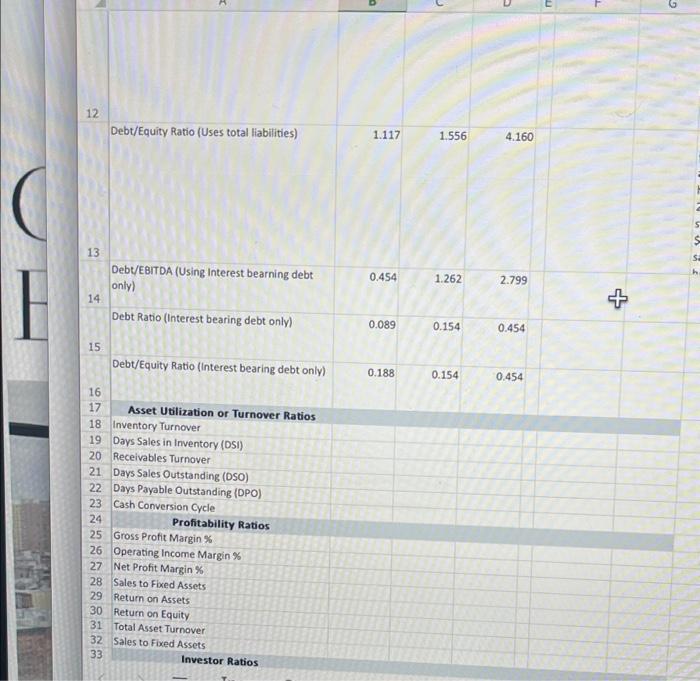
look at the ratios for YETI and answer the question. i showed all the ratios from 2022-2020
5 Current Ratio 1.9081.6562.117 6 Quick/Acid Test Ratio 1.1181.1691.027 7 Cash Ratio 0.7730.8800.426 Income Statement Balance Sheet Ratios + Long-Term Solvency or Financial Times interested Earned 11 Debt Ratio (Uses total liabilities) 0.52770.60870.8062 12 Debt/Equity Ratio (Uses total liabilities) 1.1171.5564.160 Income Statement Balance Sheet Ratios Calculation Mode: Automatic Workbook Statistics Debt/Equity Ratio (Uses total liabilities) 1.1171.5564.160 13 \begin{tabular}{|l|l|l|l|} \hline Debt/EBITDA (Using Interest bearning debt & 0.454 & 1.262 & 2.799 \\ \hline \end{tabular} only) 14 Debt Ratio (Interest bearing debt only) 0.0890.1540.454 15 \begin{tabular}{|l|lll} \hline Debt/Equity Ratio (Interest bearing debt only) & 0.188 & 0.154 & 0.454 \\ \hline \end{tabular} 16 Asset Utilization or Turnover Ratios Inventory Turnover Days Sales in Inventory (DSI) Receivables Turnover Days Sales Outstanding (DSO) Days Payable Outstanding (DPO) Cash Conversion Cycle Profitability Ratios Gross Profit Margin\% Operating Income Margin \% Net Profit Margin \% Sales to Fixed Assets Return on Assets. Return on Equity Total Asset Turnover Sales to Fixed Assets Investor Ratios Step by Step Solution
There are 3 Steps involved in it
Step: 1

Get Instant Access to Expert-Tailored Solutions
See step-by-step solutions with expert insights and AI powered tools for academic success
Step: 2

Step: 3

Ace Your Homework with AI
Get the answers you need in no time with our AI-driven, step-by-step assistance
Get Started


