assignment #1 (a), #2(a), (b) , (d)
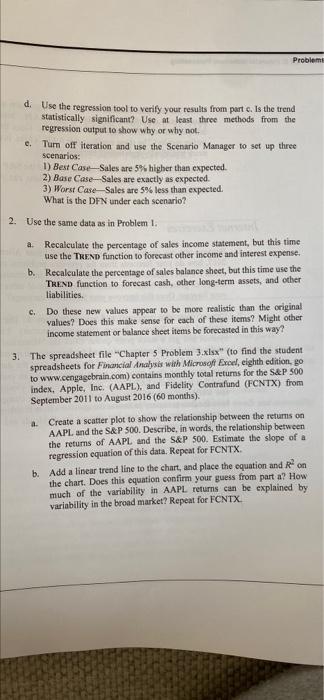
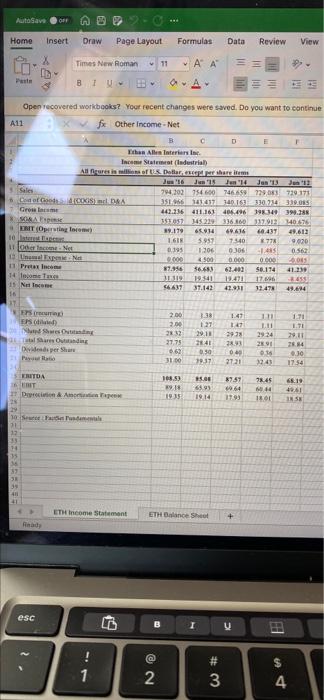
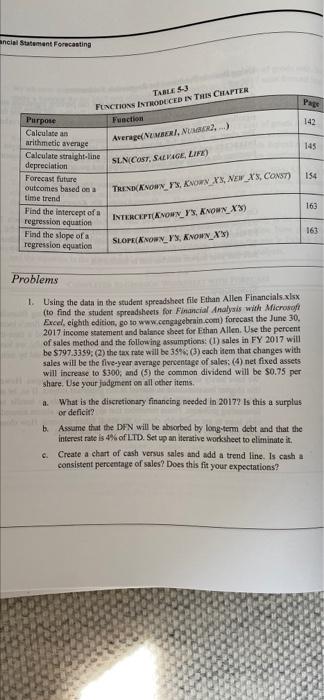
Problemi d. Use the regression tool to verify your results from part c. Is the trend Statistically significant? Use at least three methods from the regression output to show why or why not e. Tum off iteration and use the Scenario Manager to set up three scenarios: 1) Best Case Sales are 5% higher than expected 2) Base Case-Sales are exactly as expected. 3) Worst Case Sales are 5% less than expected. What is the DFN under each scenario? 2. Use the same data as in Problem 1. a Recalculate the percentage of sales income statement, but this time use the TREND function to forecast other income and interest expense. b. Recalculate the percentage of sales balance sheet, but this time use the TREND function to forecast cash, other long-term assets, and other liabilities. Do these new values appear to be more realistic than the original values? Does this make sense for each of these items? Might other income statement or balance sheet items be forecasted in this way? c. 3. The spreadsheet file "Chapter 5 Problem 3.xlsx" (to find the student spreadsheets for Financial Analysis with Microsoft Excel, eighth edition, go to www.cengagebrain.com) contains monthly total returns for the S&P 500 index, Apple, Inc. (AAPL), and Fidelity Contrafund (FCNTX) from September 2011 to August 2016 (60 months). a. Create a scatter plot to show the relationship between the returns on AAPL. and the S&P 500. Describe, in words, the relationship between the returns of AAPL and the S&P 500. Estimate the slope of a regression equation of this data. Repeat for FCNTX b. Add a linear trend line to the chart, and place the equation and on the chart. Does this equation confirm your guess from part a? How much of the variability in AAPL returns can be explained by variability in the broad market? Repeat for FCNTX AutoSave OFF Home Insert Draw Page Layout Formulas Data Review View Times New Roman 11 ' Pen 3 BIU AA Open recovered workbooks? Your recent changes were saved. Do you want to continue A11 fx Other Income - Net B C D E than Allen Interiors in In Staat (ladustrial All art of the short Just 13 Jan 14 Jan 13 Sales 794102 754 600 7466729083710 171 Cod of AXIS DA 35166161017_149151213024339.085 Grosse 442.236 411.161 406.496 39340399.185 35107145229 138 137912140525 EMIT Operating for 9.179 6594 69416 40.437 49.612 10 amp 1.GIR 5957 7340 277 9020 It lonel Net 0.199 1206 0.306 14 19 Und 0.000 4500 0.000 0.000 09 11 Pretax inc 89.96 56.683 61.400 S.174 41.23 14 con 31 1941 27 2015 15 Non 56637 37.142 42.931 12.478 414 16 050 200 2.00 22 Newest Ters Oding Der Shar It Paul 27.75 3.38 1.27 29.11 2641 0.50 19:17 1.41 141 2978 23.03 0.49 27 21 111 1.11 29.24 21 16 19.45 171 ITE 29.11 2884 9.30 17.54 0.62 3100 66.19 5 KRITDA UT IT De Amor 15.00 69 1914 87.57 10.64 1799 78.45 M 18.01 4861 19.15 15 10 SP 31 17 33 35 57 41 241 ETH income Statement ETH Dance Shot + Find esc B I @ 1 N 2 # 3 $ 4 Anne Home Insert Data Rev View Tell me BO Draw Page Layout Formulas Times New Roman - AA TV- X 20 wat 3 warga Piste Ord work at your recent changes were saved. Do you want to continue working where yo AT fx than Allen Interioning A D 1 + is was Relah 1 Choly IN SETE HERE 361 IN 972 0.000 15 9004 3469 1942 14 141251261 2140 24E39 1940 1949 1948 262.799 SI SEIT 2012 ITS 61322 LOG 7230 AM AD 1. 11 1 Total & PETS LA LT st ICE CO Tweet 3001 BUD 15.41 TES 34136 725 17311 1011 123.01. 1647 132. ITT 24 125 THI 1.1 1.1 1.1.3 TH More + FEE 161.618 31141151) 16 Tu Share The Shadow HERRE TIT 3 Thomas ETH Sheer Hed esc U $ ! 1 N 2 wa # 3 % 5 4 0 Q W E R 20 ancial Statement Forecasting TABLES FUNCTIONS INTRODUCED IN THE CHAPTER Page Function 142 Average MIMRERI, MERZ,...) 145 SLNECOST, SAVAGE, LIFE) 154 Purpose Calculate an arithmetic averige Calculate straight-line depreciation Forecast future outcomes based on a time trend Find the intercept of a regression equation Find the slope of a regression equation TREND KNOW YORX_XX, NEW_X5, CONST) 163 INTERCEPTEK NOWY, KNOWN_X39 163 SLOPE KNOWN_Y, KNOWN_X") Problems 1. Using the data in the student spreadsheet file Ethan Allen Financials xlsx (to find the student spreadsheets for Financial Analysis with Microsoft Excel, eighth edition, go to www.cengagebrain.com) forecast the June 30, 2017 income statement and balance sheet for Ethan Allen. Use the percent of sales method and the following assumptions: (1) sales in FY 2017 will be $797.3359; (2) the tax rate will be 35%(3) each item that changes with sales will be the five-year average percentage of sales: (4) net fixed assets will increase to $300, and (5) the common dividend will be $0.75 per share. Use your judgment on all other items a What is the discretionary financing needed in 2017? Is this a surplus or deficit? b. Assume that the DFN will be absorbed by long-term debt and that the interest rate is 4% of LTD. Set up an iterative worksheet to eliminate it. c. Create a chart of cash versus sales and add a trend line. Is cash a consistent percentage of sales? Does this fit your expectations? Problemi d. Use the regression tool to verify your results from part c. Is the trend Statistically significant? Use at least three methods from the regression output to show why or why not e. Tum off iteration and use the Scenario Manager to set up three scenarios: 1) Best Case Sales are 5% higher than expected 2) Base Case-Sales are exactly as expected. 3) Worst Case Sales are 5% less than expected. What is the DFN under each scenario? 2. Use the same data as in Problem 1. a Recalculate the percentage of sales income statement, but this time use the TREND function to forecast other income and interest expense. b. Recalculate the percentage of sales balance sheet, but this time use the TREND function to forecast cash, other long-term assets, and other liabilities. Do these new values appear to be more realistic than the original values? Does this make sense for each of these items? Might other income statement or balance sheet items be forecasted in this way? c. 3. The spreadsheet file "Chapter 5 Problem 3.xlsx" (to find the student spreadsheets for Financial Analysis with Microsoft Excel, eighth edition, go to www.cengagebrain.com) contains monthly total returns for the S&P 500 index, Apple, Inc. (AAPL), and Fidelity Contrafund (FCNTX) from September 2011 to August 2016 (60 months). a. Create a scatter plot to show the relationship between the returns on AAPL. and the S&P 500. Describe, in words, the relationship between the returns of AAPL and the S&P 500. Estimate the slope of a regression equation of this data. Repeat for FCNTX b. Add a linear trend line to the chart, and place the equation and on the chart. Does this equation confirm your guess from part a? How much of the variability in AAPL returns can be explained by variability in the broad market? Repeat for FCNTX AutoSave OFF Home Insert Draw Page Layout Formulas Data Review View Times New Roman 11 ' Pen 3 BIU AA Open recovered workbooks? Your recent changes were saved. Do you want to continue A11 fx Other Income - Net B C D E than Allen Interiors in In Staat (ladustrial All art of the short Just 13 Jan 14 Jan 13 Sales 794102 754 600 7466729083710 171 Cod of AXIS DA 35166161017_149151213024339.085 Grosse 442.236 411.161 406.496 39340399.185 35107145229 138 137912140525 EMIT Operating for 9.179 6594 69416 40.437 49.612 10 amp 1.GIR 5957 7340 277 9020 It lonel Net 0.199 1206 0.306 14 19 Und 0.000 4500 0.000 0.000 09 11 Pretax inc 89.96 56.683 61.400 S.174 41.23 14 con 31 1941 27 2015 15 Non 56637 37.142 42.931 12.478 414 16 050 200 2.00 22 Newest Ters Oding Der Shar It Paul 27.75 3.38 1.27 29.11 2641 0.50 19:17 1.41 141 2978 23.03 0.49 27 21 111 1.11 29.24 21 16 19.45 171 ITE 29.11 2884 9.30 17.54 0.62 3100 66.19 5 KRITDA UT IT De Amor 15.00 69 1914 87.57 10.64 1799 78.45 M 18.01 4861 19.15 15 10 SP 31 17 33 35 57 41 241 ETH income Statement ETH Dance Shot + Find esc B I @ 1 N 2 # 3 $ 4 Anne Home Insert Data Rev View Tell me BO Draw Page Layout Formulas Times New Roman - AA TV- X 20 wat 3 warga Piste Ord work at your recent changes were saved. Do you want to continue working where yo AT fx than Allen Interioning A D 1 + is was Relah 1 Choly IN SETE HERE 361 IN 972 0.000 15 9004 3469 1942 14 141251261 2140 24E39 1940 1949 1948 262.799 SI SEIT 2012 ITS 61322 LOG 7230 AM AD 1. 11 1 Total & PETS LA LT st ICE CO Tweet 3001 BUD 15.41 TES 34136 725 17311 1011 123.01. 1647 132. ITT 24 125 THI 1.1 1.1 1.1.3 TH More + FEE 161.618 31141151) 16 Tu Share The Shadow HERRE TIT 3 Thomas ETH Sheer Hed esc U $ ! 1 N 2 wa # 3 % 5 4 0 Q W E R 20 ancial Statement Forecasting TABLES FUNCTIONS INTRODUCED IN THE CHAPTER Page Function 142 Average MIMRERI, MERZ,...) 145 SLNECOST, SAVAGE, LIFE) 154 Purpose Calculate an arithmetic averige Calculate straight-line depreciation Forecast future outcomes based on a time trend Find the intercept of a regression equation Find the slope of a regression equation TREND KNOW YORX_XX, NEW_X5, CONST) 163 INTERCEPTEK NOWY, KNOWN_X39 163 SLOPE KNOWN_Y, KNOWN_X") Problems 1. Using the data in the student spreadsheet file Ethan Allen Financials xlsx (to find the student spreadsheets for Financial Analysis with Microsoft Excel, eighth edition, go to www.cengagebrain.com) forecast the June 30, 2017 income statement and balance sheet for Ethan Allen. Use the percent of sales method and the following assumptions: (1) sales in FY 2017 will be $797.3359; (2) the tax rate will be 35%(3) each item that changes with sales will be the five-year average percentage of sales: (4) net fixed assets will increase to $300, and (5) the common dividend will be $0.75 per share. Use your judgment on all other items a What is the discretionary financing needed in 2017? Is this a surplus or deficit? b. Assume that the DFN will be absorbed by long-term debt and that the interest rate is 4% of LTD. Set up an iterative worksheet to eliminate it. c. Create a chart of cash versus sales and add a trend line. Is cash a consistent percentage of sales? Does this fit your expectations
