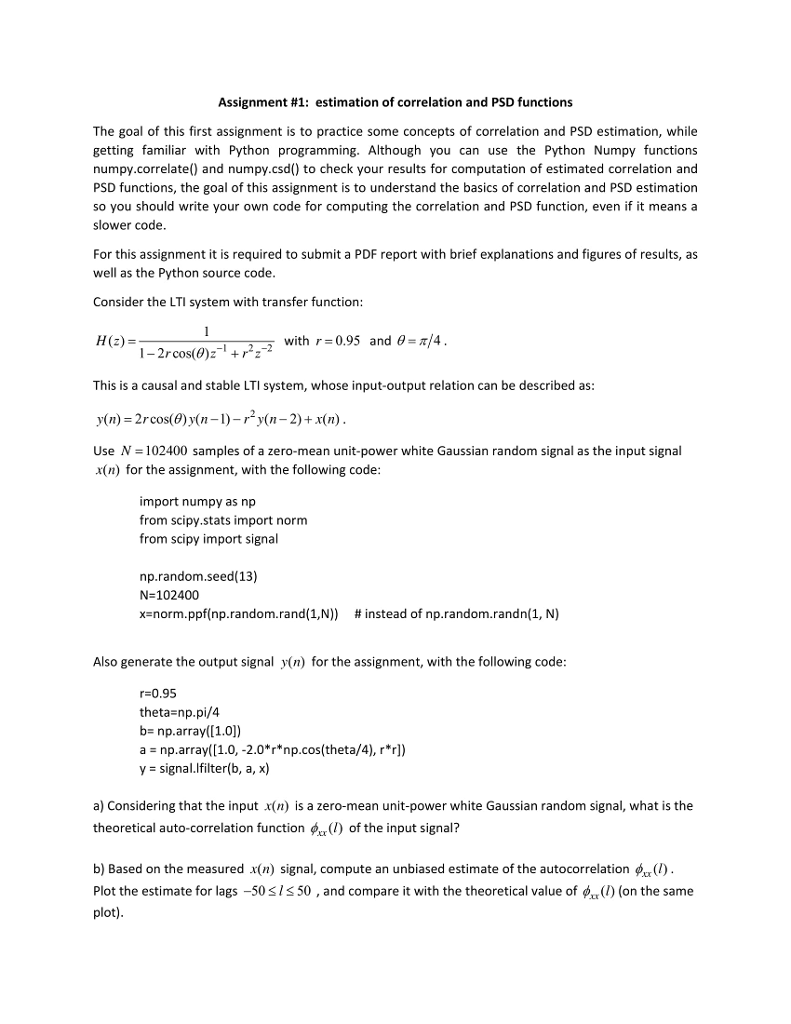
Assignment #1: estimation of correlation and PSD functions The goal of this first assignment is to practice some concepts of correlation and PSD estimation, while getting familiar with Python programming. Although you can use the Python Numpy functions numpy.correlate) and numpy.csd() to check your results for computation of estimated correlation and PSD functions, the goal of this assignment is to understand the basics of correlation and PSD estimation so you should write your own code for computing the correlation and PSD function, even if it means a slower code For this assignment it is required to submit a PDF report with brief explanations and figures of results, as well as the Python source code Consider the LTI system with transfer function H(z)- with 0.95 and e-/4 1-2rcos(0)1+222 This is a causal and stable LTI system, whose input-output relation can be described as y(n) 2rcos(0)y(n-1)-ry (n-2) +x(n) Use N- 102400 samples of a zero-mean unit-power white Gaussian random signal as the input signal x(n) for the assignment, with the following code import numpy as np from scipy.stats import norm from scipy import signal np.random.seed(13) N-102400 x norm.ppf(np.random.rand(LN)) # instead of np.random.randn(1, N) Also generate the output signal y(n) for the assignment, with the following code r-0.95 theta-np.pi/4 b np.array([1.0]) a np.array([1.0,-2.0*r*np.cos(theta/4), r*r]) y-signal.lfilter(b, , x) a) Considering that the input x(n is a zero-mean unit-power white Gaussian random signal, what is the theoretical auto-correlation function ul) of the input signal? b) Based on the measured x(n) signal, compute an unbiased estimate of the autocorrelation x() Plot the estimate for lags -50Sls 50, and compare it with the theoretical value of ) (on the same plot) c) What is the theoretical frequency response H(e) of this system? Plot it in Python. For computing H(e) it is ok to use built-in Numpy function (if it helps) d) Considering that the input x(n) is a zero-mean unit-power white Gaussian random signal, what is the theoretical auto-PSD function (e") of the output signal? Plot it in Python. e) Based on the measured y(n) signal, compute the periodogram estimate P,(e'). Plot the estimate in Python and compare it with the theoretical (e,e) (on the same plot). f) Based on the measured y(n) signal, compute the Welch estimate (e). Use K -199 segments of size M = 1024, with 50% overlap and a Hann window. Plot the estimate in Python and compare it with the theoretical ,y(ejo) (on the same plot). g) Based on the measured x(n) and y(n) signals, use periodogram estimates P(e and P( to estimate H(e"). Plot the estimate in Python (magnitude only) and compare it with the theoretical H(e) (magnitude only) on the same plot. h) Based on the m easured x(n) and y(n) signals, use Welch estimates P (ejo) and P (ein) to estimate H(ej") . Use K 199 segments of size M-1024, with 50% overlap and a Hann window. Plot the estimate in Python (magnitude only) and compare it with the theoretical H(e) (magnitude only) (on the same plot) i) Based on the measured x(n) and y(n) signals and the Welch estimates (Pe and P (ej"), compute the estimate of the coherence (ej") . Plot it in Python and compare it to the theoretical value (ejo) (i.e., non-estimated value) on the same plot. Assignment #1: estimation of correlation and PSD functions The goal of this first assignment is to practice some concepts of correlation and PSD estimation, while getting familiar with Python programming. Although you can use the Python Numpy functions numpy.correlate) and numpy.csd() to check your results for computation of estimated correlation and PSD functions, the goal of this assignment is to understand the basics of correlation and PSD estimation so you should write your own code for computing the correlation and PSD function, even if it means a slower code For this assignment it is required to submit a PDF report with brief explanations and figures of results, as well as the Python source code Consider the LTI system with transfer function H(z)- with 0.95 and e-/4 1-2rcos(0)1+222 This is a causal and stable LTI system, whose input-output relation can be described as y(n) 2rcos(0)y(n-1)-ry (n-2) +x(n) Use N- 102400 samples of a zero-mean unit-power white Gaussian random signal as the input signal x(n) for the assignment, with the following code import numpy as np from scipy.stats import norm from scipy import signal np.random.seed(13) N-102400 x norm.ppf(np.random.rand(LN)) # instead of np.random.randn(1, N) Also generate the output signal y(n) for the assignment, with the following code r-0.95 theta-np.pi/4 b np.array([1.0]) a np.array([1.0,-2.0*r*np.cos(theta/4), r*r]) y-signal.lfilter(b, , x) a) Considering that the input x(n is a zero-mean unit-power white Gaussian random signal, what is the theoretical auto-correlation function ul) of the input signal? b) Based on the measured x(n) signal, compute an unbiased estimate of the autocorrelation x() Plot the estimate for lags -50Sls 50, and compare it with the theoretical value of ) (on the same plot) c) What is the theoretical frequency response H(e) of this system? Plot it in Python. For computing H(e) it is ok to use built-in Numpy function (if it helps) d) Considering that the input x(n) is a zero-mean unit-power white Gaussian random signal, what is the theoretical auto-PSD function (e") of the output signal? Plot it in Python. e) Based on the measured y(n) signal, compute the periodogram estimate P,(e'). Plot the estimate in Python and compare it with the theoretical (e,e) (on the same plot). f) Based on the measured y(n) signal, compute the Welch estimate (e). Use K -199 segments of size M = 1024, with 50% overlap and a Hann window. Plot the estimate in Python and compare it with the theoretical ,y(ejo) (on the same plot). g) Based on the measured x(n) and y(n) signals, use periodogram estimates P(e and P( to estimate H(e"). Plot the estimate in Python (magnitude only) and compare it with the theoretical H(e) (magnitude only) on the same plot. h) Based on the m easured x(n) and y(n) signals, use Welch estimates P (ejo) and P (ein) to estimate H(ej") . Use K 199 segments of size M-1024, with 50% overlap and a Hann window. Plot the estimate in Python (magnitude only) and compare it with the theoretical H(e) (magnitude only) (on the same plot) i) Based on the measured x(n) and y(n) signals and the Welch estimates (Pe and P (ej"), compute the estimate of the coherence (ej") . Plot it in Python and compare it to the theoretical value (ejo) (i.e., non-estimated value) on the same plot