Assignment 1-due Friday, Sept 16 by 2 pm STAT-UB.0103.005-Statistics for Business Control and Regression Models Total=30 Homework assignments will be drawn from problems in the
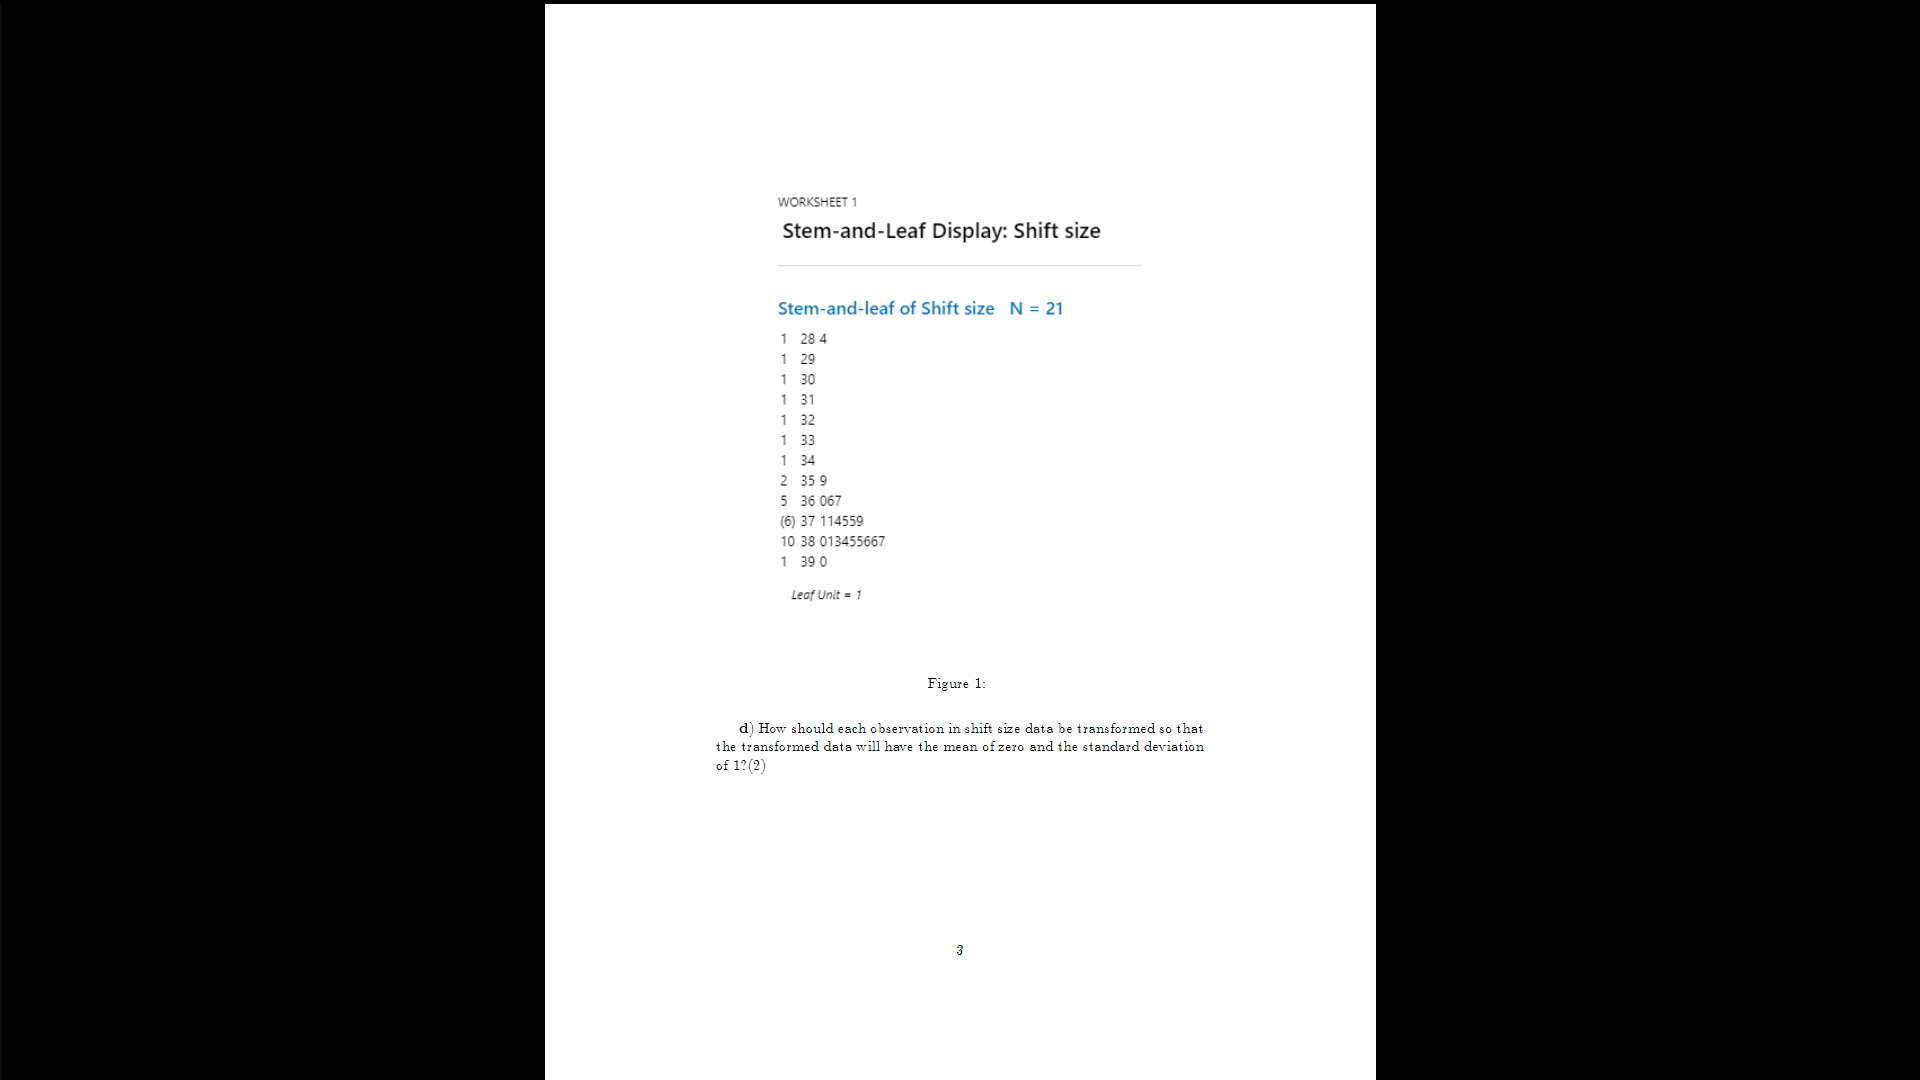
Assignment 1-due Friday, Sept 16 by 2 pm STAT-UB.0103.005-Statistics for Business Control and Regression Models Total=30 Homework assignments will be drawn from problems in the MBS text, as well as from other sources. You are permitted to work in teams, but each student must independently write up their own solutions. If the assignment asks for data analysis, you should turn in your own relevant Minitab (or R) output together with the solutions to the assignment. Problem 1 (2) In the following scenario, state what population is involved and why the sample is biased. Scenario: You want to learn about the quality of food at a local restau rant. You read the reviews for the restaurant on Yelp.com. Problem 2 (3) Do seat belts affect the death rates in car accidents? What kind of data should you obtain to answer the question? Will the data be experimental or observational? Problem 3 Based on the attached Nuclear power plants data from Problem 2.54 .page 73 in MBS. (This problem requires the submission of Minitab or R ouput.) (8) According to the Nuclear Energy Institute, there were 58 nuclear power plants operating in the United States in 2020. The data consist of the infor- mation on the number of nuclear plants in each of the 29 states that operate nuclear plants and whether the state has passed legislation supporting nu- clear energy expansion (regulated) or not (deregulated). a) Obtain a histogram of X=the number of plants per state and comment on its shape. (2) b) Obtain the mean and standard deviation of X using descriptive sta- tistics. (1)c) According to empirical rule what percentage of the number of plants per state should lie within two standard deviations of the mean? What does Chebyshev's rule say about this percentage? Now compute the actual percentage of the number of plants per state that are within two standard deviation of the mean. (3) d) Which rule, empirical or Chebyshev's applies to the data on the num- ber of plants per state? Explain. (1) e) Does state regulation has an impact on the number of nuclear plants in a state? What method would you use to answer this question? (1) Problem 4 (8) An automobile manufacturer routinely keeps records on the number off finished cars (passing all inspections) produced per eight-hour shift. The data for the last 21 shifts are given in the stem-and-leaf display shown on the next page. a) What is median shift size? (1) b) The management of an automobile manufacturer gives bonuses to shifts with production sizes at or above the 75th percentile. Which shift size corresponds to the 75th percentile of the distribution of shift sizes? How many out of 21 shifts get a bonus? (3) c) Are there any outliers in the shift size distribution? Use the z-score to identify outlier(s).(2)WORKSHEET 1 Stem-and-Leaf Display: Shift size Stem-and-leaf of Shift size N = 21 1 28 4 1 29 1 30 1 31 32 1 33 34 2 35 9 5 36 067 6) 37 114559 10 38 013455667 1 39 0 Leaf Unit = 1 Figure 1: d) How should each observation in shift size data be transformed so that the transformed data will have the mean of zero and the standard deviation of 1? (2 ) 3Problem 5 (This question requires submission of Minitab or R output) 9) Of 67 students who responded to the class survey, 66 answered the ques- tion concerning their expected annual salary. The survey data are in the attached excel file named Statistics Class Survey. To answer questions be- low, you should use columns 2 (gender) and 7 (expected annual starting salary). a) Obtain the histogram of the expected starting annual salaries and comment on its shape. (1) b) Obtain the box plot for expected starting annual salaries and deter- mine, using the method of quartiles, if there are suspect or highly suspect outliers in the distribution of the expected starting annual salaries.(2) c) Now obtain the box plots for expected starting annual salaries by gender excluding the category Other because this category has only one observation. For for each gender, determine if there are suspect and highly suspect outliers in their respective distributions of the expected starting annual salaries. (4) d) Do the expectations of the expected starting annual salaries differ by gender? (Discuss) (2)
Step by Step Solution
There are 3 Steps involved in it
Step: 1
Get Instant Access to Expert-Tailored Solutions
See step-by-step solutions with expert insights and AI powered tools for academic success
Step: 2
Step: 3
Ace Your Homework with AI
Get the answers you need in no time with our AI-driven, step-by-step assistance