

Answered step by step
Verified Expert Solution
Question
1 Approved Answer
Assignment 2 62. The average number of times Americans dine out in a week fell from 4.0 in 2008 to 3.8 in 2012 (Zagat.com,
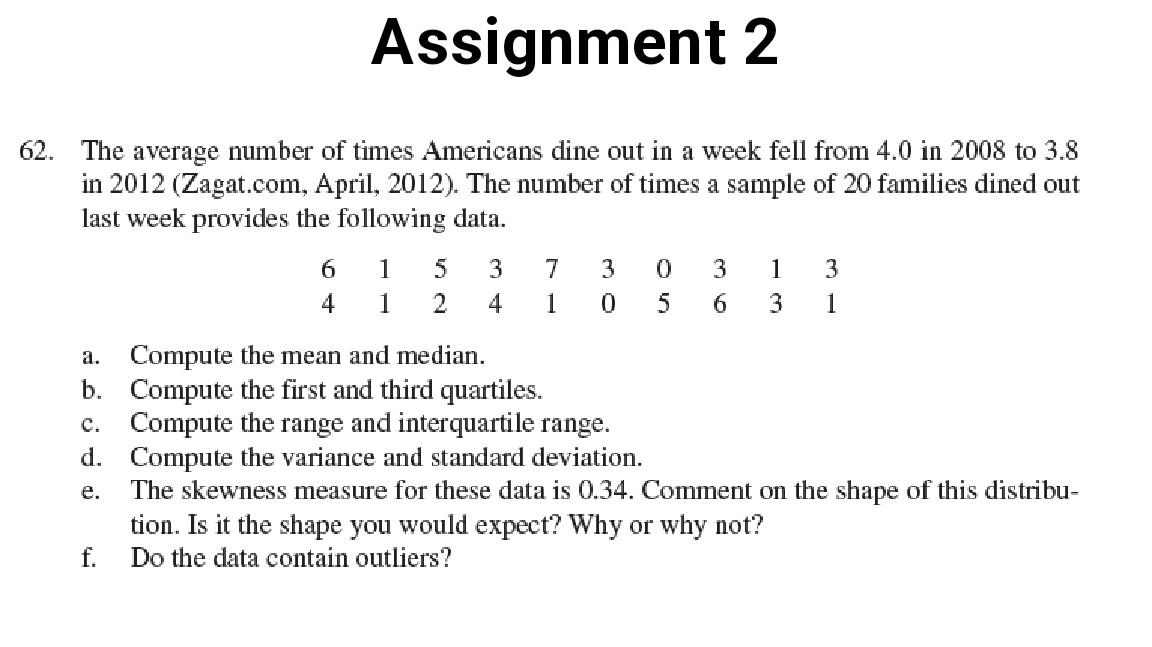
Assignment 2 62. The average number of times Americans dine out in a week fell from 4.0 in 2008 to 3.8 in 2012 (Zagat.com, April, 2012). The number of times a sample of 20 families dined out last week provides the following data. 6 1 5 3 7 3 0 3 1 3 4 1 2 4 1 0 5 6 3 1 a. Compute the mean and median. b. Compute the first and third quartiles. c. Compute the range and interquartile range. d. Compute the variance and standard deviation. e. The skewness measure for these data is 0.34. Comment on the shape of this distribu- tion. Is it the shape you would expect? Why or why not? f. Do the data contain outliers?
Step by Step Solution
There are 3 Steps involved in it
Step: 1

Get Instant Access to Expert-Tailored Solutions
See step-by-step solutions with expert insights and AI powered tools for academic success
Step: 2

Step: 3
Ace Your Homework with AI
Get the answers you need in no time with our AI-driven, step-by-step assistance
Get Started
Cambridge IGCSE And O Level Additional Mathematics
Authors: Val Hanrahan, Jeanette Powell
1st Edition
1510421645, 978-1510421646