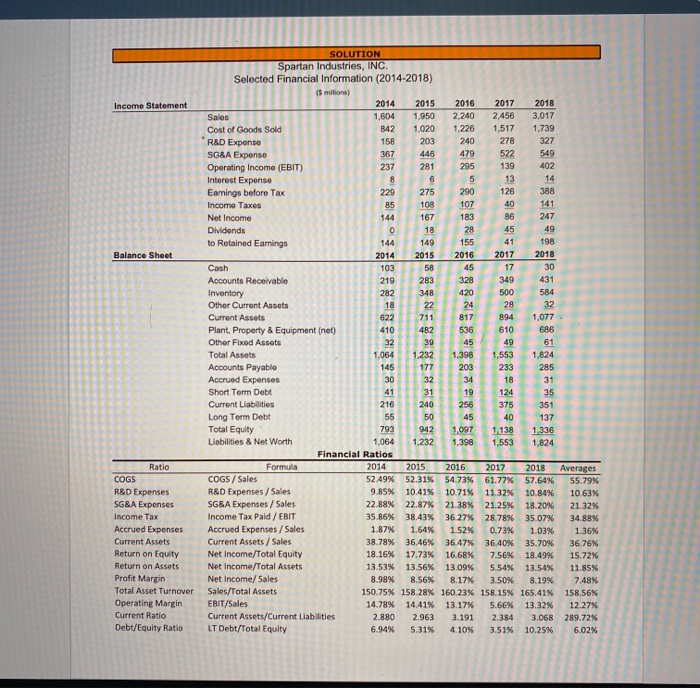
Assignment #2 Background: It is 2019. As a financial analyst working at a major investment bank you are tasked with determining a value of Spartan Industries, Inc. ("Spartan"). You previously analyzed Spartan's historical financials and calculated the following financial ratios: 1. Cost of Goods Sold (COGS) 2. R&D Expenses 3. SG&A Expenses Additionally, your team projects 8% annual revenue growth through 2022 and 2% thereafter (which represent projections for years 2023 thru 2025). The team also provided projected financial ratios for the following items: 1. Cash/Sales: 1% 2. Accounts Receivable/Sales: 14% 3. Inventory/Sales: 18% 4. Other Current Assets/Sales: 1% 5. Accounts Payable/Sales: 9% 6. Accrued Expenses/Sales: 1% 7. PP&E/Sales: 23% 8. Other Fixed Assets/Sales: 2% 9. Tax Rate: 35% 10. Dividends/Net Income:20% Finally, you may presume that the amount of Spartan's short-term debt, long-term debt and interest expense remains constant at the 2018 level. Assignment: Using the COGS, R&D and SG&A ratios calculated in Assignment #1 and the additional information provided herein, create projected financial statements for Spartan for years 2019-2025. Instructions: Use the spreadsheet from Assignment #1 building upon the financial calculations already created. NOTE: For purposes of this assignment, "balance" the balance sheet by simply subtracting liabilities from assets to calculate equity (Not how it is done in reality, but that is not the focus of this exercise.) NOTE: Round all dollar amounts to the nearest dollar and round all percentages to the nearest whole percent. MacBook Pro SOLUTION Spartan Industries, INC. Selected Financial Information (2014-2018) 2014 1,604 842 2015 1.950 1,020 203 446 281 2016 2,240 1.226 240 479 295 5 Sales Cost of Goods Sold R&D Expense SG&A Expense Operating Income (EBIT) Interest Expense Earnings before Tax Income Taxes Net Income Dividends to Retained Earnings 2017 2.456 1,517 278 522 139 13 126 2018 3,017 1.739 327 549 388 155 2016 2015 Sheet 20 328 17 349 30 431 500 584 49 61 35 351 137 1336 1,824 40 1138 1,553 942 1.232 1,390 Cash Accounts Receivable Inventory Other Current Assets Current Assets Plant, Property & Equipment (net) Other Fixed Assets Total Assets Accounts Payablo Accrued Expenses Short Term Debt Current Liabilities Long Term Debt Total Equity 793 Liabilities & Net Worth 1,064 Financial Ratios Formule 2014 COGS / Sales 52.49% R&D Expenses / Sales 9.85% SG&A Expenses / Sales 22.88% Income Tax Paid / EBIT 35.86% Accrued Expenses/Sales 1.87% Current Assets/Sales 38.78% Net Income/Total Equity 18.16% Net Income/Total Assets 13.53% Net Income/Sales 8.98% Sales/Total Assets 150.75% EBIT/Sales 14.78% Current Assets/Current Liabilities 2.880 LT Debt/Total Equity 6.94% Ratio COGS R&D Expenses SG&A Expenses Income Tax Accrued Expenses Current Assets Return on Equity Return on Assets Profit Margin Total Asset Turnover Operating Margin Current Ratio Debt/Equity Ratio 2015 52.31% 10.41% 22.87% 38.43% 1.64% 36.46% 17.73% 13.56% 8.56% 158.28% 14.41% 2.963 5.31% 2016 2017 54.73% 61.77% 10.71% 11,32% 21.38% 21.25% 36.27% 28.78% 1.52% 0.73% 36.47% 36.40% 16.68% 7.56% 13.09% 5.54% 8.17% 3.50% 160.23% 158.15% 13.17% 5.66% 3.191 2.384 4.10% 3.51% 2018 Averages 57.64% 55.79% 10.84% 10.63% 18.20% 21.32% 35.07% 34.88% 1.03% 1.36% 35.70% 36,76% 18.49% 15.72% 13.54% 11.85% 8.19% 748% 165.41% 158.56% 13.32% 12.27% 3.068 289.72% 10.25% 6.02%