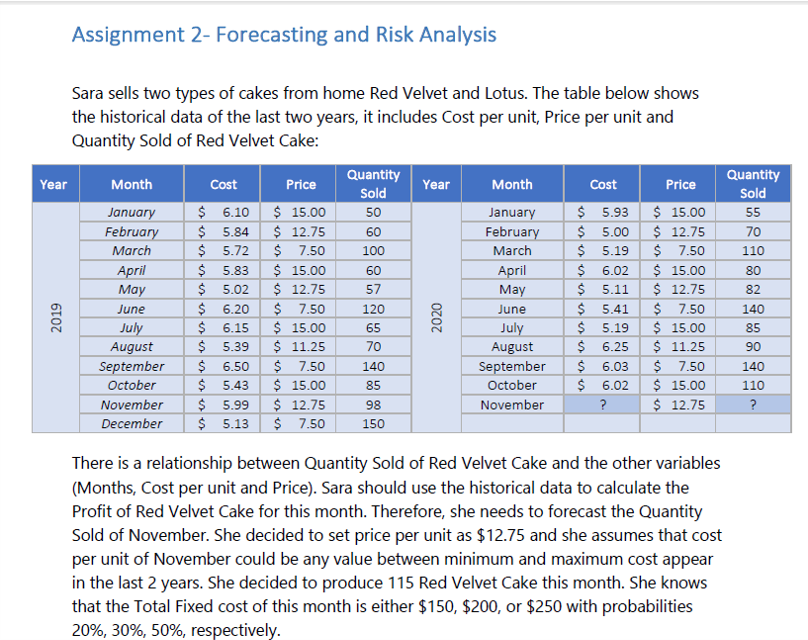
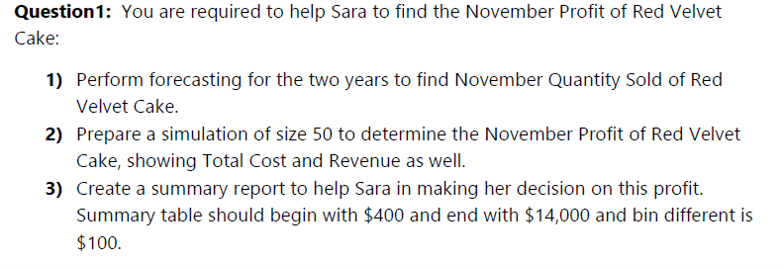
Assignment 2- Forecasting and Risk Analysis Sara sells two types of cakes from home Red Velvet and Lotus. The table below shows the historical data of the last two years, it includes Cost per unit, Price per unit and Quantity Sold of Red Velvet Cake: Year Year Month January February March April May June July August September October November December Cost $ 6.10 $ 5.84 $ 5.72 $ 5.83 $ 5.02 $ 6.20 $ 6.15 $ 5.39 $ 6.50 $ 5.43 $5.99 $ 5.13 Quantity Sold 50 60 100 60 57 120 65 70 140 85 Price $ 15.00 $ 12.75 $ 7.50 $ 15.00 $ 12.75 $ 7.50 $ 15.00 $ 11.25 $ 7.50 $ 15.00 $ 12.75 $ 7.50 Month January February March April May June July August September October November Cost $ 5.93 $ 5.00 $ 5.19 $ 6.02 $ 5.11 $ 5.41 $ 5.19 $ 6.25 $ 6.03 $ 6.02 ? Price $ 15.00 $ 12.75 $ 7.50 $ 15.00 $ 12.75 $ 7.50 $ 15.00 $ 11.25 $ 7.50 $15.00 $ 12.75 2019 Quantity Sold 55 70 110 80 82 140 85 90 2020 140 110 ? 98 150 There is a relationship between Quantity Sold of Red Velvet Cake and the other variables (Months, Cost per unit and Price). Sara should use the historical data to calculate the Profit of Red Velvet Cake for this month. Therefore, she needs to forecast the Quantity Sold of November. She decided to set price per unit as $12.75 and she assumes that cost per unit of November could be any value between minimum and maximum cost appear in the last 2 years. She decided to produce 115 Red Velvet Cake this month. She knows that the Total Fixed cost of this month is either $150, $200, or $250 with probabilities 20%, 30%, 50%, respectively. Question1: You are required to help Sara to find the November Profit of Red Velvet Cake: 1) Perform forecasting for the two years to find November Quantity Sold of Red Velvet Cake. 2) Prepare a simulation of size 50 to determine the November Profit of Red Velvet Cake, showing Total Cost and Revenue as well. 3) Create a summary report to help Sara in making her decision on this profit. Summary table should begin with $400 and end with $14,000 and bin different is $100. Assignment 2- Forecasting and Risk Analysis Sara sells two types of cakes from home Red Velvet and Lotus. The table below shows the historical data of the last two years, it includes Cost per unit, Price per unit and Quantity Sold of Red Velvet Cake: Year Year Month January February March April May June July August September October November December Cost $ 6.10 $ 5.84 $ 5.72 $ 5.83 $ 5.02 $ 6.20 $ 6.15 $ 5.39 $ 6.50 $ 5.43 $5.99 $ 5.13 Quantity Sold 50 60 100 60 57 120 65 70 140 85 Price $ 15.00 $ 12.75 $ 7.50 $ 15.00 $ 12.75 $ 7.50 $ 15.00 $ 11.25 $ 7.50 $ 15.00 $ 12.75 $ 7.50 Month January February March April May June July August September October November Cost $ 5.93 $ 5.00 $ 5.19 $ 6.02 $ 5.11 $ 5.41 $ 5.19 $ 6.25 $ 6.03 $ 6.02 ? Price $ 15.00 $ 12.75 $ 7.50 $ 15.00 $ 12.75 $ 7.50 $ 15.00 $ 11.25 $ 7.50 $15.00 $ 12.75 2019 Quantity Sold 55 70 110 80 82 140 85 90 2020 140 110 ? 98 150 There is a relationship between Quantity Sold of Red Velvet Cake and the other variables (Months, Cost per unit and Price). Sara should use the historical data to calculate the Profit of Red Velvet Cake for this month. Therefore, she needs to forecast the Quantity Sold of November. She decided to set price per unit as $12.75 and she assumes that cost per unit of November could be any value between minimum and maximum cost appear in the last 2 years. She decided to produce 115 Red Velvet Cake this month. She knows that the Total Fixed cost of this month is either $150, $200, or $250 with probabilities 20%, 30%, 50%, respectively. Question1: You are required to help Sara to find the November Profit of Red Velvet Cake: 1) Perform forecasting for the two years to find November Quantity Sold of Red Velvet Cake. 2) Prepare a simulation of size 50 to determine the November Profit of Red Velvet Cake, showing Total Cost and Revenue as well. 3) Create a summary report to help Sara in making her decision on this profit. Summary table should begin with $400 and end with $14,000 and bin different is $100