

Question
Assignment (2) Look at the financial statements excerpted from the Foundation FastTrack and answer the following questions, explaining the reasons and justification for your answers.
Assignment (2)
Look at the financial statements excerpted from the Foundation FastTrack and answer the following questions, explaining the reasons and justification for your answers. Total points (70)
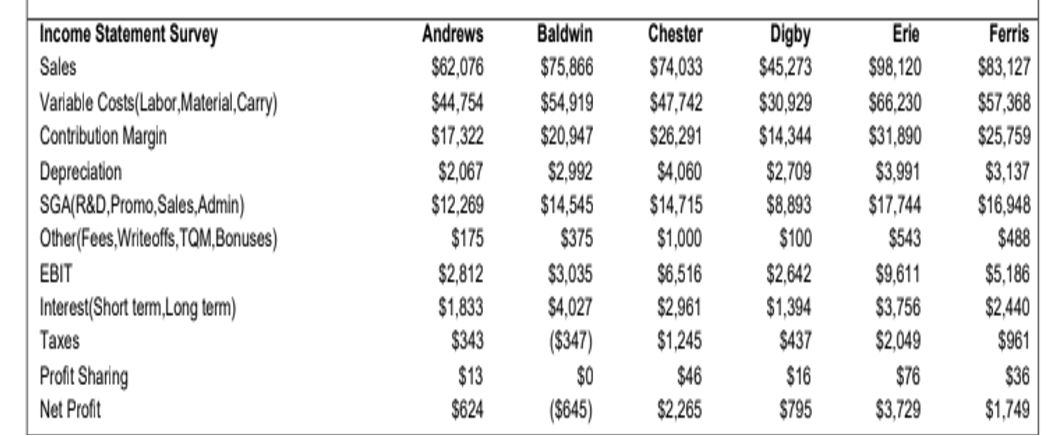
For investigating Net Profit or losses: Review Income Statement and the three profitability margins (CM, NM and ROS)
1) Look at the income statement survey. Notice that both Baldwin and Chester have sales revenue close to each other. However, Baldwin is making losses of $645 thousand while Chester is making profits over $2.2 million.
a. Why is Baldwin selling well but making losses? (4 points)
b. What could Baldwin have done differently to avoid making negative profits?
2) Look at the income statement survey.
- Calculate the contribution margin and the profit margin (return on sales) for Baldwin and Ferris. Compare the two companies and analyze the differences in their financial management based on your calculations. (18 points)
3) Why does Erie have the highest sales in the industry but not the highest profits? (4 points)
4) Calculate the ROS for the six companies. Which company is the most profitable? Is this good enough? Why or why not? (8 points)
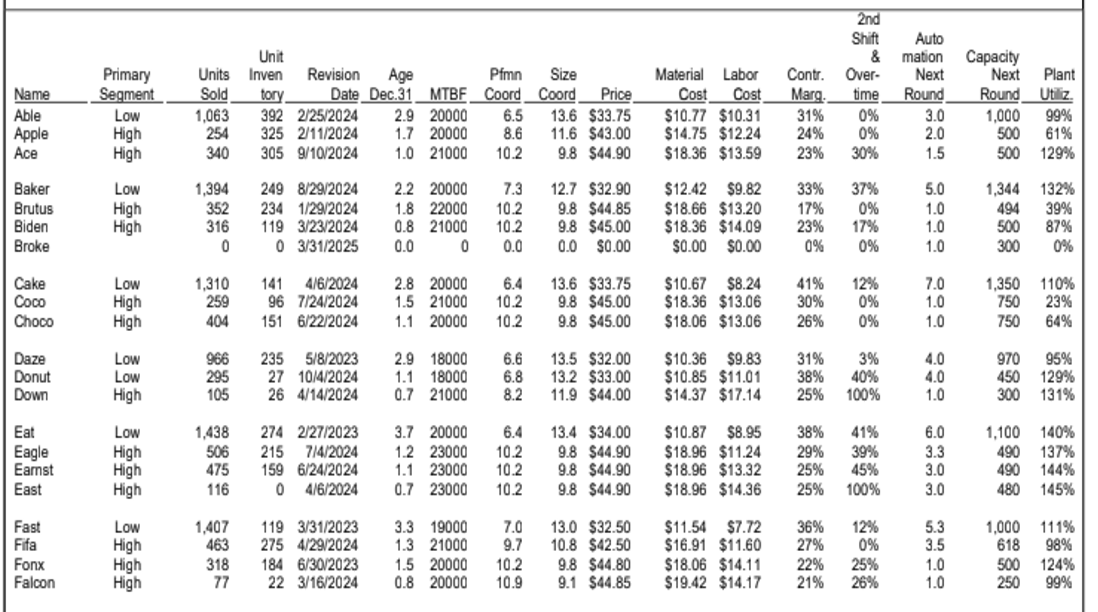
5) Calculate the contribution margins of the 6 companies. Which company has the best contribution margin? Is this good enough? Why or why not? (10 points)
6) Look at the production page of the FastTrack below and explain why the company with the highest contribution margin in question 5 was able to achieve this. (6 points)
7) Calculate the Net Margins for the 6 companies. Which company has the highest Net margin? Is this good enough? Why or why not? (10 points)
8)After 2 practice rounds, how do you assess the level of sales of the company you manage comparedto the industry average? (6 points)
(Hint: how have the companys sales grown over the period of 2 years compared to the industry average?). Since the high tech segment grows at around 20% annually and the low tech segment grows at 10% annually, the average overall industry growth is around 15% every year. After 2 practice rounds, is your company sales revenue higher or lower than the average industry level??? Check FastTrack Round 2 to know!!!
 \begin{tabular}{|lrrrrrr|} \hline Income Statement Survey & Androws & Baldwin & Chester & Digby & Erie & Ferris \\ Sales & $62,076 & $75,866 & $74,033 & $45,273 & $98,120 & $83,127 \\ Varrable Costs(Labor,Material,Carry) & $44,754 & $54,919 & $47,742 & $30,929 & $66,230 & $57,368 \\ Contribution Margin & $17,322 & $20,947 & $26,291 & $14,344 & $31,890 & $25,759 \\ Depreclation & $2,067 & $2,992 & $4,060 & $2,709 & $3,991 & $3,137 \\ SGA(R\&D,Promo,Sales,Admin) & $12,269 & $14,545 & $14,715 & $8,893 & $17,744 & $16,948 \\ Other(Fees,Writeoffs,TQM,Bonuses) & $175 & $375 & $1,000 & $100 & $543 & $488 \\ EBIT & $2,812 & $3,035 & $6,516 & $2,642 & $9,611 & $5,186 \\ Interest(Short term,Long term) & $1,833 & $4,027 & $2,961 & $1,394 & $3,756 & $2,440 \\ Taxes & $343 & ($347) & $1,245 & $437 & $2,049 & $961 \\ Profit Sharing & $13 & $0 & $46 & $16 & $76 & $36 \\ Net Profit & $624 & ($645) & $2,265 & $795 & $3,729 & $1,749 \end{tabular} \begin{tabular}{|c|c|c|c|c|c|c|c|c|c|c|c|c|c|c|c|c|} \hline Name & PrimarySegment & UnitsSold & UnitInventory & RevisionDate & AgeDec.31 & MTBF & PfmnCoord & SizeCoord & Price & MaterialCost & LaborCost & Contr.Marg. & 2ndShift&Over-time & AutomationNextRound & CapacityNextRound & PlantUtillz. \\ \hline Able & Low & 1,063 & 392 & 2/25/2024 & 2.9 & 20000 & 6.5 & 13.6 & $33.75 & $10.77 & $10.31 & 31% & 0% & 3.0 & 1,000 & 99% \\ \hline Apple & High & 254 & 325 & 2/11/2024 & 1.7 & 20000 & 8.6 & 11.6 & $43.00 & $14.75 & $12.24 & 24% & 0% & 2.0 & 500 & 61% \\ \hline Ace & High & 340 & 305 & 9/10/2024 & 1.0 & 21000 & 10.2 & 9.8 & $44.90 & $18.36 & $13.59 & 23% & 30% & 1.5 & 500 & 129% \\ \hline Baker & Low & 1,394 & 249 & 8/29/2024 & 2.2 & 20000 & 7.3 & 12.7 & $32.90 & $12.42 & $9.82 & 33% & 37% & 5.0 & 1,344 & 132% \\ \hline Brutus & High & 352 & 234 & 1/29/2024 & 1.8 & 22000 & 10.2 & 9.8 & $44.85 & $18.66 & $13.20 & 17% & 0% & 1.0 & 494 & 39% \\ \hline Biden & High & 316 & 119 & 3/23/2024 & 0.8 & 21000 & 10.2 & 9.8 & $45.00 & $18.36 & $14.09 & 23% & 17% & 1.0 & 500 & 87% \\ \hline Broke & & 0 & 0 & 3/31/2025 & 0.0 & 0 & 0.0 & 0.0 & $0.00 & $0.00 & $0.00 & 0% & 0% & 1.0 & 300 & 0% \\ \hline Cake & Low & 1,310 & 141 & 4/6/2024 & 2.8 & 20000 & 6.4 & 13.6 & $33.75 & $10.67 & $8.24 & 41% & 12% & 7.0 & 1,350 & 110% \\ \hline Coco & High & 259 & 96 & 7/24/2024 & 1.5 & 21000 & 10.2 & 9.8 & $45.00 & $18.36 & $13.06 & 30% & 0% & 1.0 & 750 & 23% \\ \hline Choco & High & 404 & 151 & 6/22/2024 & 1.1 & 20000 & 10.2 & 9.8 & $45.00 & $18.06 & $13.06 & 26% & 0% & 1.0 & 750 & 64% \\ \hline Daze & Low & 966 & 235 & 5/8/2023 & 2.9 & 18000 & 6.6 & 13.5 & $32.00 & $10.36 & $9.83 & 31% & 3% & 4.0 & 970 & 95% \\ \hline Donut & Low & 295 & 27 & 10/4/2024 & 1.1 & 18000 & 6.8 & 13.2 & $33.00 & $10.85 & $11.01 & 38% & 40% & 4.0 & 450 & 129% \\ \hline Down & High & 105 & 26 & 4/14/2024 & 0.7 & 21000 & 8.2 & 11.9 & $44.00 & $14.37 & $17.14 & 25% & 100% & 1.0 & 300 & 131% \\ \hline Eat & Low & 1,438 & 274 & 2/27/2023 & 3.7 & 20000 & 6.4 & 13.4 & $34.00 & $10.87 & $8.95 & 38% & 41% & 6.0 & 1,100 & 140% \\ \hline Eagle & High & 506 & 215 & 7/4/2024 & 1.2 & 23000 & 10.2 & 9.8 & $44.90 & $18.96 & $11.24 & 29% & 39% & 3.3 & 490 & 137% \\ \hline Earnst & High & 475 & 159 & 6/24/2024 & 1.1 & 23000 & 10.2 & 9.8 & $44.90 & $18.96 & $13.32 & 25% & 45% & 3.0 & 490 & 144% \\ \hline East & High & 116 & 0 & 4/6/2024 & 0.7 & 23000 & 10.2 & 9.8 & $44.90 & $18.96 & $14.36 & 25% & 100% & 3.0 & 480 & 145% \\ \hline Fast & Low & 1,407 & 119 & 3/31/2023 & 3.3 & 19000 & 7.0 & 13.0 & $32.50 & $11.54 & $7.72 & 36% & 12% & 5.3 & 1,000 & 111% \\ \hline Fifa & High & 463 & 275 & 4/29/2024 & 1.3 & 21000 & 9.7 & 10.8 & $42.50 & $16.91 & $11.60 & 27% & 0% & 3.5 & 618 & 98% \\ \hline Fonx & High & 318 & 184 & 6/30/2023 & 1.5 & 20000 & 10.2 & 9.8 & $44.80 & $18.06 & $14.11 & 22% & 25% & 1.0 & 500 & 124% \\ \hline Falcon & High & 77 & 22 & 3/16/2024 & 0.8 & 20000 & 10.9 & 9.1 & $44.85 & $19.42 & $14.17 & 21% & 26% & 1.0 & 250 & 99% \\ \hline \end{tabular}
 Step by Step Solution
There are 3 Steps involved in it
Step: 1

Get Instant Access to Expert-Tailored Solutions
See step-by-step solutions with expert insights and AI powered tools for academic success
Step: 2

Step: 3
Ace Your Homework with AI
Get the answers you need in no time with our AI-driven, step-by-step assistance
Get Started
Financial Times Guide To Finance For Non Financial Managers
Authors: Jo Haigh
1st Edition
0273756206, 978-0273756200