

Question
Assignment 2: The following graph will represent slices of pizza on the x-axis and U.S. dollars on the y-axis. Please start at 5 slices of
Assignment 2:
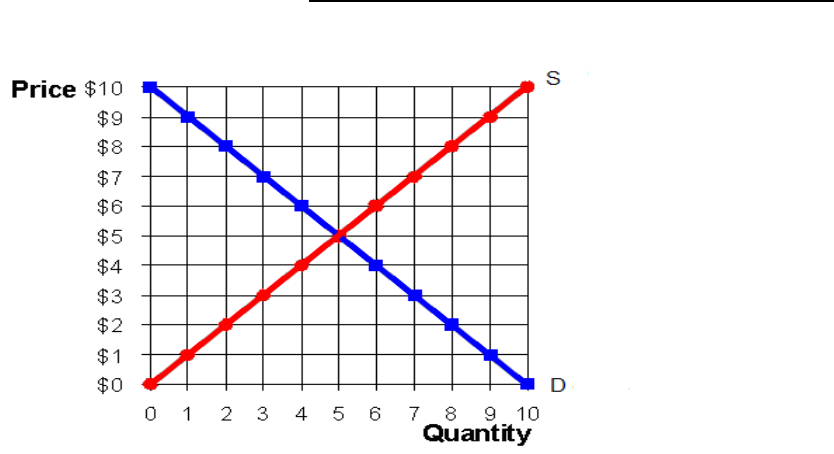
The following graph will represent slices of pizza on the x-axis and U.S. dollars on the y-axis. Please start at 5 slices of pizza and $5.00 as point A (equilibrium). Remember that the coordinates are (x, y). Use a 1 to 1 ratio for all the questions.
Step by Step Solution
There are 3 Steps involved in it
Step: 1

Get Instant Access to Expert-Tailored Solutions
See step-by-step solutions with expert insights and AI powered tools for academic success
Step: 2

Step: 3
Ace Your Homework with AI
Get the answers you need in no time with our AI-driven, step-by-step assistance
Get Started
Econometric Analysis
Authors: William H. Greene
5th Edition
130661899, 978-0130661890