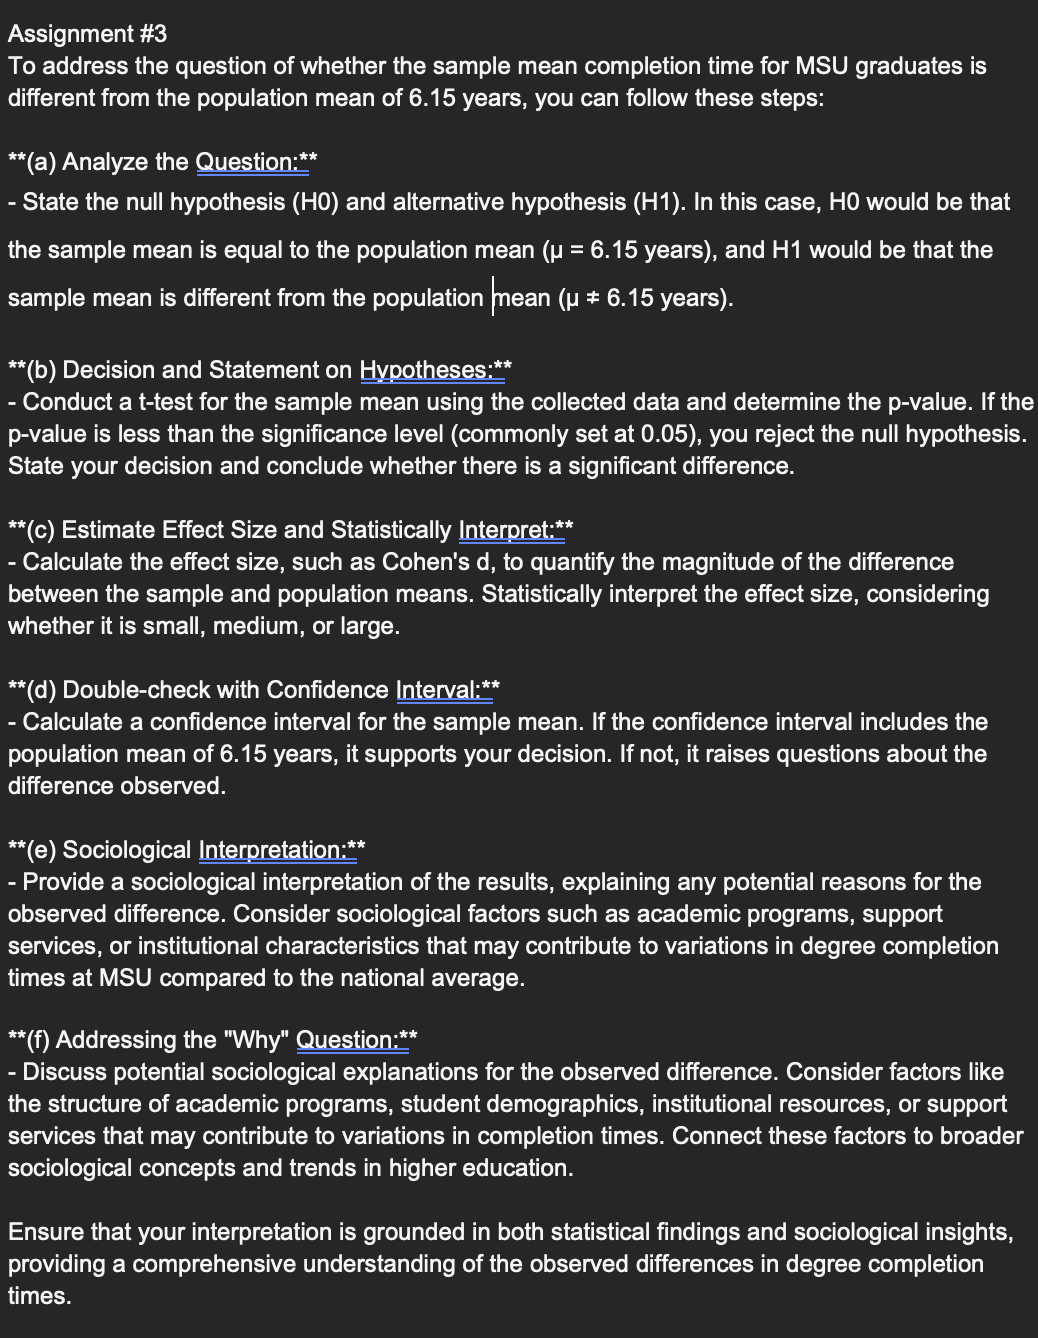
Assignment #3 To address the question of whether the sample mean completion time for MSU graduates is different from the population mean of 6.15 years, you can follow these steps: **(a) Analyze the Question:** - State the null hypothesis (HO) and alternative hypothesis (H1). In this case, HO would be that the sample mean is equal to the population mean (u = 6.15 years), and H1 would be that the sample mean is different from the population }'nean (VE R ERCE )R **(b) Decision and Statement on Hypotheses:** - Conduct a t-test for the sample mean using the collected data and determine the p-value. If the p-value is less than the significance level (commonly set at 0.05), you reject the null hypothesis. State your decision and conclude whether there is a significant difference. **(c) Estimate Effect Size and Statistically Interpret:** - Calculate the effect size, such as Cohen's d, to quantify the magnitude of the difference between the sample and population means. Statistically interpret the effect size, considering whether it is small, medium, or large. **(d) Double-check with Confidence Interval:** - Calculate a confidence interval for the sample mean. If the confidence interval includes the population mean of 6.15 years, it supports your decision. If not, it raises questions about the difference observed. **(e) Sociological Interpretation:** - Provide a sociological interpretation of the results, explaining any potential reasons for the observed difference. Consider sociological factors such as academic programs, support services, or institutional characteristics that may contribute to variations in degree completion times at MSU compared to the national average. **(f) Addressing the "Why" Question:** - Discuss potential sociological explanations for the observed difference. Consider factors like the structure of academic programs, student demographics, institutional resources, or support services that may contribute to variations in completion times. Connect these factors to broader sociological concepts and trends in higher education. Ensure that your interpretation is grounded in both statistical findings and sociological insights, providing a comprehensive understanding of the observed differences in degree completion (R


