Assignment #4 Harvard Case Individual Assignment Please read HBS Case No. 9-211-014 Compass Maritime Services, LLC: Valuing Ships and answer the following questions. Please turn
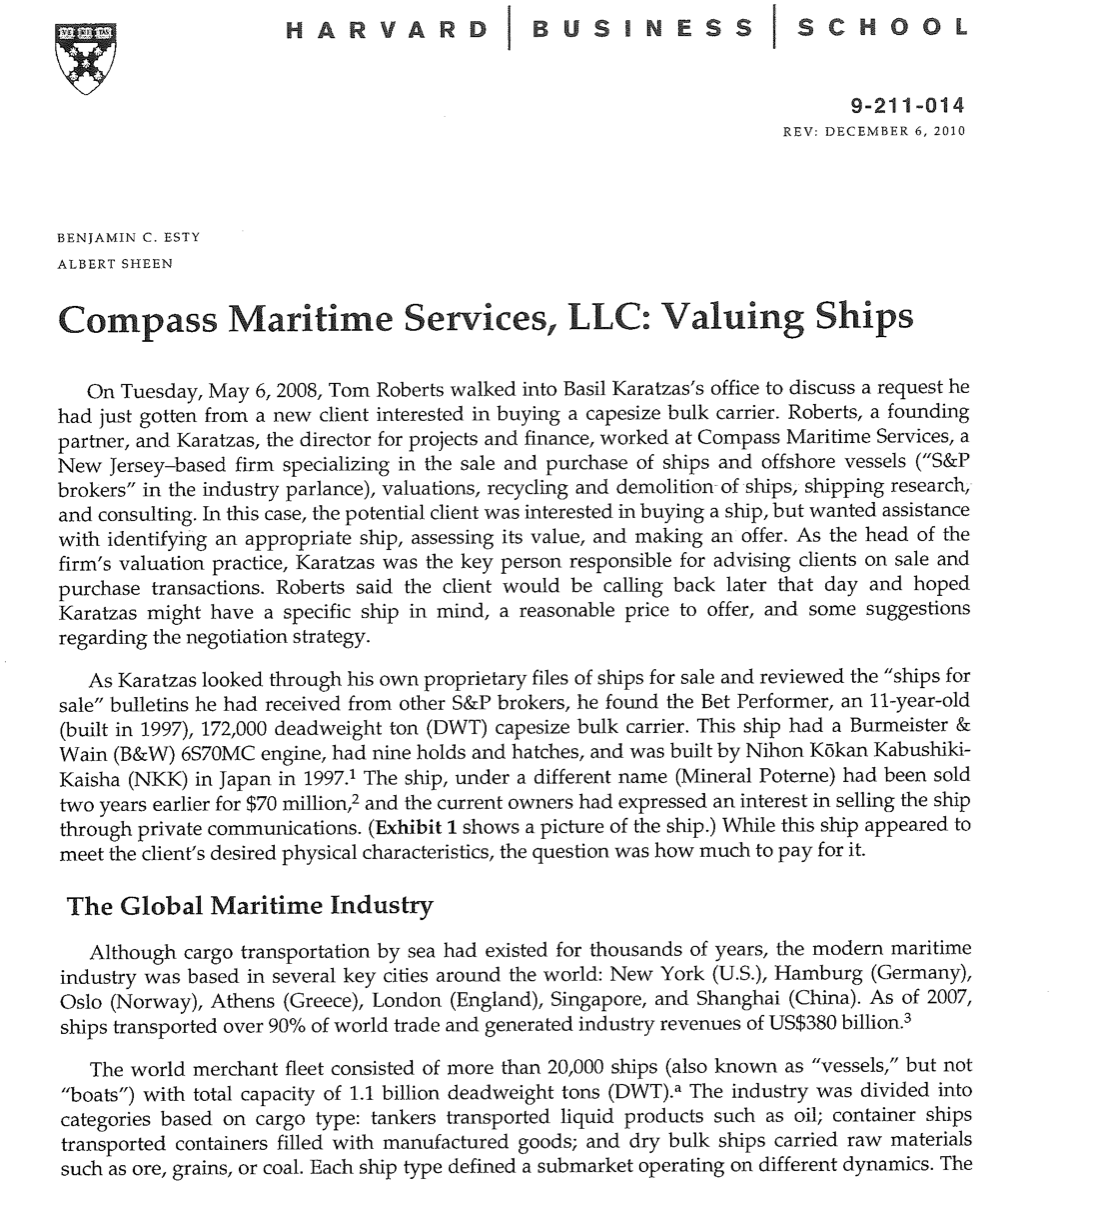
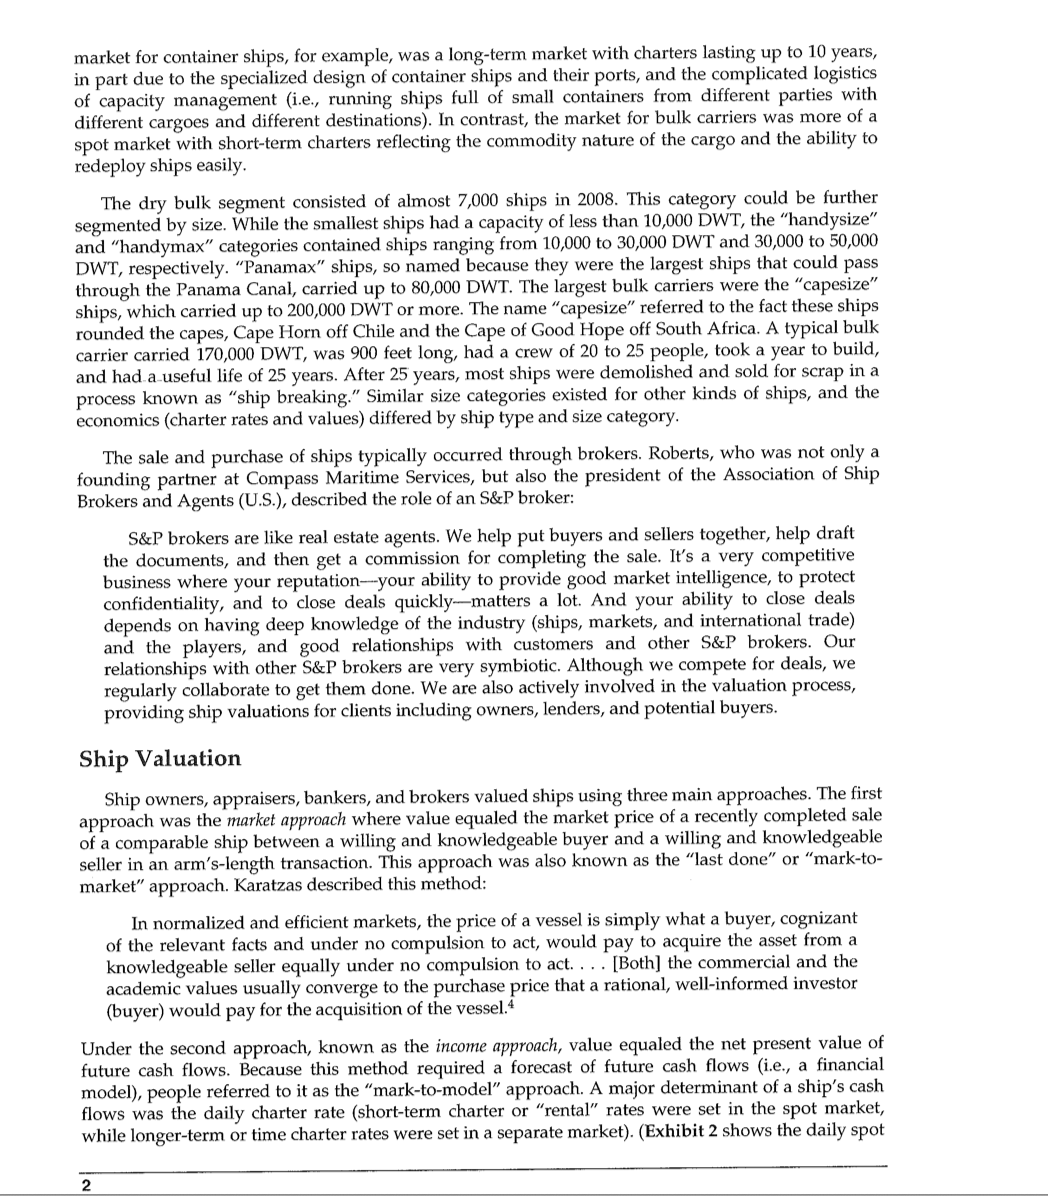
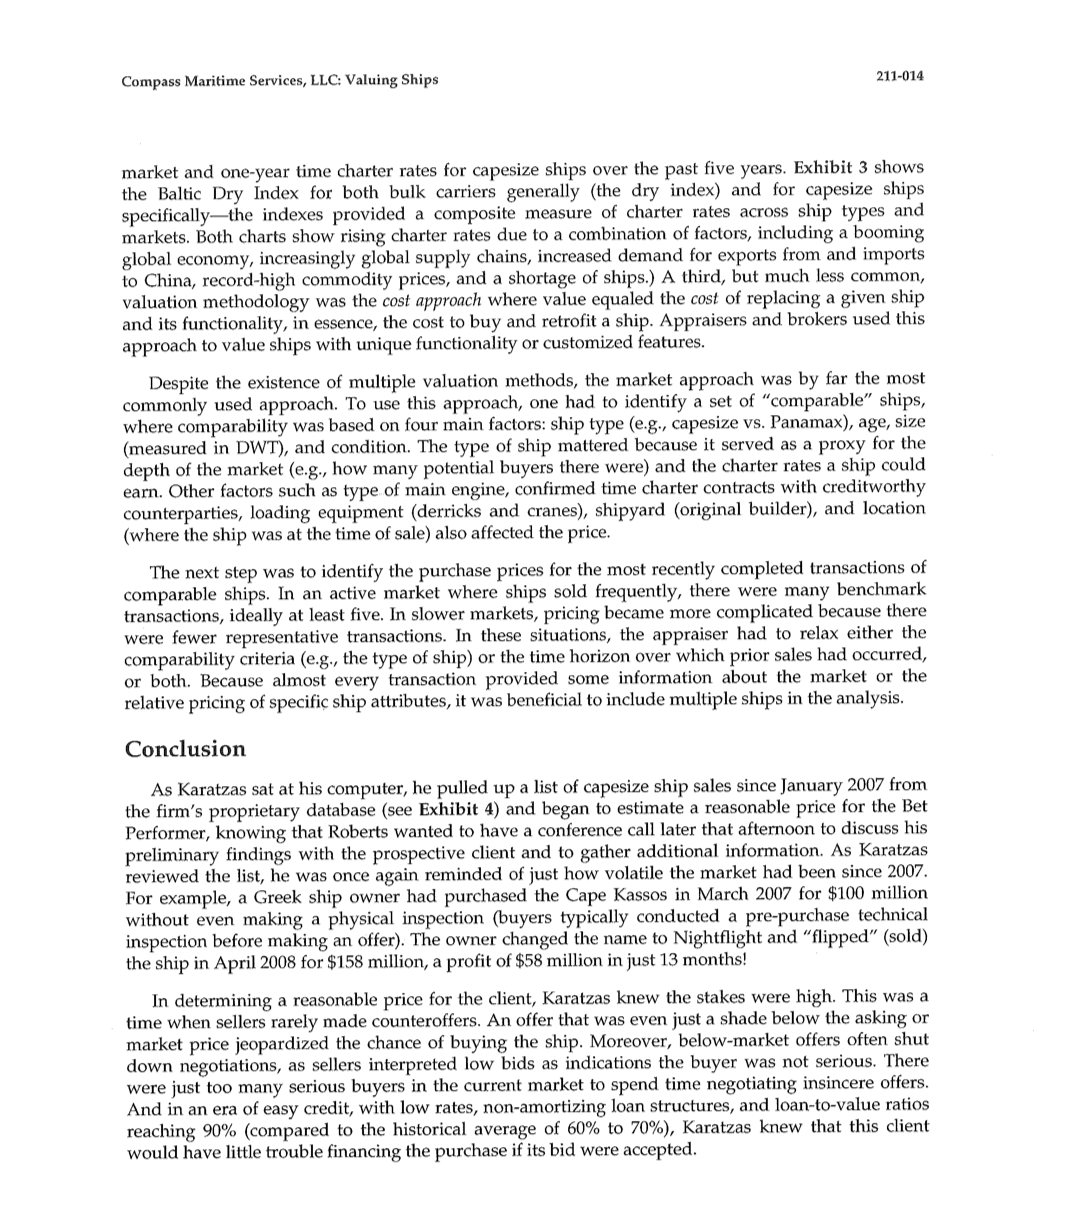
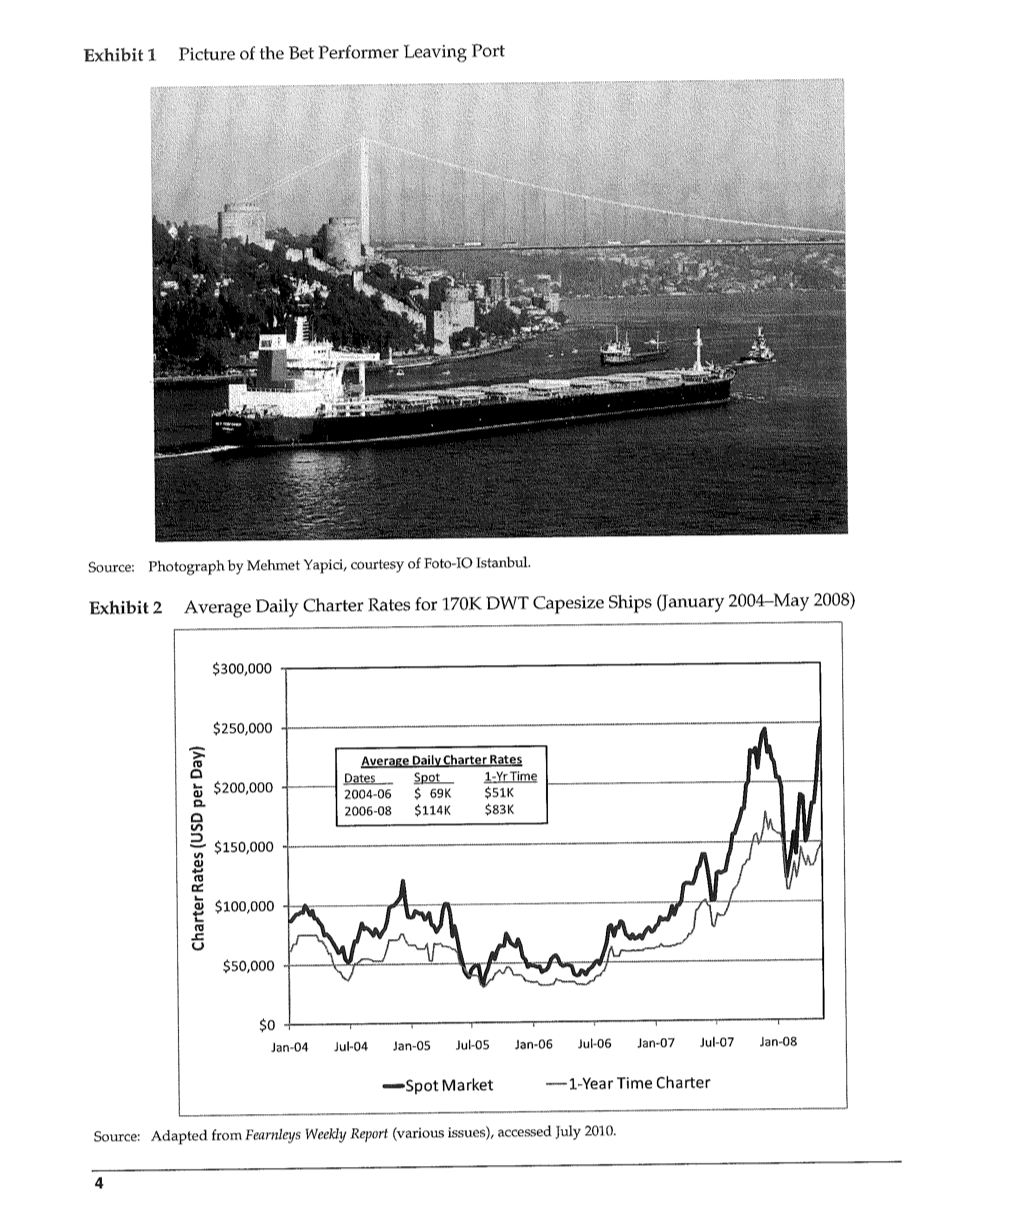
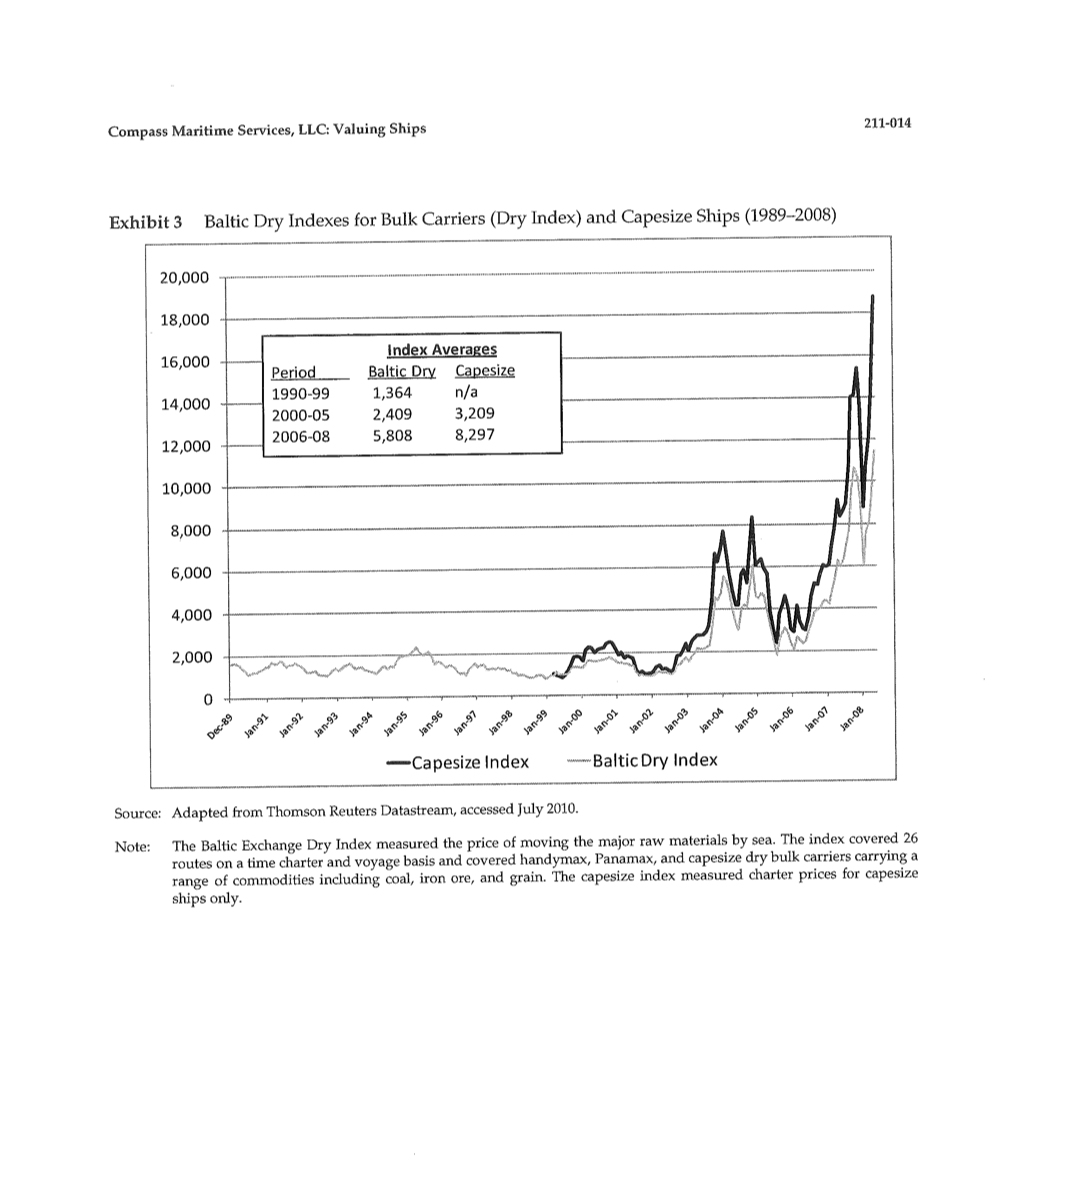
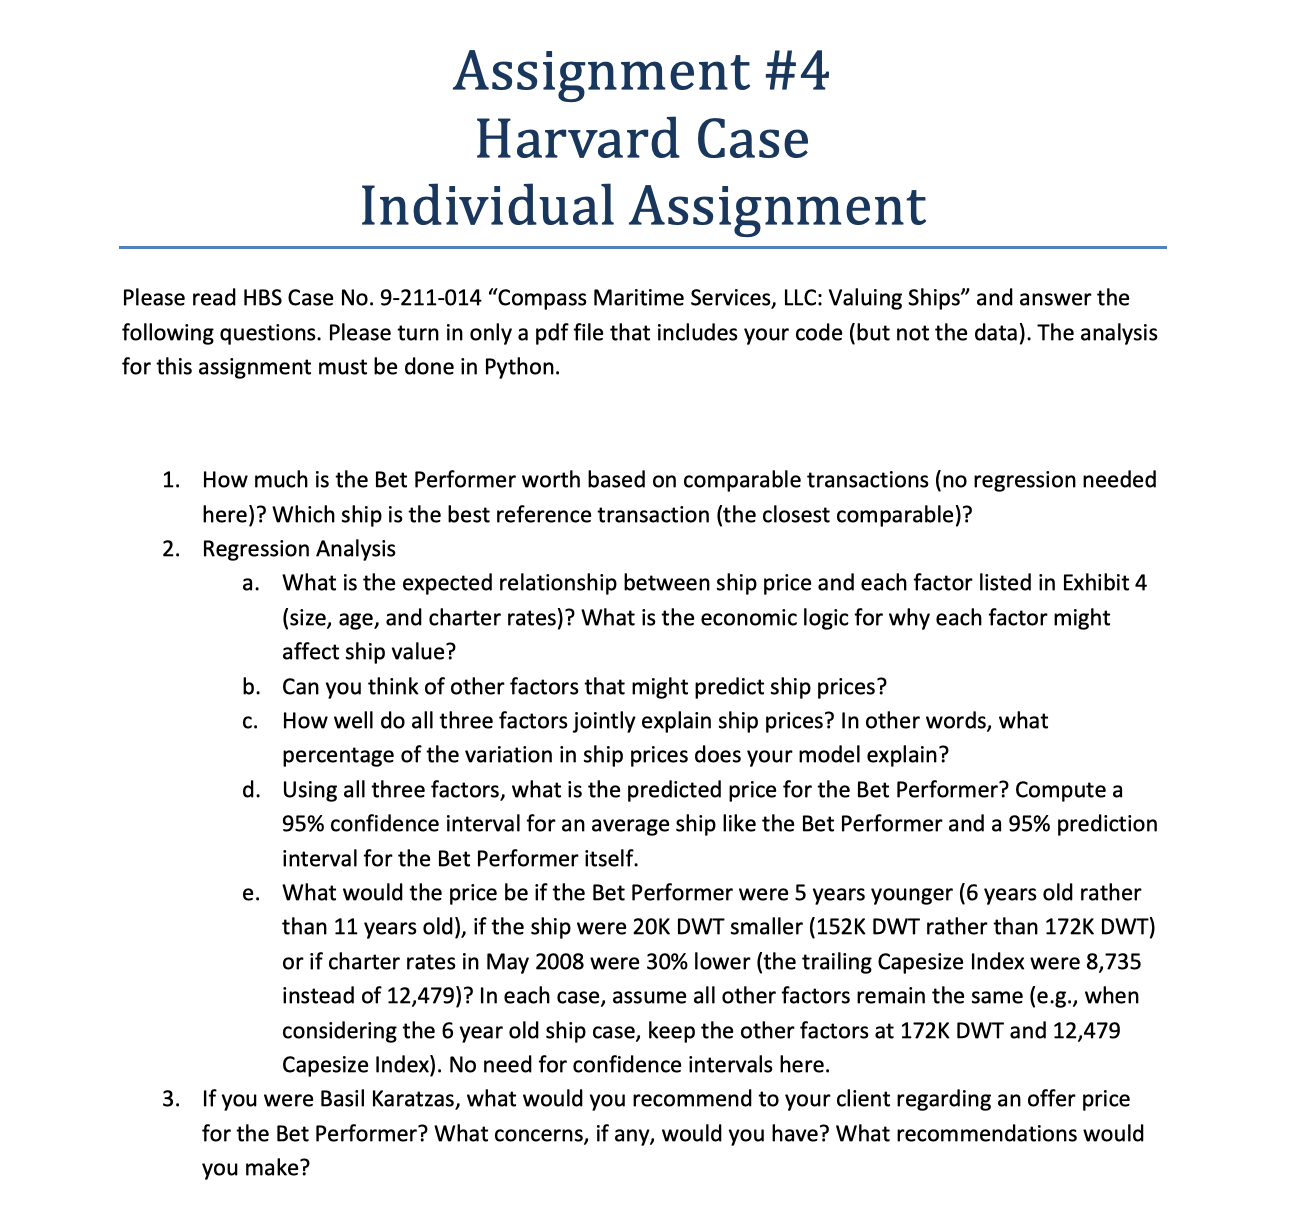
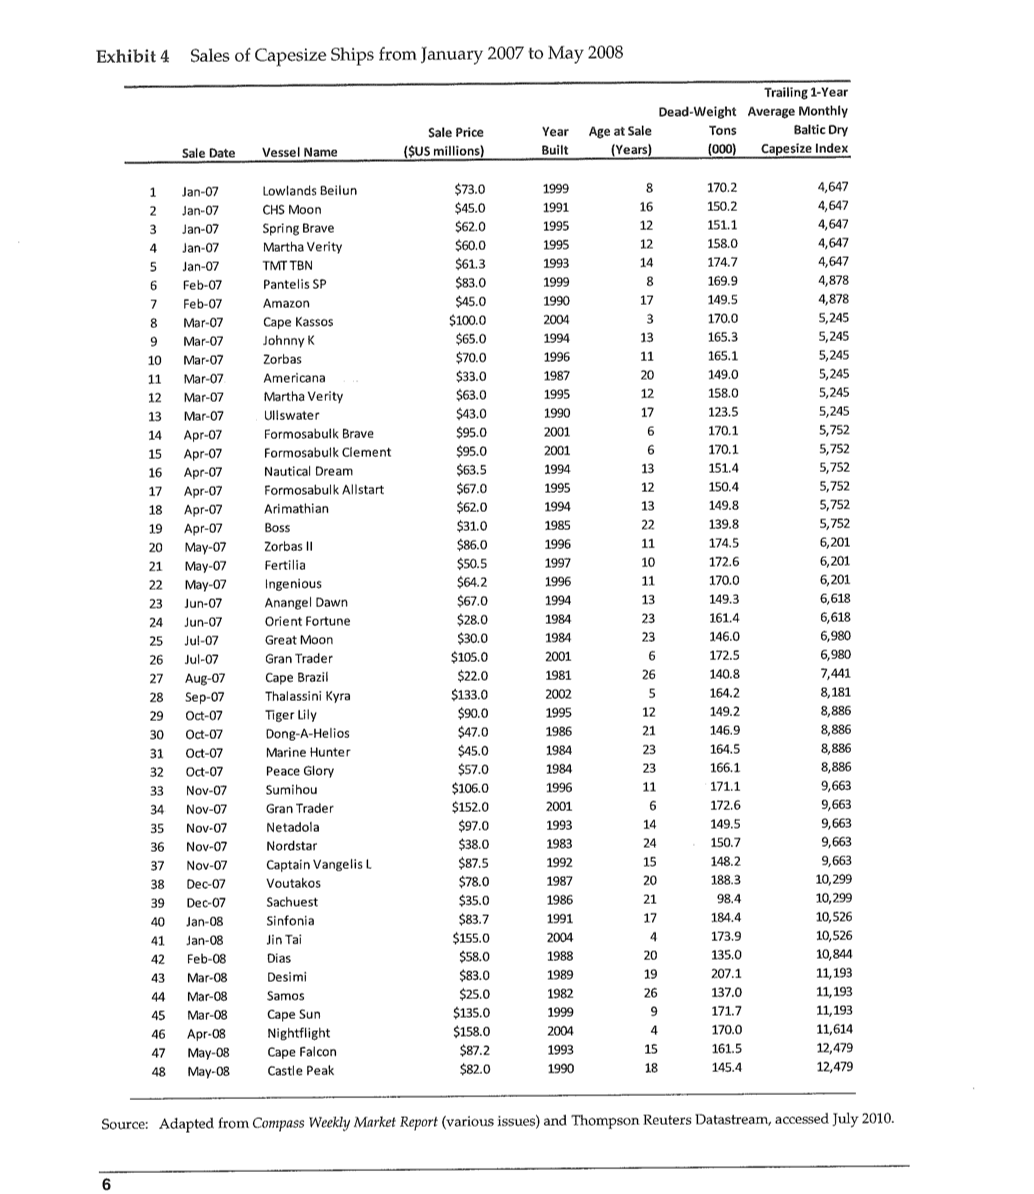
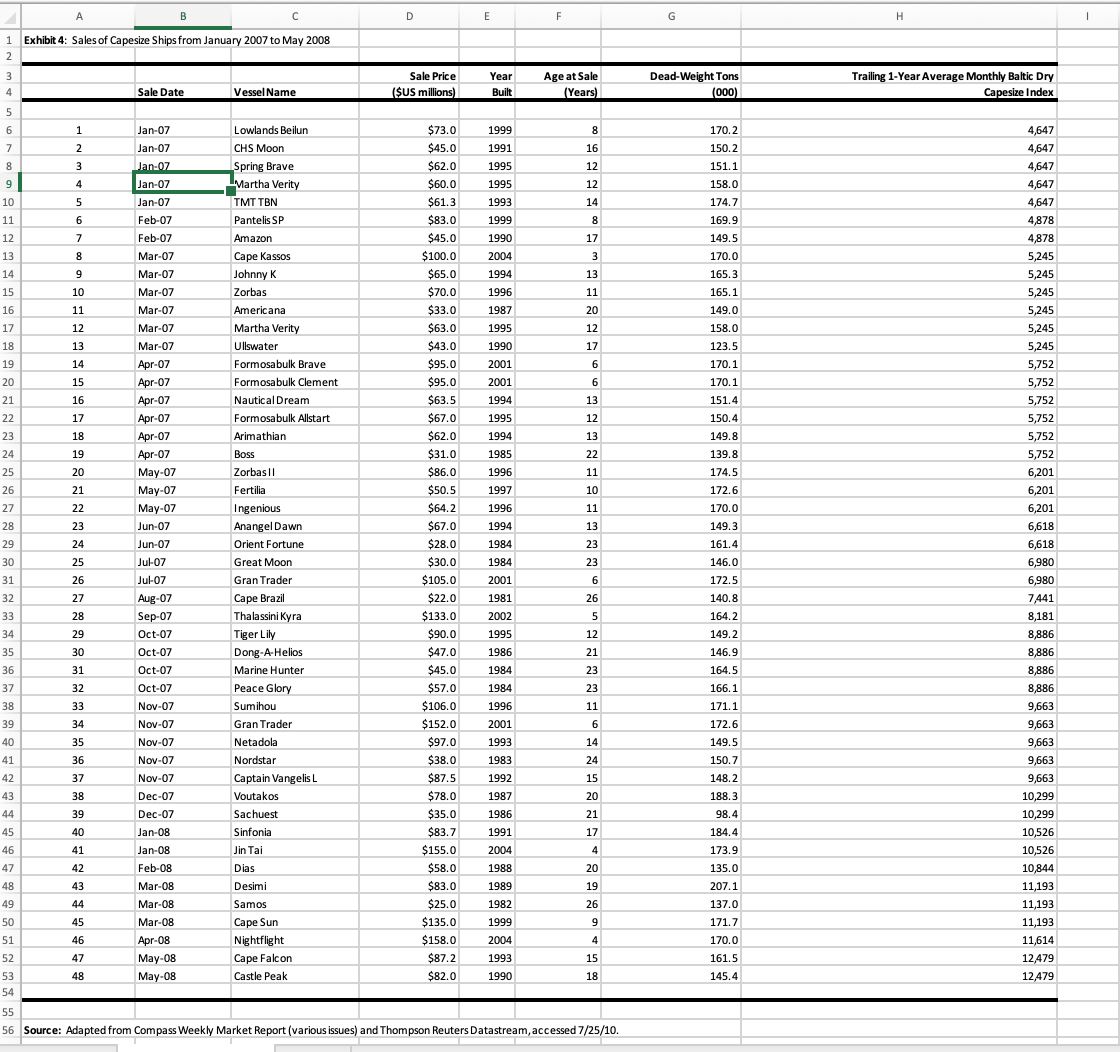
Assignment #4 Harvard Case Individual Assignment Please read HBS Case No. 9-211-014 "Compass Maritime Services, LLC: Valuing Ships\" and answer the following questions. Please turn in only a pdf le that includes your code (but not the data). The analysis for this assignment must be done in Python. 1. How much is the Bet Performer worth based on comparable transactions (no regression needed here)? Which ship is the best reference transaction (the closest comparable)? 2. Regression Analysis a. What is the expected relationship between ship price and each factor listed in Exhibit 4 (size, age, and charter rates)? What is the economic logic for why each factor might affect ship value? Can you think of other factors that might predict ship prices? How well do all three factors jointly explain ship prices? In other words, what percentage of the variation in ship prices does your model explain? Using all three factors, what is the predicted price for the Bet Performer? Compute a 95% confidence interval for an average ship like the Bet Performer and a 95% prediction interval for the Bet Performer itself. What would the price be if the Bet Performer were 5 years younger (6 years old rather than 11 years old), ifthe ship were 20K DWT smaller (152K DWT rather than 172K DWT) or if charter rates in May 2008 were 30% lower (the trailing Capesize Index were 8,735 instead of 12,479)? In each case, assume all other factors remain the same (e.g., when considering the 6 year old ship case, keep the other factors at 172K DWT and 12,479 Capesize Index). No need for confidence intervals here. 3. If you were Basil Karatzas, what would you recommend to your client regarding an offer price for the Bet Performer? What concerns, if any, would you have? What recommendations would you make? HARVARD BUSINESS SCHOOL 9-211-014 REV: DECEMBER 6, 2010 BENJAMIN C. EST! ALBERT SHEEN Compass Maritime Services, LLC: Valuing Ships On Tuesday, May 6, 2008, Tom Roberts walked into Basil Karatzas's ofce to discuss a request he had just gotten from a new client interested in buying a capesize bulk carrier. Roberts, a founding partner, and Karatzas, the director for projects and nance, worked at Compass Maritime Services, a New Jerseybased firm specializing in the sale and purchase of ships and offshore vessels (\"8&P brokers\" in the industry parlance), valuations, recycling and demolition of ships, shipping research, and consulting. In this case, the potential client was interested in buying a ship, but wanted assistance with identifying an appropriate ship, assessing its value, and making an offer. As the head of the firm's valuation practice, Karatzas was the key person responsible for advising clients on sale and purchase transactions. Roberts said the client w0uld be calling back later that day and hoped Karatzas might have a specic ship in mind, a reasonable price to offer, and some suggestions regarding the negotiation strategy. As Karatzas looked through his own proprietary les of ships for sale and reviewed the \"ships for sale\" bulletins he had received from other S&P brokers, he found the Bet Performer, an 11-year-old (built in 1997}, 172,000 deadweight ton (DWT) capesize bulk carrier. This ship had a Burmeister 8t Wain (B&W) 6870MC engine, had nine holds and hatches, and was built by Nihon Kokan Kabushiki- Kaisha (NKK) in Japan in 199?.1 The ship, under a different name (Mineral Poterne) had been sold two years earlier for $70 nn'llion,2 and the current owners had expressed an interest in selling the ship through private communications. (Exhibit 1 shows a picture of the ship.) While this ship appeared to meet the client's desired physical characteristics, the question was how much to pay for it. The Global Maritime Industry Although cargo transportation by sea had existed for thousands of years, the modern maritime industry was based in several key cities arormd the world: New York (U.S.), Hamburg (Germany), Oslo (Norway), Athens (Greece), London (England), Singapore, and Shanghai (China). As of 2007, ships transported over 90% of world trade and generated industry revenues of US$380 billion.3 The world merchant eet consisted of more than 20,000 ships (also known as "vessels,\" but not \"boats") with total capacity of 1.1 billion deadweight tons (Dlr'tlT).a The industry was divided into categories based on cargo type: tankers transported liquid products such as oii; container ships transported containers filled with manufactured goods; and dry bulk ships carried raw materials such as ore, grains, or coal. Each ship type dened a submarket operating on different dynamics. The market for container ships, for example, was a long-term market with charters lasting up to 10 years, in part due to the specialized design of container ships and their ports, and the complicated logistics of capacity management (i.e., running ships full of small containers from different parties with different cargoes and different destinations). In contrast, the market for bulk carriers was more of a spot market with short-term charters reecting the commodity nature of the cargo and the ability to redeploy ships easily. The dry bulk segment consisted of almost 7,000 ships in 2008. This category could be further segmented by size. While the smallest ships had a capacity of less than 10,000 DWT, the \"handysize\" and \"handymax\" categories contained ships ranging from 10,000 to 30,000 DWT and 30,000 to 50,000 DWT, respectively. "Panamax" ships, so named because they were the largest ships that mold pass thrOugh the Panama Canal, carried up to 80,000 DWT. The largest bulk carriers were the "capesize" ships, which carried up to 200,000 D'WT or more. The name "capesize\" referred to the fact these ships rounded the capes, Cape Horn off Chile and the Cape of Good Hope off South Africa. A typical bulk carrier carried 170,000 DWT, was 900 feet long, had a crew of 20 to 25 people, took a year to build, and badeuseful life of 25 years. After 25' years, most ships were demolished and sold for scrap in a process known as "ship breaking." Similar size categories existed for other kinds of ships, and the economics (charter rates and values) differed by ship type and size category. The sale and purchase of ships typically occurred through brokers. Roberts, who was not only a founding partner at Compass Maritime Services, but also the president of the Association of Ship Brokers and Agents (US), described the role of an 8&1' broker: Stir? brokers are like real estate agents. We help put buyers and sellers together, help draft the documents, and then get a commission for completing the sale. It's a very competitive business where your reputationyour ability to provide good market intelligence, to protect confidentiality, and to close deals quicklymatters a lot. And your ability to close deals depends on having deep knowledge of the industry (ships, markets, and international trade) and the players, and good relationships with customers and other 55:? brokers. Our relationships with other 881:? brokers are very symbiotic. Although we compete for deals, we regularly collaborate to get them done. We are also actively involved in the valuation process, providing ship valuations for clients including owners, lenders, and potential buyers. Ship Valuation Ship owners, appraisers, bankers, and brokers valued ships using three main approaches. The first approach was the market approach where value equaled the market price of a recently completed sale of a comparable ship between a willing and knowledgeable buyer and a willing and knowledgeable seller in an arm's-length transaction. This approach was also known as the \"last done" or "mark-to- market" approach. Karatzas described this method: In normalized and efficient markets, the price of a vessel is simply what a buyer, cognizant of the relevant facts and under no compulsion to act, would pay to acquire the asset from a knowledgeable seller equally under no compulsion to act. . . . [Both] the commercial and the academic values usually converge to the purchase price that a rational, well-informed investor (buyer) would pay for the acquisition of the vessel.' Under the second approach, known as the income approach, value equaled the net present value of future cash flows. Because this method required a forecast of future cash flows {i.e., a nancial model), people referred to it as the \"mark-to-model\" approach. A major determinant of a ship's cash flows was the daily charter rate (short-term charter or "rental" rates were set in the spot market, while longer-term or time charter rates were set in a separate market}. (Exhibit 2 shows the daily spot ----_---'""""\"\"\"''_ 2 Compass Maritime Services, LLC: Valuing Ships 2114114 market and one-year time charter rates for capesize ships over the past five years. Exhibit 3 shows the Baltic Dry Index for both bulk carriers generaliy (the dry index) and for capesize ships specificallythe indexes provided a composite measure of charter rates across ship types and markets. Both charts show rising charter rates due to a combination of factors, including a booming global economy, increasingly global supply chains, increased demand for exports from and imports to China, record-high commodity prices, and a shortage of ships.) A third, but much less common, valuation methodology was the cost approach where value equaled the cost of replacing a given ship and its functionality, in essence, the cost to buy and retrofit a ship. Appraisers and brokers used this approach to value ships with unique functionality or Customized features. Despite the existence of multiple valuation methods, the market approach was by far the most commonly used approach. To use this approach, one had to identify a set of "comparable\" ships, where comparability was based on four main factors: ship type (e.g., capesize vs. Panamax), age, size (measured in DWI), and condition. The type of ship mattered because it served as a proxy for the depth of the market (e.g., how many potential buyers there were} and the charter rates a ship could earn. Other factors such as type of main engine, continued time charter contracts with creditworthy counterparties, loading equipment (derricks and cranes), shipyard (original builder), and location (where the ship was at the time of sale) also affected the price. The next step was to identify the purchase prices for the most recently completed transactions of comparable ships. In an active market where ships sold frequently, there were many benchmark transactions, ideally at least five. In slower markets, pricing became more complicated because there were fewer representative transactions. In these situations, the appraiser had to relax either the comparability criteria (e.g., the type of ship) or the time horizon over which prior sales had occurred, or both. Because almost every transaction provided some information about the market or the relative pricing of specic ship attributes, it was benecial to include multiple ships in the analysis. Conclusion As Karatzas sat at his computer, he pulled up a list of capesize ship sales since January 20-07 from the firm's proprietary database (see Exhibit 4) and began to estimate a reasonable price for the Bet Performer, knowing that Roberts wanted to have a conference call later that afternoon to discuss his preliminary findings with the prospective client and to gather additional information. As Karatzas reviewed the list, he was once again reminded of just how volatile the market had been since 2007. For example, a Greek ship owner had purchased the Cape Kassos in March 2007 for $100 million without even making a physical inspection (buyers typically conducted a pro-purchase technical inspection before making an offer). The owner changed the name to Nightight and \"ipped\" (sold) the ship in April 2008 for $158 million, a profit of $58 million in just 13 months! In determining a reasonable price for the client, Karatzas knew the stakes were high. This was a time when sellers rarely made counteroffers. An offer that was even just a shade be10w the asking or market price jeopardized the chance of buying the ship. Moreover, below-market offers often shut down negotiations, as sellers interpreted low bids as indications the buyer was not serious. There were just too many serious buyers in the current market to spend time negotiating insincere offers. And in an era of easy credit, with low rates, non-amortizing loan structures, and loan-to-value ratios reaching 90% (compared to the historical average of 60% to 70%), Karatzas knew that this client would have little trouble financing the purchase if its bid were accepted. Exhibit 1 Picture of the Bet Performer Leaving Port Source: Photograph by Mehmet Yapici, courtesy of Foto-IO Istanbul. Exhibit 2 Average Daily Charter Rates for 170K DWT Capesize Ships (January 2004-May 2008) $300,000 $250,000 Average Daily Charter Rates 200,000 Dates Spot 1-Yr Time 2004-06 $ 69K $51K 2006-08 $114K $83K Charter Rates (USD per Day) $150,000 $100,000 $50,000 $0 Jan-04 Jul-04 Jan-05 Jul-05 Jan-06 Jul-06 J Jan-07 Jul-07 Jan-08 -Spot Market -1-Year Time Charter Source: Adapted from Fearnleys Weekly Report (various issues), accessed July 2010.Compass Maritime Services, LLC: Valuing Ships 211-014 Exhibit 3 Baltic Dry Indexes for Bulk Carriers (Dry Index) and Capesize Ships (1989-2008) 20,000 18,000 16,000 Index Averages Period Baltic Dry Capesize 14,000 1990-99 1,364 n/a 2000-05 2,409 3,209 12,000 2006-08 5,808 8,297 10,000 8,000 6,000 4,000 2,000 Jan.9 Jan-9 1an-93 Jan-94 Jan-95 jan-go jan- 9 9 jan-oo Janos Jan-06 an-07 Jan-08 Capesize Index -Baltic Dry Index Source: Adapted from Thomson Reuters Datastream, accessed July 2010. Note: The Baltic Exchange Dry Index measured the price of moving the major raw materials by sea. The index covered 26 routes on a time charter and voyage basis and covered handymax, Panamax, and capesize dry bulk carriers carrying a range of commodities including coal, iron ore, and grain. The capesize index measured charter prices for capesize ships only.Exhibit 4 Sales of Capesize Ships from January 2007 to May 2008 Trailing 1-Year Dead-Weight Average Monthly Sale Price Year Age at Sale Tons Baltic Dry Sale Date Vessel Name (SUS millions) Built (Years) (000) Capesize Index Jan-07 Lowlands Beilun $73.0 1999 170.2 4,647 Jan-07 CHS Moon $45.0 1991 150.2 4,647 Jan-07 Spring Brave $62.0 1995 151. 4,647 Jan-07 Martha Verity $60.0 1995 158.0 4,647 Jan-07 TMT TBN $61.3 1993 174. 4,647 Feb-07 Pantelis SP $83.0 1999 169.9 4,878 Feb-07 Amazon $45.0 1990 149.5 4,878 Mar-07 Cape Kassos $100. 2004 170.0 5,245 Mar-07 Johnny K $65. 1994 165.3 5,245 Mar-07 Zorbas $70.0 1996 165.1 5,245 Mar-07 Americana $33.0 1987 149.0 5,245 Mar-07 Martha Verity $63.0 1995 158.0 5,245 13 Mar-07 Ullswater $43.0 1990 123.5 5,245 14 Apr-O Formosabulk Brave $95.0 2001 170.1 5,752 15 Apr-07 Formosabulk Clement $95.0 2001 170.1 5,752 16 Apr-07 Nautical Dream $63.5 1994 151.4 5,752 17 Apr-07 Formosabulk Allstart $67.0 1995 150.4 5,752 18 Apr-07 Arimathian $62.0 1994 149.8 5,752 19 Apr-07 Boss $31.0 1985 139.8 5,752 20 May-07 Zorbas II $86.0 1996 174. 6,201 May-07 Fertilia $50.5 1997 172.6 6,201 May-07 Ingenious $64.2 1996 170.0 6,201 23 Jun-07 Anangel Dawn $67.0 199 149.3 6,618 24 Jun-07 Orient Fortune $28.0 1984 161.4 6,618 25 Jul-07 Great Moon $30.0 1984 146.0 6,980 26 Jul-07 Gran Trader $105.0 2001 172.5 6,980 27 Aug-07 Cape Brazi 22.0 1981 26 140.8 7,441 28 Sep-07 Thalassini Kyra $133.0 2002 164. 8,181 29 Oct-07 Tiger Lily $90.0 1995 12 149.2 8,886 30 Oct-07 Dong-A-Helios $47.0 1986 146.9 8,886 31 Oct-07 Marine Hunter $45.0 1984 164.5 8,886 32 Oct-07 Peace Glory $57.0 1984 166.1 8,886 33 Nov-07 Sumihou $106.0 1996 171.1 9,663 34 Nov-07 Gran Trader $152. 2001 172.6 9,663 35 Nov-07 Netadola $97.0 1993 14 149.5 9,663 36 Nov-0 Nordstar $38.0 1983 24 150.7 9.663 37 Nov-0 Captain Vangelis L $87.5 1992 15 148.2 9,663 Dec-07 Voutakos $78. 1987 20 188.3 10,299 Dec-07 Sachuest $35.0 1986 18.4 10,299 Jan-0 Sinfonia $83.7 1991 184. 10,526 Jan-08 Jin Tai $155.0 2004 173.9 10,526 Feb-08 Dias $58.0 1988 20 135.0 10,844 Mar-08 Desimi $83.0 1989 19 207.1 11,193 44 Mar-08 Samos $25.0 1982 137.0 11,193 45 Mar-08 Cape Sun $135.0 1999 171.7 11, 193 46 Apr-08 Nightflight $158.C 2004 170.0 11,614 47 May-08 Cape Falcon $87.2 1993 15 161.5 12,479 May-08 Castle Peak $82.0 1990 18 145.4 12,479 Source: Adapted from Compass Weekly Market Report (various issues) and Thompson Reuters Datastream, accessed July 2010.B D Exhibit 4: Sales of Capesize Ships from January 2007 to May 2008 Sale Price fear Age at Sale Dead-Weight Tons Trailing 1-Year Average Monthly Baltic Dry Sale Date Vessel Name ($US millions) Built (Years) (000) Capesize Index Jan-07 Lowlands Beilun $73.0 1999 170.2 4,647 an-07 CHS Moon $45.0 1991 16 150.2 4,647 Jan-0 Spring Brave $62.0 1995 12 151.1 4,647 Jan-07 Martha Verity $60.0 1995 12 158.0 1,647 Jan-07 TMT TB $61.3 1993 14 174.7 4,647 Feb-07 Pantelis SP $83.0 1999 8 169.9 4,878 Feb-07 Amazon $45.0 1990 17 149.5 4,878 Mar-0 Cape Kassos $100.0 2004 170.0 5,245 Mar-07 Johnny K $65.0 1994 13 165.3 5,245 Mar-07 Zorbas $70.0 1996 11 165.1 5,245 Mar-07 Americana $33.0 1987 20 149.0 5,245 Mar-07 Martha Verity $63.0 1995 12 158.0 5,245 Mar-07 Ullswater $43.0 1990 17 123.5 5,245 Apr-07 Formosabulk Brave $95.0 2001 170.1 5,752 Apr-07 Formosabulk Clement $95.0 2001 170.1 5,752 Apr-07 Nautical Dream $63.5 1994 13 151.4 5,752 Apr-07 Formosabulk Allstart $67.0 1995 12 150.4 5,752 pr-07 Arimathian $62.0 1994 13 149.8 5,752 Apr-07 Boss $31.0 1985 22 139.8 5,752 May-07 Zorbas!I $86.0 1996 11 174.5 6,201 May-07 Fertilia $50.5 1997 10 172.6 5,201 May-07 Ingenious $64.2 1996 11 170.0 6,201 Jun-07 Anangel Dawn $67.0 1994 13 149.3 6,618 un-07 Orient Fortune $28.0 1984 23 161.4 5,618 lul-07 Great Moon $30.0 1984 23 146.0 ,980 26 Jul-07 Gran Trader $105.0 2001 6 172.5 6,980 27 Aug-07 Cape Brazi $22.0 1981 26 140.8 7441 Sep-07 Thalassini Kyra $133.0 2002 64.2 3,181 Oct-07 Tiger Lily $90.0 1995 12 149.2 8,886 Oct-07 Dong-A-Helio $47.0 1986 21 146.9 8,886 Oct-07 Marine Hunter $45.0 1984 23 164.5 8,886 Oct-07 Peace Glory $57.0 1984 23 166.1 3,886 Nov-07 Sumihou $106.0 1996 11 171.1 9,663 Nov-07 Gran Trader $152.0 2001 6 172.6 9,663 Nov-07 Netadola $97.0 1993 14 149.5 9,663 Nov-0 Nordstar $38.0 1983 24 150.7 9,663 Nov-07 Captain Vangelis L $87.5 1992 15 148.2 9,663 Dec-07 Voutakos $78.0 1987 20 188.3 10,299 Dec-07 Sachuest $35.0 1986 21 98.4 10,299 Jan-08 Sinfonia $83.7 1991 17 84.4 10,526 Jan-08 Jin Tai $155.0 2004 4 173.9 10,526 Feb-08 Dias $58.0 1988 20 135.0 10,844 Mar-08 Desimi $83.0 1989 19 207.1 11,193 Mar-08 Samo $25.0 1982 26 137.0 11,193 Mar-08 Cape Sun $135.0 1999 171.7 11,193 pr-08 Nightflight $158.0 2004 170.0 11,614 May-08 Cape Falcon $87.2 1993 161.5 12,479 May-08 Castle Peak $82.0 1990 145.4 12,479 56 Source: Adapted from Compass Weekly Market Report (various issues) and Thompson Reuters Datastream, accessed 7/25/10
Step by Step Solution
There are 3 Steps involved in it
Step: 1
Get Instant Access to Expert-Tailored Solutions
See step-by-step solutions with expert insights and AI powered tools for academic success
Step: 2
Step: 3
Ace Your Homework with AI
Get the answers you need in no time with our AI-driven, step-by-step assistance