

Question: Assignment - An Individual Assignment Use the assumptions, ratios and data provided to develop a forecast of the company financial statements for the next five
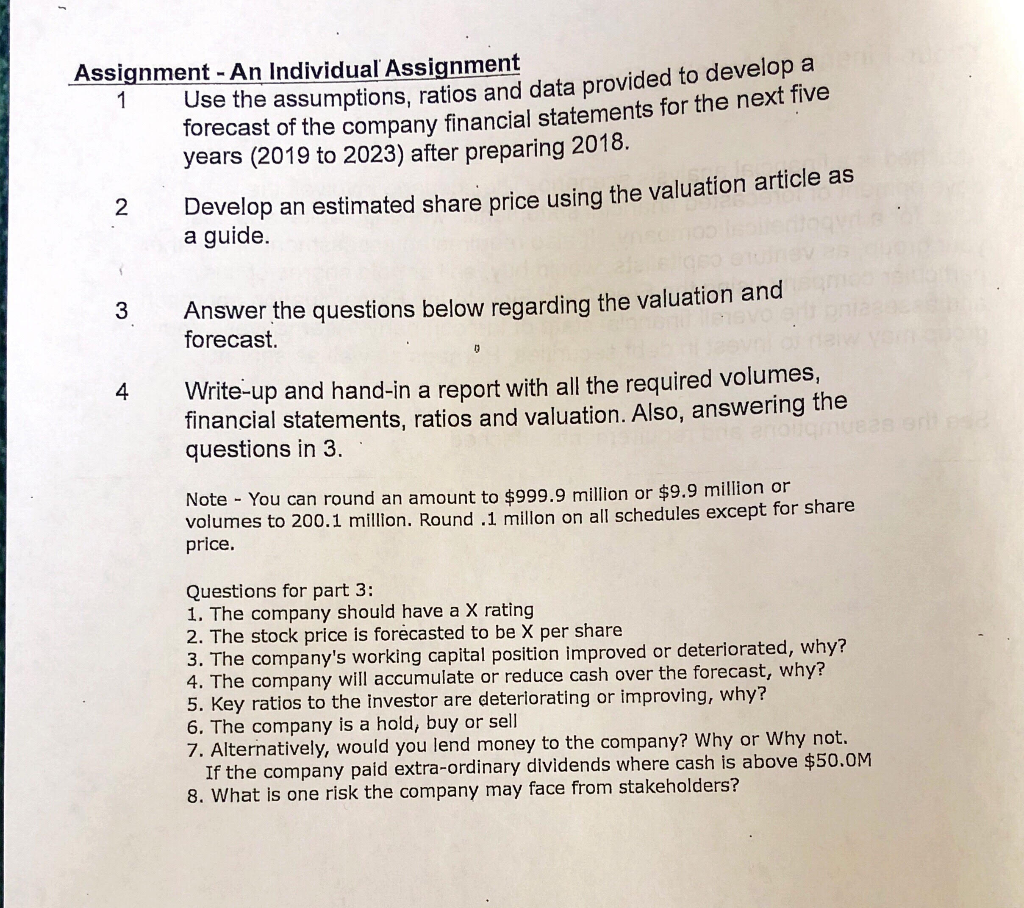
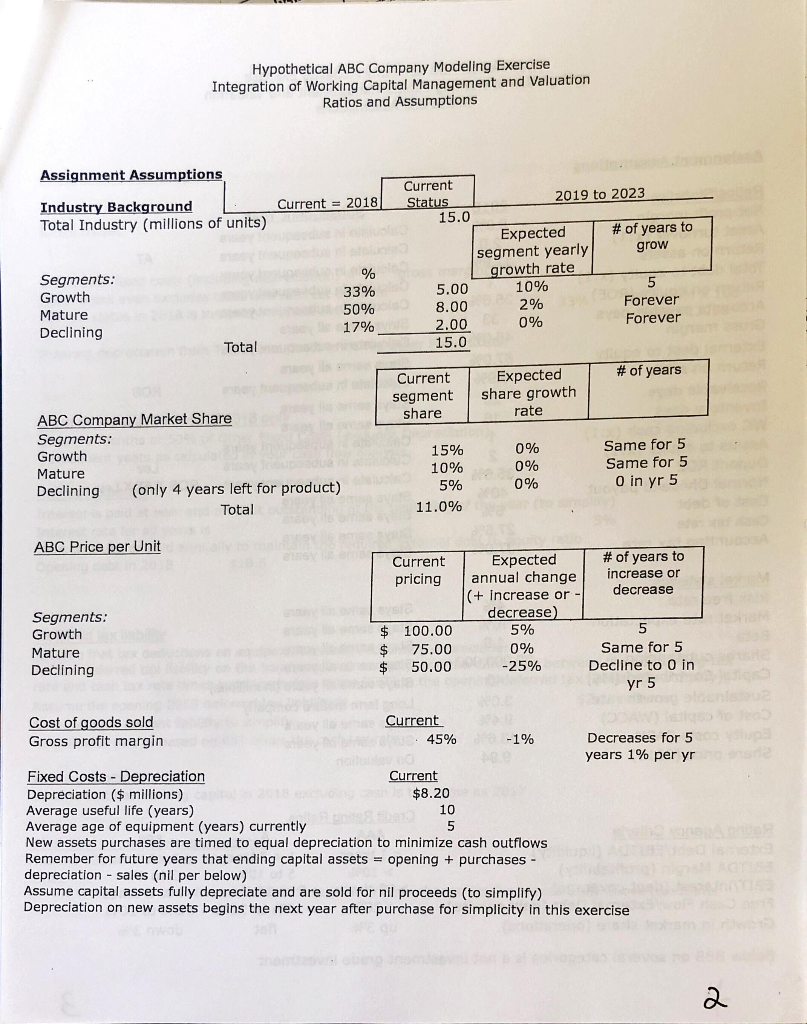
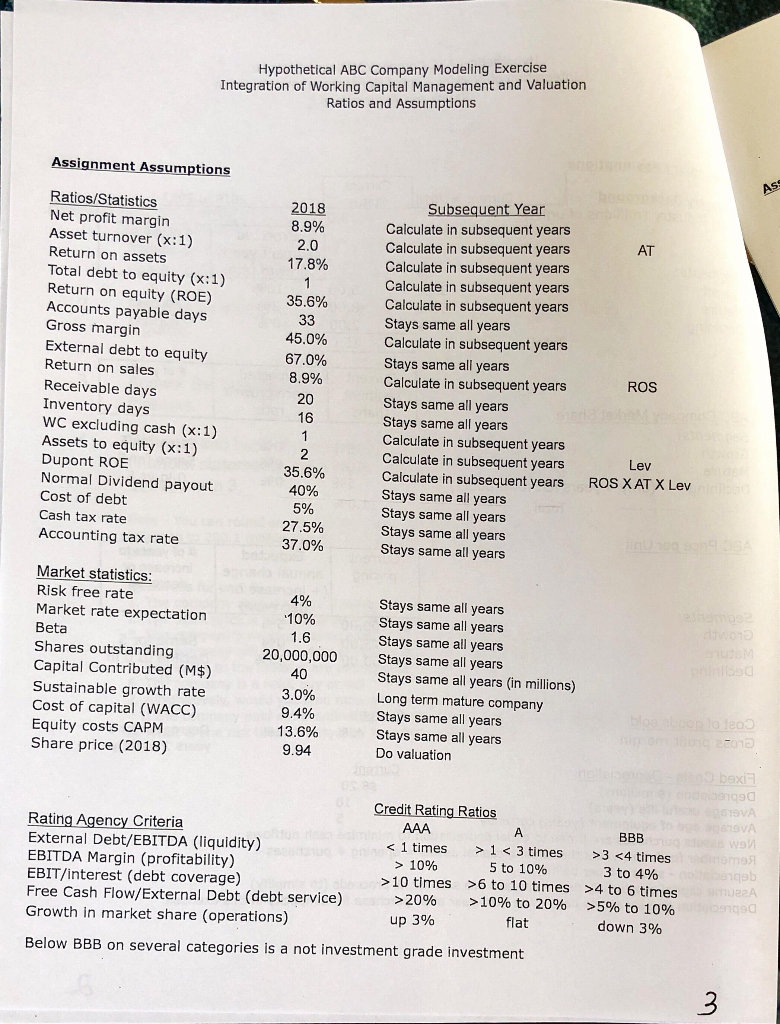
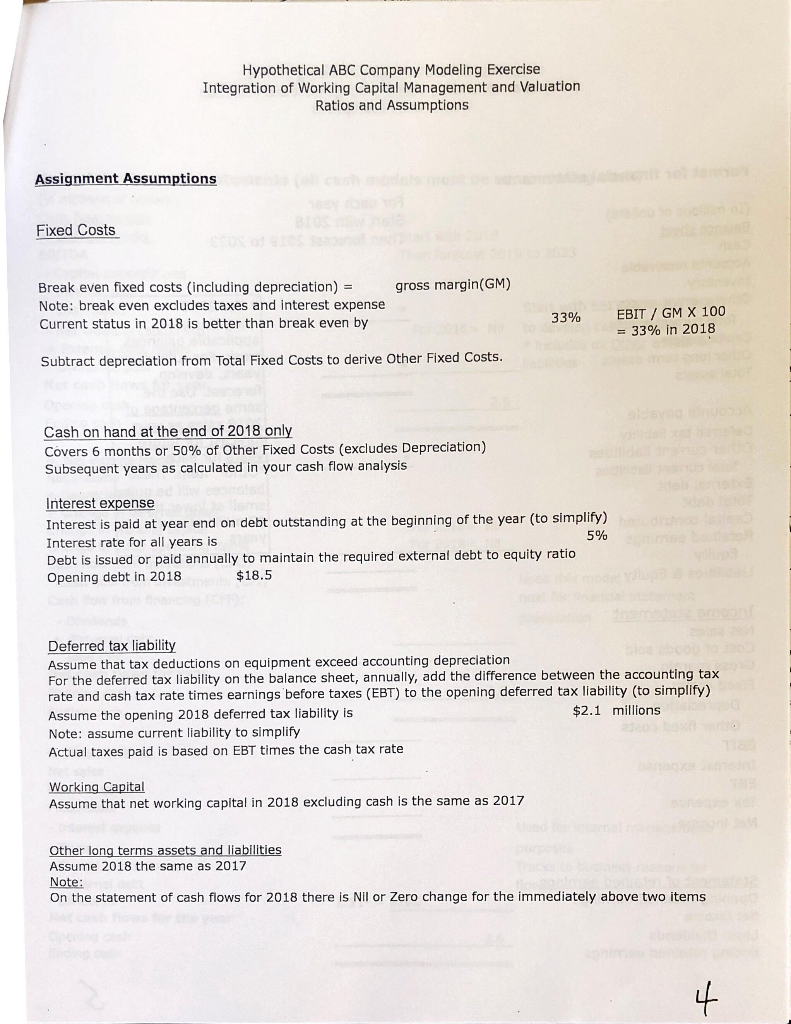
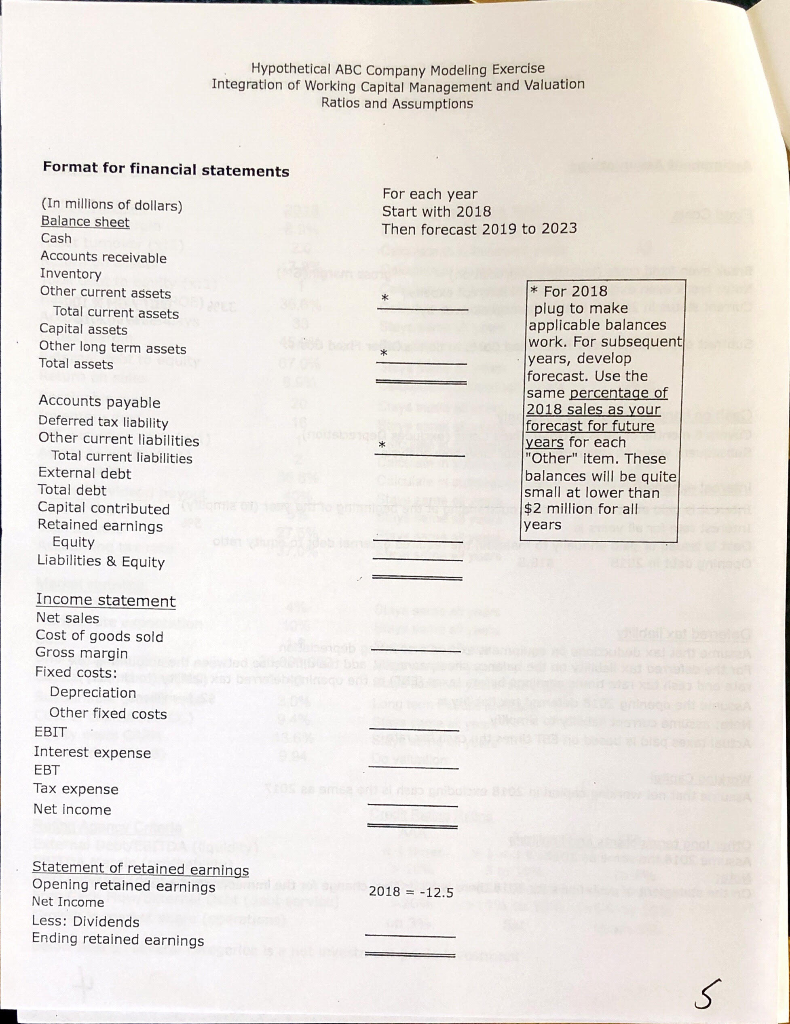
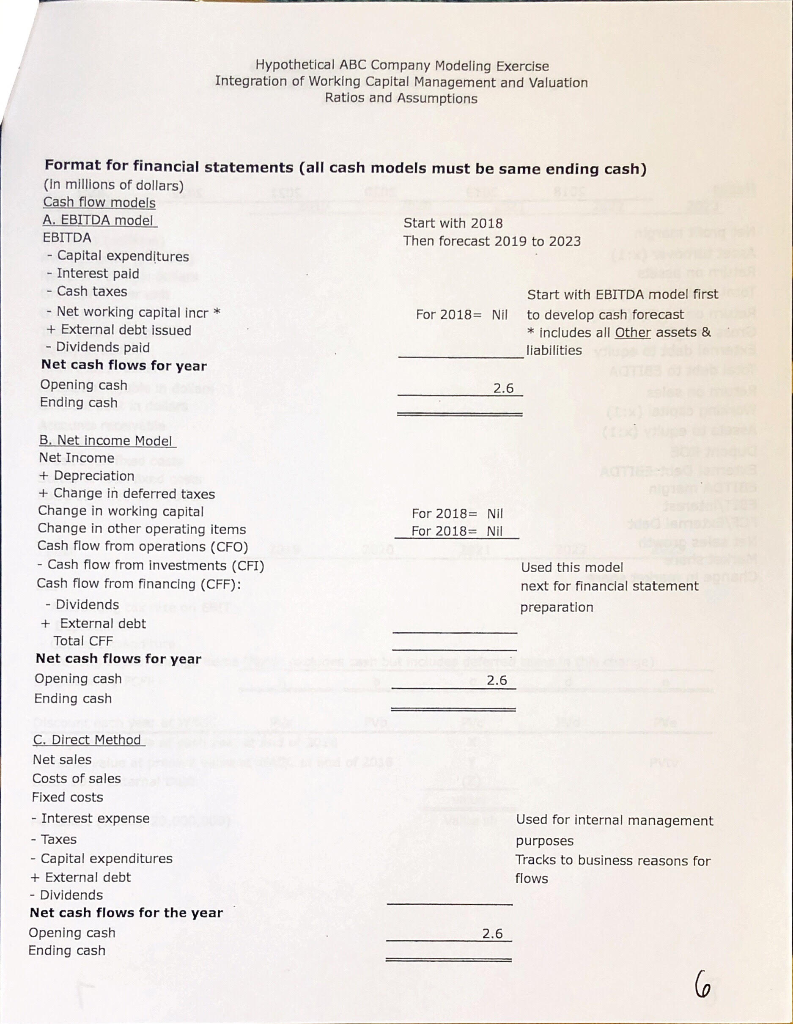
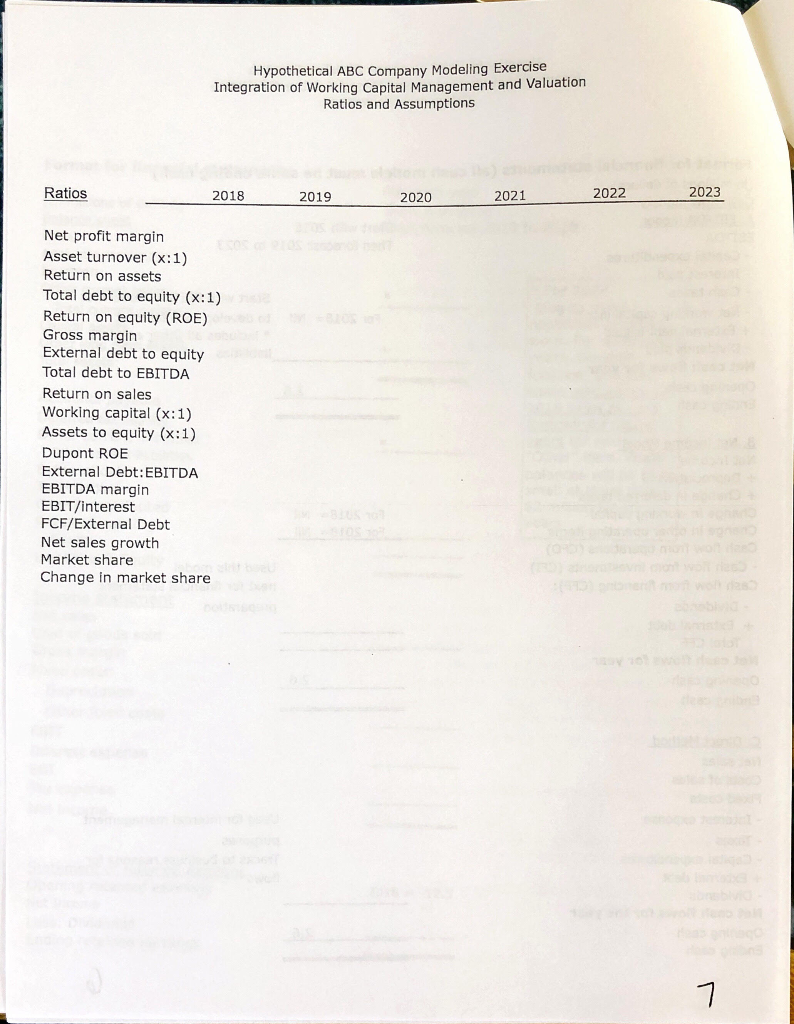
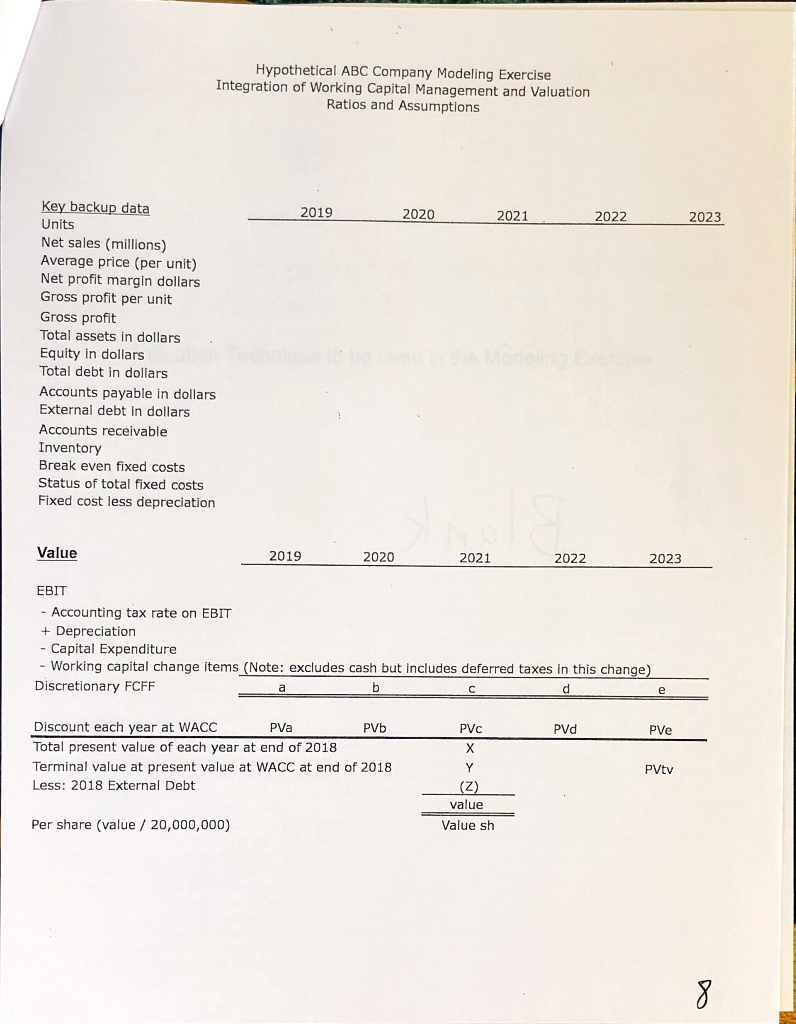
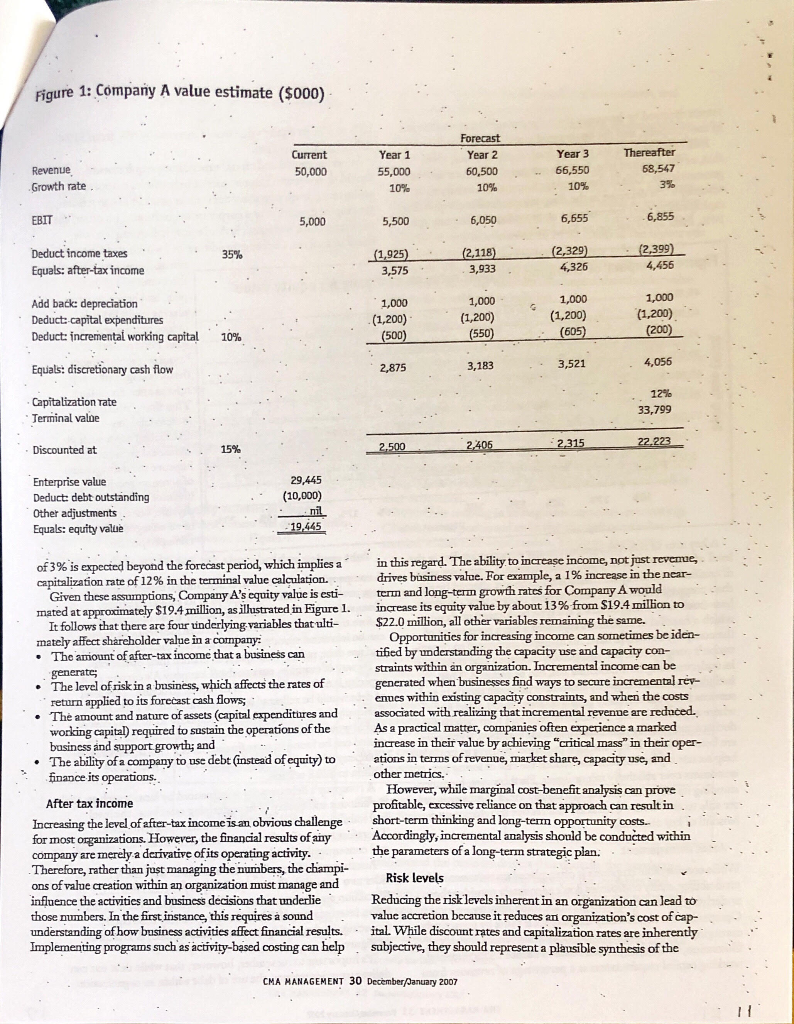
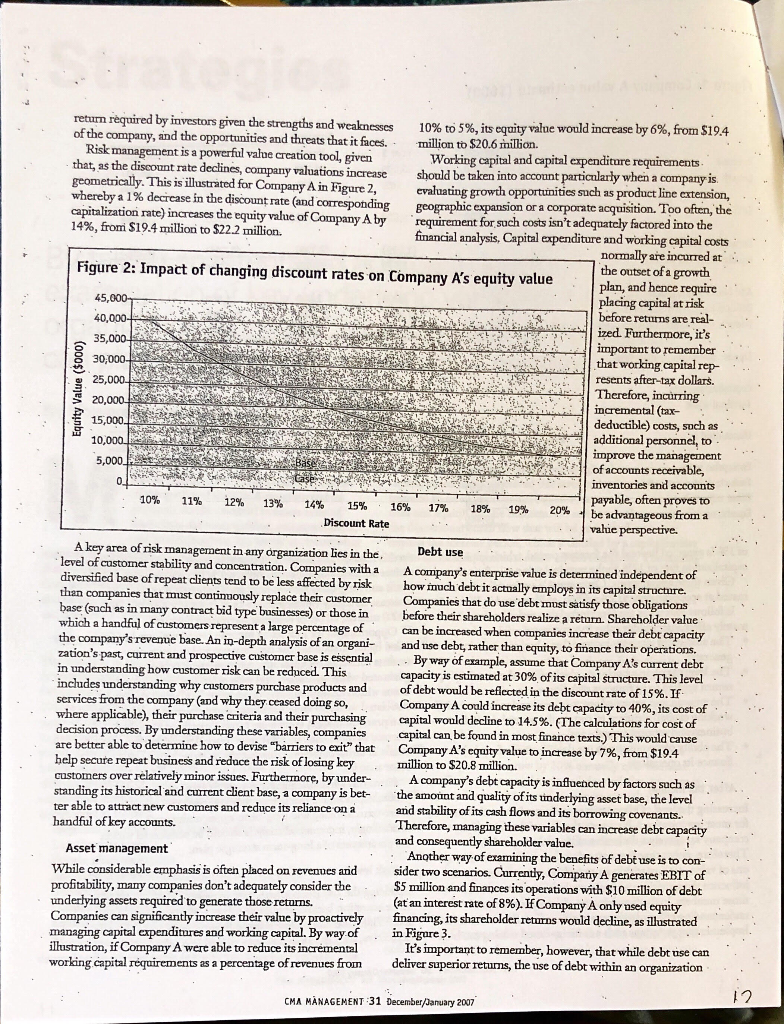
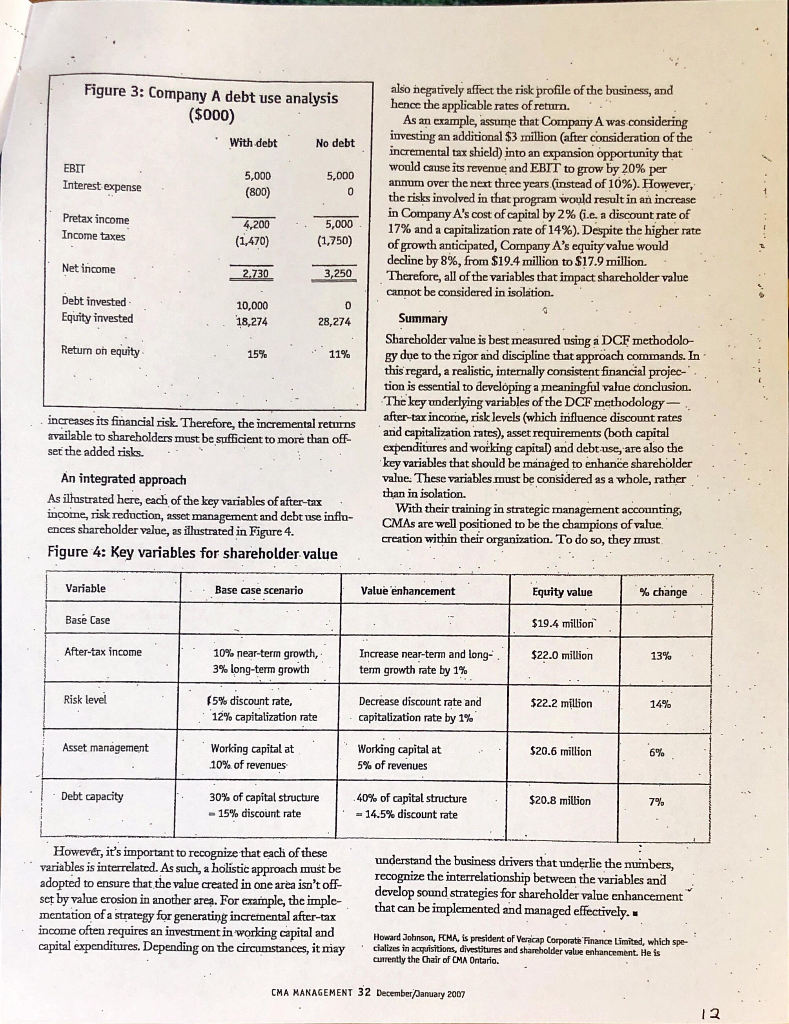

Assignment - An Individual Assignment Use the assumptions, ratios and data provided to develop a forecast of the company financial statements for the next five 1 years (2019 to 2023) after preparing 2018. a guide. Answer the questions below regarding the valuation and 2Develop an estimated share price using the valuation article as 3 forecast. 4 Write-up and hand-in a report with all the required volumes, financial statements, ratios and valuation. Also, answering the questions in 3. Note You can round an amount to $999.9 million or $9.9 million or volumes to 200.1 millon. Round .1 millon on all schedules except for share price. Questions for part 3: 1. The company should have a X rating 2. The stock price is forecasted to be X per share 3. Th 4. The company will accumulate or reduce cash over the forecast, why? 5. Key ratios to the investor are deteriorating or improving, why? 6. The company is a hold, buy or sell 7. Alternatively, would you lend money to the company? Why or Why not e company's working capital position improved or deteriorated, why? If the company paid extra-ordinary dividends where cash is above $50.0M 8. What is one risk the company may face from stakeholders? Hypothetical ABC Company Modeling Exercise Integration of Working Capital Management and Valuation Ratios and Assumptions Assignment Assumptions Current 2019 to 2023 Current2018 Status Industry Background Total Industry (millions of units) 15.0 # of years to Expected segment yearly growth rate 10% 2% Segments Growth Mature Declining 5.00 8.00 33% 50% 1796 2.00 096 Forever Forever Total 15.0 CurrentExpected segment share growth # of years share rate ABC Company Market Share Segments Growth Mature Declining Conly 4 years left for product) 15% 10% 5% 11.0% 0% 0% 096 Same for 5 Same for 5 0 in yr 5 Total ABC Price per Unit Expected | pricing annual change increase or Current # of years to (+ increase or -decrease Segments: Growth Mature Declining $ 100.00 $75.00 $50.00 decrease 5% 0% -25% Same for 5 Decline too in Current Cost of goods sold Gross profit margin Decreases for 5 years 1% per yr 45% Fixed Costs -Depreciation Depreciation ($ millions) Average useful life (years) Average age of equipment (years) currently New assets purchases are timed to equal depreciation to minimize cash outflows Remember for future years that ending capital assetsopening + purchases - depreciation sales (nil per below) Assume capital assets fully depreciate and are sold for nil proceeds (to simplify) Depreciation on new assets begins the next year after purchase for simplicity in this exercise Current $8.20 10 5 a. Hypothetical ABC Company Modeling Exercise Integration of Working Capital Management and Valuation Ratios and Assumptions Assignment Assumptions Ratios/Statistics Net profit margin Asset turnover (x:1) Return on assets Total debt to equity (x:1) Return on equity (ROE) Accounts payable days Gross margin External debt to equity Return on sales Receivable days Inventory days WC excluding cash (x:1) Assets to equity (x:1) Dupont ROE Normal Dividend payout Cost of debt Cash tax rate Accounting tax rate 2018 Calculate in subsequent years Calculate in subsequent years Calculate in subsequent years Calculate in subsequent years Calculate in subsequent years Stays same all years Calculate in subsequent years Stays same all years Calculate in subsequent years Stays same all years Stays same all years Calculate in subsequent years Calculate in subsequent years Calculate in subsequent years Stays same all years Stays same all years Stays same all years Stays same all years AT 17.8% 35.6% 450% 670% ROS 20 35.6% ROS XAT X Lev 275% 370% Market statistics Risk free rate Market rate expectation 4% Shares outstanding Capital Contributed (M$) Sustainable growth rate Cost of capital (WACC) Equity costs CAPM Share price (2018) 20,000,000 30% 13.6% Stays same all years Stays same all years Stays same all years Stays same all years Stays same all years (in millions) Long term mature company Stays same all years Stays same all years Do valuation Credit Rating Ratios Rating Agency Criteria External Debt/EBITDA (liquidity) EBITDA Margin (profitability) EBIT/interest (debt coverage) Free Cash Flow/External Debt (debt service) Growth in market share (operations) 3 10 times >6 to 10 times >4 to 6 times 93 gb > 10% 3to4% > 20% > 10% to 20% >5% to 10% Below BBB on several categories is a not investment grade investment Hypothetical ABC Company Modeling Exercise Integration of Working Capital Management and Valuation Ratios and Assumptions Assignment Assumptions Fixed Costs Break even fixed costs (including depreciation)gross margin(GM) Note: break even excludes taxes and interest expense Current status in 2018 is better than break even by EBIT / GM X 100 33% in 2018 3396 Subtract depreciation from Total Fixed Costs to derive Other Fixed Costs. Cash on hand at the end of 2018 only Covers 6 months or 50% of Other Fixed Costs (excludes Depreciation) Subsequent years as calculated in your cash flow analysis Interest expense Interest is paid at year end on debt outstanding at the beginning of the year (to simplify) Interest rate for all years is Debt is issued or paid annually to maintain the required external debt to equity ratio Opening debt in 2018 $18.5 5% Deferred tax liability Assume that tax deductions on equipment exceed accounting depreciation For the deferred tax liability on the balance sheet, annually, add the difference between the accounting tax rate and cash tax rate times earnings before taxes (EBT) to the opening deferred tax liability (to simplify) Assume the opening 2018 deferred tax liability is Note: assume current liability to simplify Actual taxes paid is based on EBT times the cash tax rate $2.1 millions Assume that net working capital in 2018 excluding cash is the same as 2017 ther long terms Assume 2018 the same as 2017 Note: On the statement of cash flows for 2018 there is Nil or Zero change for the immediately above two items Hypothetical ABC Company Modeling Exercise Integration of Working Capital Management and Valuation Ratios and Assumptions Format for financial statements For each year Start with 2018 Then forecast 2019 to 2023 (In millions of dollars) Balance sheet Cash Accounts receivable Inventory Other current assets For 2018 Total current assets Capital assets Other long term assets Total assets plug to make applicable balances work. For subsequent years, develop forecast. Use the xk e percentage of Accounts payable Deferred tax liability Other current liabilities Total current liabilities External debt Total debt Capital contributed Retained earnings 2018 sales as your forecast for future years for each "Other" item. These balances will be quite small at lower than $2 million for all years Equity Liabilities & Equity Income statement Net sales Cost of goods sold Gross margin Fixed costs: Depreciation Other fixed costs EBIT Interest expense EBT Tax expense Net income Statement of retained earnings Opening retained earnings Net Income 2018-12.5 Less: Dividends Ending retained earnings Hypothetical ABC Company Modeling Exercise Integration of Working Capital Management and Valuation Ratios and Assumptions Format for financial statements (all cash models must be same ending cash) (in millions of dollars) A. EBITDA model EBITDA - Capital expenditures - Interest paid - Cash taxes Start with 2018 Then forecast 2019 to 2023 Start with EBITDA model first Net working capital incr* For 2018-Nil to develop cash forecast External debt issued * includes all Other assets & liabilities - Dividends paid Net cash flows for year Opening cash Ending cash 2.6 B. Net income Model Net Income +Depreciation +Change in deferred taxes Change in working capital Change in other operating items Cash flow from operations (CFO) For 2018= Nil For 2018 Nil Cash flow from investments (CFI) Cash flow from financing (CFF): Used this model next for financlal statement preparation - Dividends + External debt Total CFF Net cash flows for year Opening cash Ending cash 2.6 C. Direct Method Net sales Costs of sales Fixed costs Interest expense - Taxes - Capital expenditures +External debt - Dividends Net cash flows for the year Opening cash Ending cash Used for internal management purposes Tracks to business reasons for flows 2.6 Hypothetical ABC Company Modeling Exercise Integration of Working Capital Management and Valuation Ratios and Assumptions Ratios 2018 2019 2020 2021 2022 2023 Net profit margin Asset turnover (x:1) Return on assets Total debt to equity (x:1) Return on equity (ROE) Gross margin External debt to equity Total debt to EBITDA Return on sales Working capital (x: 1) Assets to equity (x:1) Dupont ROE External Debt:EBITDA EBITDA margin EBIT/interest FCF/External Debt Net sales growth Market share Change in market share Hypothetical ABC Company Modeling Exercise Integration of Working Capital Management and Valuation Ratios and Assumptions Key backup data Units Net sales (millions) Average price (per unit) Net profit margin dollars Gross profit per unit Gross profit Total assets in dollars Equity in dollars Total debt in dollars Accounts payable in dollars External debt in dollars Accounts receivable Inventory Break even fixed costs Status of total fixed costs Fixed cost less depreciation 2019 2020 2021 2022 2023 Value 2019 2020 2021 2022 2023 EBIT - Accounting tax rate on EBIT Depreciation Capital Expenditure Working capital change items (Note: excludes cash but includes deferred taxes in this change) Discretionary FCFF Discount each year at WACC Total present value of each year at end of 2018 Terminal value at present value at WACC at end of 2018 Less: 2018 External Debt PVa PVb PVd PVe PVtv value Per share (value 20,000,000) Value sh Strategies value examination of key underlying variables that affect organizational growth, management accountants can play an important role in value creation By Howard Johnson, CMA, FCMA anagemient accomtants are wellsuited for the discount ratc reflects the compariy's weighted average cost of role of champions of valae creation, becanse capital, based on its perceived risk level and using whatis of the quality of the CMA program and its emphasis on the essential business sklls of leadership, decision making, commumication, the discretionary cash flow that will be generated each year and professionalism. It's usefal to review what beyond the forecast period, which is divided by a capitalization believed to be an appropriate capital structure G.e. the mix of debt and equity) for the business. An estimate is then made of supports that function, however-the key underlying variables rat to the terminal valuie" of the company. The capita ion, whether public or private, large or small. Using an inte fow at that forecasted level over the long term, net of the com- that ultimately impact shareholder value within an organiza- ization rate reflects the risks of maintaining discretionary cash ted approach to these vanables the management accountant can effectively support shareholder valpe enhancement. par y's expected long-term growth rate The terminal vaes discounted to its present value using the discount rate. The present vaue of the forecast cash flows plus the present value of the terminal value generates the enterprise value" of Value measurement The first tep in the quest for enhancing shareholder valbe lies in understanding how it is measured. The prferred approach for measuring shareholder vane is the discounted cash flow (DCF) methodology. Using tie DCF method, a forecast is the company -the total valne of the debt and eguity. Interest bearing debt and equivalent iabilities are deducted to determine the equity value of the business. Further adjustments may be necessary when there are excess or made of the discretionary cash low that a business is expected deficient asets in the business. several years (generally three to seven As aneampl, assuime that Company A generates ERIT of S5 milion on revenmes of $50 million, and that both of these amounts are expected to grow by 10% annually over the next years). Discretionary cash flowrepresen readily withdrawn by the providers of capital in a basiness without impairing ongoing operations or growth prospects. In a somewhat simplified form, discretionary cash flow can be determined as follows ts the cash that can be three years. Further assume that annual depreciation expense is S1 milion, but that to achieve and sustain its growth plans, Company A requires annual capital expenditures of S12 mil- lion. Also assume that Company A's working capital require, ments are 10% of revenues, and that its subject to a tax rate of 35%. Finally, assume that Company Ahas S10 million of inter- est bearing debt ontstanding (at an 8% interest rate), butthat no other asset or liability adjustments are necessary. Projected earnings before intertst and uxes (EBTT) Less: iscome taxes Equals: after-tax income Add back: depreciation and amortization expense Deduct capital expenditure requirements Deduct: incremental working capital requirements Equals: discretionary cash flow (before financing costs). Forrates of renn, assume that a weighted average cost of capital discount rate of 15% is considered appropriate, giver thenaure of Cotmpany A's business and the risks umderlying its cash flow projections. Assume also that a long tem growth rate Discretionary cash low is discounted by a discount rate to determine the present value of the future cash flow stream. The CMA MANAGEMENT 29 Decemberanuary 2007 l 0 Figure 1: Company A value estimate ($000) Current Year 1 Year 2 Thereafter Revenue 66,550 Growth rate 10% EBIT 5,000 5,500 (2,399) Deduct income taxes Equals: after-tax income (2.118) 3,933 (1,925) 4,326 Add bak: depreciation Deduct-capital expenditures Deduct: incremental working capital (1,200) (1,200) 10% 2,875 3,183 4,056 Equals: discretionary cash flow Capitalization rate Terminal valoe 33,799 29,445 (10,000) Enterprise value Deduct: debt outstanding Other adjustments Equals: equity valie 9.445 of3% s expected beyond the forecast period which mplies a capitalization rate of 12% in the terminal value calculation. mtusregard. The ability to increase income, notj stres ere, drives business value. For example, a 1% increase in the near- Given these assumptions, Company A's equity value is esm and long-term growth rates for Company A would mated at approximate y $19.4 million, asilustrated in Figure l increase its e r tyvalue by about 13% from SI Anlmto It follows that there are four inderlying variables that uli-$22.0 million, all other variables remaining the same. Opportunities for increasing income can sometimes be iden- mately affect sharcholder value in a company The amount ofatter-tax income that a business can tified by understanding the capacity use and capacity con- tion. Incremental income can be The level of risk in a business, which affects the rates of return applied to its forecast cash flows generated when businesses find ways to secure incremental rev- enues within existing capacity constraints, and when the costs The amount and nature of assets (capital expenditures and associated with realizing that incremental revenne are reduced., working capital) required to sustain the operations of the As a practical matter, companies often experience a marked business and support growth; and increase in their value by achieving "critical mass" in their oper- The ability of a company to use debt (instead of equity) to ations in terms of revenue, market share, capacity use, and other metrics. However, while marginal cost-benefit analysis can prove profitable, excessive reliance on that approach can result in After tax income Increasing the level of after-ax income is an obvious challengeshort-term thinking and lon-terrm opportunity costs. for most organizations. However, the financial results of any Accordingly, incremental analysis should be conducted within company are merely a deivative of its operating activity. Therefore, rather than just managing the numbers, the champi ons of value creation within an organization rmist manage and influence the activities and business decisions that underlie those numbers. In the first instance, this requires a sound understanding of how business activities affect financial results. ital. While discount rates and capitalization rates are inherently the parameters of a long-term strategic plan Reducing the risk levels inherent in an organization can lead to value accretion bccause it reduces an organization's cost of cap- Implementing programs such as acivity-based costing can help subjective, they should represent a plausible synthesis of the CMA MANAGEMENT 30 December/Canuary 2007 return required by of the company, and the opportunities and threats that it faces. investors gren the strengths and weaknesses 10% to 5%, its equity value would increase by 6%, from $19.4 million to $20.6 million. Risk management is a powerful value creation tool, given that, as the discount rate declines, company valuations increase should be taken into account particnlarly when a compan geometrically. This is illustrated for Company A in Figure 2, evaluating growth opportunities such as p whereby a 1% decrease in the discount rate (and corresponding geographic expansion capitalization rate) increases the equity value of Company A by reqirement for such costs isn't adequa 14% from $19.4 million to $22.2 million. Working capital and capital expenditure requirements s. or a corporate acquisition. Too often, the financial analysis, Capital expenditure and working capital costs Figure 2: Impact of changing discount rates on Company A's equity value the outset of a growth plan, and hence require placing capital at risk 45, 40, ized. Furthermore, it's t to that working capital rep- 30 25,0 resents after-tax dollars. 1n 15,000 deductible) costs, such as additional personnel, to improve the management 5,00 inventories and accounts , , , 10% 11%-12% 13% 14% 15% payable, often proves to 16% 17% 18% 20%%eadvantageous from a 19% value A key area of risk management in any organization lies in the use level of cnstomer stability and concentration. Companies with a A company's enterprise value is than companies that must continuously replace their customer Companies that do use debt mnst which a handful of customers represent a large percentage of diversified base of repeat clients tend to be less affected by risk how uch debt it actnally employs in its capital structure. is determined independent of as in many contract bid type businesses) or those in before their shareholders realize a return. Shareholder value can be increased when companies increase their debt capacity company's revenue base. An in-depth analysis ofan organi- and nse debt, ratherthan euity, to in understanding how customer risk can be reduced. This services from the company (and why they ceased doing so, zation's past, current and prospective customer base is essential understanding why customers purchase products and ere applicable), their purchase c teria and ter purchasmg By way of example, assume that Company A's current debt ty is estimated at 30% of its capital structure. This level ofdebt would be reflected in the discount rate of 15%.If Company A could increase its debt capacity to 40%, its cost of capital would decline to 14.5% (The calculations for cost of decision process. By understanding these variables, companics capital can be found in most finaince texts) This would cause to determine how to devise"bamers to eat that Company A's equity value to increase by 7%, from $19.4 t business and reduce the risk of losing key million to $20.8 million customers over relatively minor issues Furthemore, by under-. A company's debe capacity is standing its historical and current client base, a company is bet the amount and quality ofits ter able to attract new customers and reduce its reliance on a handful of key accounts. influenced by factors such as underlying asset anid stability of its cash flows and its borrowing covenants. Therefore, managing these variables can increase debt capacity and consequently shareholder value Asset management Another way of examining the benefits of debe use is to con- While considerable emphasis is often placed on revenues anidsider two scenarios. Currently, Company A generates EBIT of profitability, many companies don't adequately consider the underlying assets required to generate those returns. Companies can significanty increase their valne by proactively managing capital expenditures and working capital. By way of illustration, if Company A were able to reduce its incremental working capital requirements as a percentage of revenues from S5 million and finances its operations with $10 million of debt (at an interest rate of 8%). IfCompanyA only used equity financing, its shareholder returns would decline, as illustrated in Figure3 Its important to remember, however, that while debt use can deliver superior returns, the use of debt within an organiza on CMA MANAGEMENT 31 December/January 200 Figure 3: Company A debt use analysis ($000) also hegatively affect the risk profile of the business, and hence the applicable rates of return. As an example, assume that Company A was considering investing an additional $3 million (after consideration of the incremental tax shield) into an expansion opportunity that would cause its revenue and EBIT to grow by 20% per annum over the next three years (instead of 10%). However, the risks involved in that program would result in an increase in Company A's cost ofcapital by 2% (ie. a discount rate of 17% and a capitalization rate of 14%). Despite the higher rate With debt No debt EBIT Interest expense 5,000 (800) 5,000 Pretax income Income taxes 4,200 (1,470) 5,000 1 (1750) of growth anticipated, Company A's equity value wold 3,250Therefore, all of the variables that impact shareholder value decline by 8%, from $19.4 million to $17.9 million. Net income 2.730 cannot be considered in isolation. Debt invested Equity invested 10,000 18,274 28,274 Summary Shareholder value is best measured using a DCF methodolo- gy due to the rigor and discipline that approach commands. In this regard, a realistic, internally consistent financial projec- tion is essential to develping a meaningful value conclusion. The key underlying variables of the DCF methodology after-tax income, risk levels (which influence discount rates and capitalization rates), asset requirements (both capital expenditures and working capital) anid debt use, are also the key variables that should be managed to enhance shareholder valne. These variables must be considered as a whole, rather than in isolation. Retum oh equity 11% | 15% increases its financial risk Therefore, the incremental returns available to shareholders must be sufficient to more than of set the added risks. f. An integrated approach As ilhustrated here, each of the key variables of after-tax income, risk reduction, asset management ences shareholder value, as illustrated in Figure 4 With their training in strategic management a and debt use influ- CMAs re well positioned to be the champions of value. creation within their organization. To do so, they nmst Figure 4: Key variables for shareholder value Variable Base case scenario Value enhancement Equity value $19.4 million $22.0 million % change Base Case After-tax income 10% near-term growth, 3% long-term growth increase near-term and long- 13% term growth rate by 1% Decrease discount rate and capitalization rate by 1% Working capital at Risk 15% discount rate, 12% capitalization rate $22.2 million 14% Asset management Working capital at 10% of revenues $20.6 million 6% 5% of revenues Debt capacity 30% of capital structure -15% discount rate 40% of capital structure $20.8 milion 7% -14.5% discount rate Howevr, it's important t to recognize that each of these variables is intarelated. As such, a holistie approach must be rcognze the interelationship between the variables and understand the business drivers that undle the uimbers, recognize the interrelationship between the variables and to ensure that the value created in one area isn't off- lop sound strategiesor shareholder value enhancement ia another areq, For eample the imple- that cabe impemented and managed ffectively.. mentation of a strategy for generating incremental aftcr-tax income often requis nestment in working capital adad Jahsntof and ward Johnson, FCMA, is pmsident of Vericap Corporate Finance Limited, which spe cutrently the Chair of CMA Ontario. capital expenditures. Depending on the circumstances, it miacialiaes in res andshhor value enhancement. He is CMA MANAGEMENT 32 Decemberpanuary 2007 Assignment - An Individual Assignment Use the assumptions, ratios and data provided to develop a forecast of the company financial statements for the next five 1 years (2019 to 2023) after preparing 2018. a guide. Answer the questions below regarding the valuation and 2Develop an estimated share price using the valuation article as 3 forecast. 4 Write-up and hand-in a report with all the required volumes, financial statements, ratios and valuation. Also, answering the questions in 3. Note You can round an amount to $999.9 million or $9.9 million or volumes to 200.1 millon. Round .1 millon on all schedules except for share price. Questions for part 3: 1. The company should have a X rating 2. The stock price is forecasted to be X per share 3. Th 4. The company will accumulate or reduce cash over the forecast, why? 5. Key ratios to the investor are deteriorating or improving, why? 6. The company is a hold, buy or sell 7. Alternatively, would you lend money to the company? Why or Why not e company's working capital position improved or deteriorated, why? If the company paid extra-ordinary dividends where cash is above $50.0M 8. What is one risk the company may face from stakeholders? Assignment - An Individual Assignment Use the assumptions, ratios and data provided to develop a forecast of the company financial statements for the next five 1 years (2019 to 2023) after preparing 2018. a guide. Answer the questions below regarding the valuation and 2Develop an estimated share price using the valuation article as 3 forecast. 4 Write-up and hand-in a report with all the required volumes, financial statements, ratios and valuation. Also, answering the questions in 3. Note You can round an amount to $999.9 million or $9.9 million or volumes to 200.1 millon. Round .1 millon on all schedules except for share price. Questions for part 3: 1. The company should have a X rating 2. The stock price is forecasted to be X per share 3. Th 4. The company will accumulate or reduce cash over the forecast, why? 5. Key ratios to the investor are deteriorating or improving, why? 6. The company is a hold, buy or sell 7. Alternatively, would you lend money to the company? Why or Why not e company's working capital position improved or deteriorated, why? If the company paid extra-ordinary dividends where cash is above $50.0M 8. What is one risk the company may face from stakeholders? Hypothetical ABC Company Modeling Exercise Integration of Working Capital Management and Valuation Ratios and Assumptions Assignment Assumptions Current 2019 to 2023 Current2018 Status Industry Background Total Industry (millions of units) 15.0 # of years to Expected segment yearly growth rate 10% 2% Segments Growth Mature Declining 5.00 8.00 33% 50% 1796 2.00 096 Forever Forever Total 15.0 CurrentExpected segment share growth # of years share rate ABC Company Market Share Segments Growth Mature Declining Conly 4 years left for product) 15% 10% 5% 11.0% 0% 0% 096 Same for 5 Same for 5 0 in yr 5 Total ABC Price per Unit Expected | pricing annual change increase or Current # of years to (+ increase or -decrease Segments: Growth Mature Declining $ 100.00 $75.00 $50.00 decrease 5% 0% -25% Same for 5 Decline too in Current Cost of goods sold Gross profit margin Decreases for 5 years 1% per yr 45% Fixed Costs -Depreciation Depreciation ($ millions) Average useful life (years) Average age of equipment (years) currently New assets purchases are timed to equal depreciation to minimize cash outflows Remember for future years that ending capital assetsopening + purchases - depreciation sales (nil per below) Assume capital assets fully depreciate and are sold for nil proceeds (to simplify) Depreciation on new assets begins the next year after purchase for simplicity in this exercise Current $8.20 10 5 a. Hypothetical ABC Company Modeling Exercise Integration of Working Capital Management and Valuation Ratios and Assumptions Assignment Assumptions Ratios/Statistics Net profit margin Asset turnover (x:1) Return on assets Total debt to equity (x:1) Return on equity (ROE) Accounts payable days Gross margin External debt to equity Return on sales Receivable days Inventory days WC excluding cash (x:1) Assets to equity (x:1) Dupont ROE Normal Dividend payout Cost of debt Cash tax rate Accounting tax rate 2018 Calculate in subsequent years Calculate in subsequent years Calculate in subsequent years Calculate in subsequent years Calculate in subsequent years Stays same all years Calculate in subsequent years Stays same all years Calculate in subsequent years Stays same all years Stays same all years Calculate in subsequent years Calculate in subsequent years Calculate in subsequent years Stays same all years Stays same all years Stays same all years Stays same all years AT 17.8% 35.6% 450% 670% ROS 20 35.6% ROS XAT X Lev 275% 370% Market statistics Risk free rate Market rate expectation 4% Shares outstanding Capital Contributed (M$) Sustainable growth rate Cost of capital (WACC) Equity costs CAPM Share price (2018) 20,000,000 30% 13.6% Stays same all years Stays same all years Stays same all years Stays same all years Stays same all years (in millions) Long term mature company Stays same all years Stays same all years Do valuation Credit Rating Ratios Rating Agency Criteria External Debt/EBITDA (liquidity) EBITDA Margin (profitability) EBIT/interest (debt coverage) Free Cash Flow/External Debt (debt service) Growth in market share (operations) 3 10 times >6 to 10 times >4 to 6 times 93 gb > 10% 3to4% > 20% > 10% to 20% >5% to 10% Below BBB on several categories is a not investment grade investment Hypothetical ABC Company Modeling Exercise Integration of Working Capital Management and Valuation Ratios and Assumptions Assignment Assumptions Fixed Costs Break even fixed costs (including depreciation)gross margin(GM) Note: break even excludes taxes and interest expense Current status in 2018 is better than break even by EBIT / GM X 100 33% in 2018 3396 Subtract depreciation from Total Fixed Costs to derive Other Fixed Costs. Cash on hand at the end of 2018 only Covers 6 months or 50% of Other Fixed Costs (excludes Depreciation) Subsequent years as calculated in your cash flow analysis Interest expense Interest is paid at year end on debt outstanding at the beginning of the year (to simplify) Interest rate for all years is Debt is issued or paid annually to maintain the required external debt to equity ratio Opening debt in 2018 $18.5 5% Deferred tax liability Assume that tax deductions on equipment exceed accounting depreciation For the deferred tax liability on the balance sheet, annually, add the difference between the accounting tax rate and cash tax rate times earnings before taxes (EBT) to the opening deferred tax liability (to simplify) Assume the opening 2018 deferred tax liability is Note: assume current liability to simplify Actual taxes paid is based on EBT times the cash tax rate $2.1 millions Assume that net working capital in 2018 excluding cash is the same as 2017 ther long terms Assume 2018 the same as 2017 Note: On the statement of cash flows for 2018 there is Nil or Zero change for the immediately above two items Hypothetical ABC Company Modeling Exercise Integration of Working Capital Management and Valuation Ratios and Assumptions Format for financial statements For each year Start with 2018 Then forecast 2019 to 2023 (In millions of dollars) Balance sheet Cash Accounts receivable Inventory Other current assets For 2018 Total current assets Capital assets Other long term assets Total assets plug to make applicable balances work. For subsequent years, develop forecast. Use the xk e percentage of Accounts payable Deferred tax liability Other current liabilities Total current liabilities External debt Total debt Capital contributed Retained earnings 2018 sales as your forecast for future years for each "Other" item. These balances will be quite small at lower than $2 million for all years Equity Liabilities & Equity Income statement Net sales Cost of goods sold Gross margin Fixed costs: Depreciation Other fixed costs EBIT Interest expense EBT Tax expense Net income Statement of retained earnings Opening retained earnings Net Income 2018-12.5 Less: Dividends Ending retained earnings Hypothetical ABC Company Modeling Exercise Integration of Working Capital Management and Valuation Ratios and Assumptions Format for financial statements (all cash models must be same ending cash) (in millions of dollars) A. EBITDA model EBITDA - Capital expenditures - Interest paid - Cash taxes Start with 2018 Then forecast 2019 to 2023 Start with EBITDA model first Net working capital incr* For 2018-Nil to develop cash forecast External debt issued * includes all Other assets & liabilities - Dividends paid Net cash flows for year Opening cash Ending cash 2.6 B. Net income Model Net Income +Depreciation +Change in deferred taxes Change in working capital Change in other operating items Cash flow from operations (CFO) For 2018= Nil For 2018 Nil Cash flow from investments (CFI) Cash flow from financing (CFF): Used this model next for financlal statement preparation - Dividends + External debt Total CFF Net cash flows for year Opening cash Ending cash 2.6 C. Direct Method Net sales Costs of sales Fixed costs Interest expense - Taxes - Capital expenditures +External debt - Dividends Net cash flows for the year Opening cash Ending cash Used for internal management purposes Tracks to business reasons for flows 2.6 Hypothetical ABC Company Modeling Exercise Integration of Working Capital Management and Valuation Ratios and Assumptions Ratios 2018 2019 2020 2021 2022 2023 Net profit margin Asset turnover (x:1) Return on assets Total debt to equity (x:1) Return on equity (ROE) Gross margin External debt to equity Total debt to EBITDA Return on sales Working capital (x: 1) Assets to equity (x:1) Dupont ROE External Debt:EBITDA EBITDA margin EBIT/interest FCF/External Debt Net sales growth Market share Change in market share Hypothetical ABC Company Modeling Exercise Integration of Working Capital Management and Valuation Ratios and Assumptions Key backup data Units Net sales (millions) Average price (per unit) Net profit margin dollars Gross profit per unit Gross profit Total assets in dollars Equity in dollars Total debt in dollars Accounts payable in dollars External debt in dollars Accounts receivable Inventory Break even fixed costs Status of total fixed costs Fixed cost less depreciation 2019 2020 2021 2022 2023 Value 2019 2020 2021 2022 2023 EBIT - Accounting tax rate on EBIT Depreciation Capital Expenditure Working capital change items (Note: excludes cash but includes deferred taxes in this change) Discretionary FCFF Discount each year at WACC Total present value of each year at end of 2018 Terminal value at present value at WACC at end of 2018 Less: 2018 External Debt PVa PVb PVd PVe PVtv value Per share (value 20,000,000) Value sh Strategies value examination of key underlying variables that affect organizational growth, management accountants can play an important role in value creation By Howard Johnson, CMA, FCMA anagemient accomtants are wellsuited for the discount ratc reflects the compariy's weighted average cost of role of champions of valae creation, becanse capital, based on its perceived risk level and using whatis of the quality of the CMA program and its emphasis on the essential business sklls of leadership, decision making, commumication, the discretionary cash flow that will be generated each year and professionalism. It's usefal to review what beyond the forecast period, which is divided by a capitalization believed to be an appropriate capital structure G.e. the mix of debt and equity) for the business. An estimate is then made of supports that function, however-the key underlying variables rat to the terminal valuie" of the company. The capita ion, whether public or private, large or small. Using an inte fow at that forecasted level over the long term, net of the com- that ultimately impact shareholder value within an organiza- ization rate reflects the risks of maintaining discretionary cash ted approach to these vanables the management accountant can effectively support shareholder valpe enhancement. par y's expected long-term growth rate The terminal vaes discounted to its present value using the discount rate. The present vaue of the forecast cash flows plus the present value of the terminal value generates the enterprise value" of Value measurement The first tep in the quest for enhancing shareholder valbe lies in understanding how it is measured. The prferred approach for measuring shareholder vane is the discounted cash flow (DCF) methodology. Using tie DCF method, a forecast is the company -the total valne of the debt and eguity. Interest bearing debt and equivalent iabilities are deducted to determine the equity value of the business. Further adjustments may be necessary when there are excess or made of the discretionary cash low that a business is expected deficient asets in the business. several years (generally three to seven As aneampl, assuime that Company A generates ERIT of S5 milion on revenmes of $50 million, and that both of these amounts are expected to grow by 10% annually over the next years). Discretionary cash flowrepresen readily withdrawn by the providers of capital in a basiness without impairing ongoing operations or growth prospects. In a somewhat simplified form, discretionary cash flow can be determined as follows ts the cash that can be three years. Further assume that annual depreciation expense is S1 milion, but that to achieve and sustain its growth plans, Company A requires annual capital expenditures of S12 mil- lion. Also assume that Company A's working capital require, ments are 10% of revenues, and that its subject to a tax rate of 35%. Finally, assume that Company Ahas S10 million of inter- est bearing debt ontstanding (at an 8% interest rate), butthat no other asset or liability adjustments are necessary. Projected earnings before intertst and uxes (EBTT) Less: iscome taxes Equals: after-tax income Add back: depreciation and amortization expense Deduct capital expenditure requirements Deduct: incremental working capital requirements Equals: discretionary cash flow (before financing costs). Forrates of renn, assume that a weighted average cost of capital discount rate of 15% is considered appropriate, giver thenaure of Cotmpany A's business and the risks umderlying its cash flow projections. Assume also that a long tem growth rate Discretionary cash low is discounted by a discount rate to determine the present value of the future cash flow stream. The CMA MANAGEMENT 29 Decemberanuary 2007 l 0 Figure 1: Company A value estimate ($000) Current Year 1 Year 2 Thereafter Revenue 66,550 Growth rate 10% EBIT 5,000 5,500 (2,399) Deduct income taxes Equals: after-tax income (2.118) 3,933 (1,925) 4,326 Add bak: depreciation Deduct-capital expenditures Deduct: incremental working capital (1,200) (1,200) 10% 2,875 3,183 4,056 Equals: discretionary cash flow Capitalization rate Terminal valoe 33,799 29,445 (10,000) Enterprise value Deduct: debt outstanding Other adjustments Equals: equity valie 9.445 of3% s expected beyond the forecast period which mplies a capitalization rate of 12% in the terminal value calculation. mtusregard. The ability to increase income, notj stres ere, drives business value. For example, a 1% increase in the near- Given these assumptions, Company A's equity value is esm and long-term growth rates for Company A would mated at approximate y $19.4 million, asilustrated in Figure l increase its e r tyvalue by about 13% from SI Anlmto It follows that there are four inderlying variables that uli-$22.0 million, all other variables remaining the same. Opportunities for increasing income can sometimes be iden- mately affect sharcholder value in a company The amount ofatter-tax income that a business can tified by understanding the capacity use and capacity con- tion. Incremental income can be The level of risk in a business, which affects the rates of return applied to its forecast cash flows generated when businesses find ways to secure incremental rev- enues within existing capacity constraints, and when the costs The amount and nature of assets (capital expenditures and associated with realizing that incremental revenne are reduced., working capital) required to sustain the operations of the As a practical matter, companies often experience a marked business and support growth; and increase in their value by achieving "critical mass" in their oper- The ability of a company to use debt (instead of equity) to ations in terms of revenue, market share, capacity use, and other metrics. However, while marginal cost-benefit analysis can prove profitable, excessive reliance on that approach can result in After tax income Increasing the level of after-ax income is an obvious challengeshort-term thinking and lon-terrm opportunity costs. for most organizations. However, the financial results of any Accordingly, incremental analysis should be conducted within company are merely a deivative of its operating activity. Therefore, rather than just managing the numbers, the champi ons of value creation within an organization rmist manage and influence the activities and business decisions that underlie those numbers. In the first instance, this requires a sound understanding of how business activities affect financial results. ital. While discount rates and capitalization rates are inherently the parameters of a long-term strategic plan Reducing the risk levels inherent in an organization can lead to value accretion bccause it reduces an organization's cost of cap- Implementing programs such as acivity-based costing can help subjective, they should represent a plausible synthesis of the CMA MANAGEMENT 30 December/Canuary 2007 return required by of the company, and the opportunities and threats that it faces. investors gren the strengths and weaknesses 10% to 5%, its equity value would increase by 6%, from $19.4 million to $20.6 million. Risk management is a powerful value creation tool, given that, as the discount rate declines, company valuations increase should be taken into account particnlarly when a compan geometrically. This is illustrated for Company A in Figure 2, evaluating growth opportunities such as p whereby a 1% decrease in the discount rate (and corresponding geographic expansion capitalization rate) increases the equity value of Company A by reqirement for such costs isn't adequa 14% from $19.4 million to $22.2 million. Working capital and capital expenditure requirements s. or a corporate acquisition. Too often, the financial analysis, Capital expenditure and working capital costs Figure 2: Impact of changing discount rates on Company A's equity value the outset of a growth plan, and hence require placing capital at risk 45, 40, ized. Furthermore, it's t to that working capital rep- 30 25,0 resents after-tax dollars. 1n 15,000 deductible) costs, such as additional personnel, to improve the management 5,00 inventories and accounts , , , 10% 11%-12% 13% 14% 15% payable, often proves to 16% 17% 18% 20%%eadvantageous from a 19% value A key area of risk management in any organization lies in the use level of cnstomer stability and concentration. Companies with a A company's enterprise value is than companies that must continuously replace their customer Companies that do use debt mnst which a handful of customers represent a large percentage of diversified base of repeat clients tend to be less affected by risk how uch debt it actnally employs in its capital structure. is determined independent of as in many contract bid type businesses) or those in before their shareholders realize a return. Shareholder value can be increased when companies increase their debt capacity company's revenue base. An in-depth analysis ofan organi- and nse debt, ratherthan euity, to in understanding how customer risk can be reduced. This services from the company (and why they ceased doing so, zation's past, current and prospective customer base is essential understanding why customers purchase products and ere applicable), their purchase c teria and ter purchasmg By way of example, assume that Company A's current debt ty is estimated at 30% of its capital structure. This level ofdebt would be reflected in the discount rate of 15%.If Company A could increase its debt capacity to 40%, its cost of capital would decline to 14.5% (The calculations for cost of decision process. By understanding these variables, companics capital can be found in most finaince texts) This would cause to determine how to devise"bamers to eat that Company A's equity value to increase by 7%, from $19.4 t business and reduce the risk of losing key million to $20.8 million customers over relatively minor issues Furthemore, by under-. A company's debe capacity is standing its historical and current client base, a company is bet the amount and quality ofits ter able to attract new customers and reduce its reliance on a handful of key accounts. influenced by factors such as underlying asset anid stability of its cash flows and its borrowing covenants. Therefore, managing these variables can increase debt capacity and consequently shareholder value Asset management Another way of examining the benefits of debe use is to con- While considerable emphasis is often placed on revenues anidsider two scenarios. Currently, Company A generates EBIT of profitability, many companies don't adequately consider the underlying assets required to generate those returns. Companies can significanty increase their valne by proactively managing capital expenditures and working capital. By way of illustration, if Company A were able to reduce its incremental working capital requirements as a percentage of revenues from S5 million and finances its operations with $10 million of debt (at an interest rate of 8%). IfCompanyA only used equity financing, its shareholder returns would decline, as illustrated in Figure3 Its important to remember, however, that while debt use can deliver superior returns, the use of debt within an organiza on CMA MANAGEMENT 31 December/January 200 Figure 3: Company A debt use analysis ($000) also hegatively affect the risk profile of the business, and hence the applicable rates of return. As an example, assume that Company A was considering investing an additional $3 million (after consideration of the incremental tax shield) into an expansion opportunity that would cause its revenue and EBIT to grow by 20% per annum over the next three years (instead of 10%). However, the risks involved in that program would result in an increase in Company A's cost ofcapital by 2% (ie. a discount rate of 17% and a capitalization rate of 14%). Despite the higher rate With debt No debt EBIT Interest expense 5,000 (800) 5,000 Pretax income Income taxes 4,200 (1,470) 5,000 1 (1750) of growth anticipated, Company A's equity value wold 3,250Therefore, all of the variables that impact shareholder value decline by 8%, from $19.4 million to $17.9 million. Net income 2.730 cannot be considered in isolation. Debt invested Equity invested 10,000 18,274 28,274 Summary Shareholder value is best measured using a DCF methodolo- gy due to the rigor and discipline that approach commands. In this regard, a realistic, internally consistent financial projec- tion is essential to develping a meaningful value conclusion. The key underlying variables of the DCF methodology after-tax income, risk levels (which influence discount rates and capitalization rates), asset requirements (both capital expenditures and working capital) anid debt use, are also the key variables that should be managed to enhance shareholder valne. These variables must be considered as a whole, rather than in isolation. Retum oh equity 11% | 15% increases its financial risk Therefore, the incremental returns available to shareholders must be sufficient to more than of set the added risks. f. An integrated approach As ilhustrated here, each of the key variables of after-tax income, risk reduction, asset management ences shareholder value, as illustrated in Figure 4 With their training in strategic management a and debt use influ- CMAs re well positioned to be the champions of value. creation within their organization. To do so, they nmst Figure 4: Key variables for shareholder value Variable Base case scenario Value enhancement Equity value $19.4 million $22.0 million % change Base Case After-tax income 10% near-term growth, 3% long-term growth increase near-term and long- 13% term growth rate by 1% Decrease discount rate and capitalization rate by 1% Working capital at Risk 15% discount rate, 12% capitalization rate $22.2 million 14% Asset management Working capital at 10% of revenues $20.6 million 6% 5% of revenues Debt capacity 30% of capital structure -15% discount rate 40% of capital structure $20.8 milion 7% -14.5% discount rate Howevr, it's important t to recognize that each of these variables is intarelated. As such, a holistie approach must be rcognze the interelationship between the variables and understand the business drivers that undle the uimbers, recognize the interrelationship between the variables and to ensure that the value created in one area isn't off- lop sound strategiesor shareholder value enhancement ia another areq, For eample the imple- that cabe impemented and managed ffectively.. mentation of a strategy for generating incremental aftcr-tax income often requis nestment in working capital adad Jahsntof and ward Johnson, FCMA, is pmsident of Vericap Corporate Finance Limited, which spe cutrently the Chair of CMA Ontario. capital expenditures. Depending on the circumstances, it miacialiaes in res andshhor value enhancement. He is CMA MANAGEMENT 32 Decemberpanuary 2007 Assignment - An Individual Assignment Use the assumptions, ratios and data provided to develop a forecast of the company financial statements for the next five 1 years (2019 to 2023) after preparing 2018. a guide. Answer the questions below regarding the valuation and 2Develop an estimated share price using the valuation article as 3 forecast. 4 Write-up and hand-in a report with all the required volumes, financial statements, ratios and valuation. Also, answering the questions in 3. Note You can round an amount to $999.9 million or $9.9 million or volumes to 200.1 millon. Round .1 millon on all schedules except for share price. Questions for part 3: 1. The company should have a X rating 2. The stock price is forecasted to be X per share 3. Th 4. The company will accumulate or reduce cash over the forecast, why? 5. Key ratios to the investor are deteriorating or improving, why? 6. The company is a hold, buy or sell 7. Alternatively, would you lend money to the company? Why or Why not e company's working capital position improved or deteriorated, why? If the company paid extra-ordinary dividends where cash is above $50.0M 8. What is one risk the company may face from stakeholders
Step by Step Solution
There are 3 Steps involved in it

Get step-by-step solutions from verified subject matter experts