

Answered step by step
Verified Expert Solution
Question
1 Approved Answer
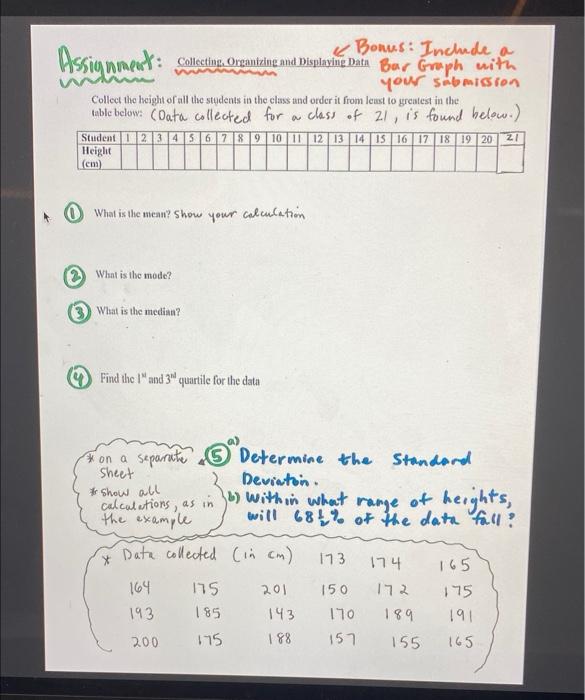
Assignment : & Bonus: Include a Collecting, Organizing and Displaying Data for Graph with your submission Collect the height of all the students in the
Step by Step Solution
There are 3 Steps involved in it
Step: 1

Get Instant Access to Expert-Tailored Solutions
See step-by-step solutions with expert insights and AI powered tools for academic success
Step: 2

Step: 3
Ace Your Homework with AI
Get the answers you need in no time with our AI-driven, step-by-step assistance
Get Started
Exercises In Computational Mathematics With MATLAB
Authors: Tom Lyche, Jean Louis Merrien
1st Edition
366243511X, 9783662435113