

Question
Assignment Exercise 18-2 (p. 564) Three Level Revenue Forecast Create the required table in an Excel document and submit the assignment via the link provided
Assignment Exercise 18-2 (p. 564) Three Level Revenue Forecast
Create the required table in an Excel document and submit the assignment via the link provided below.
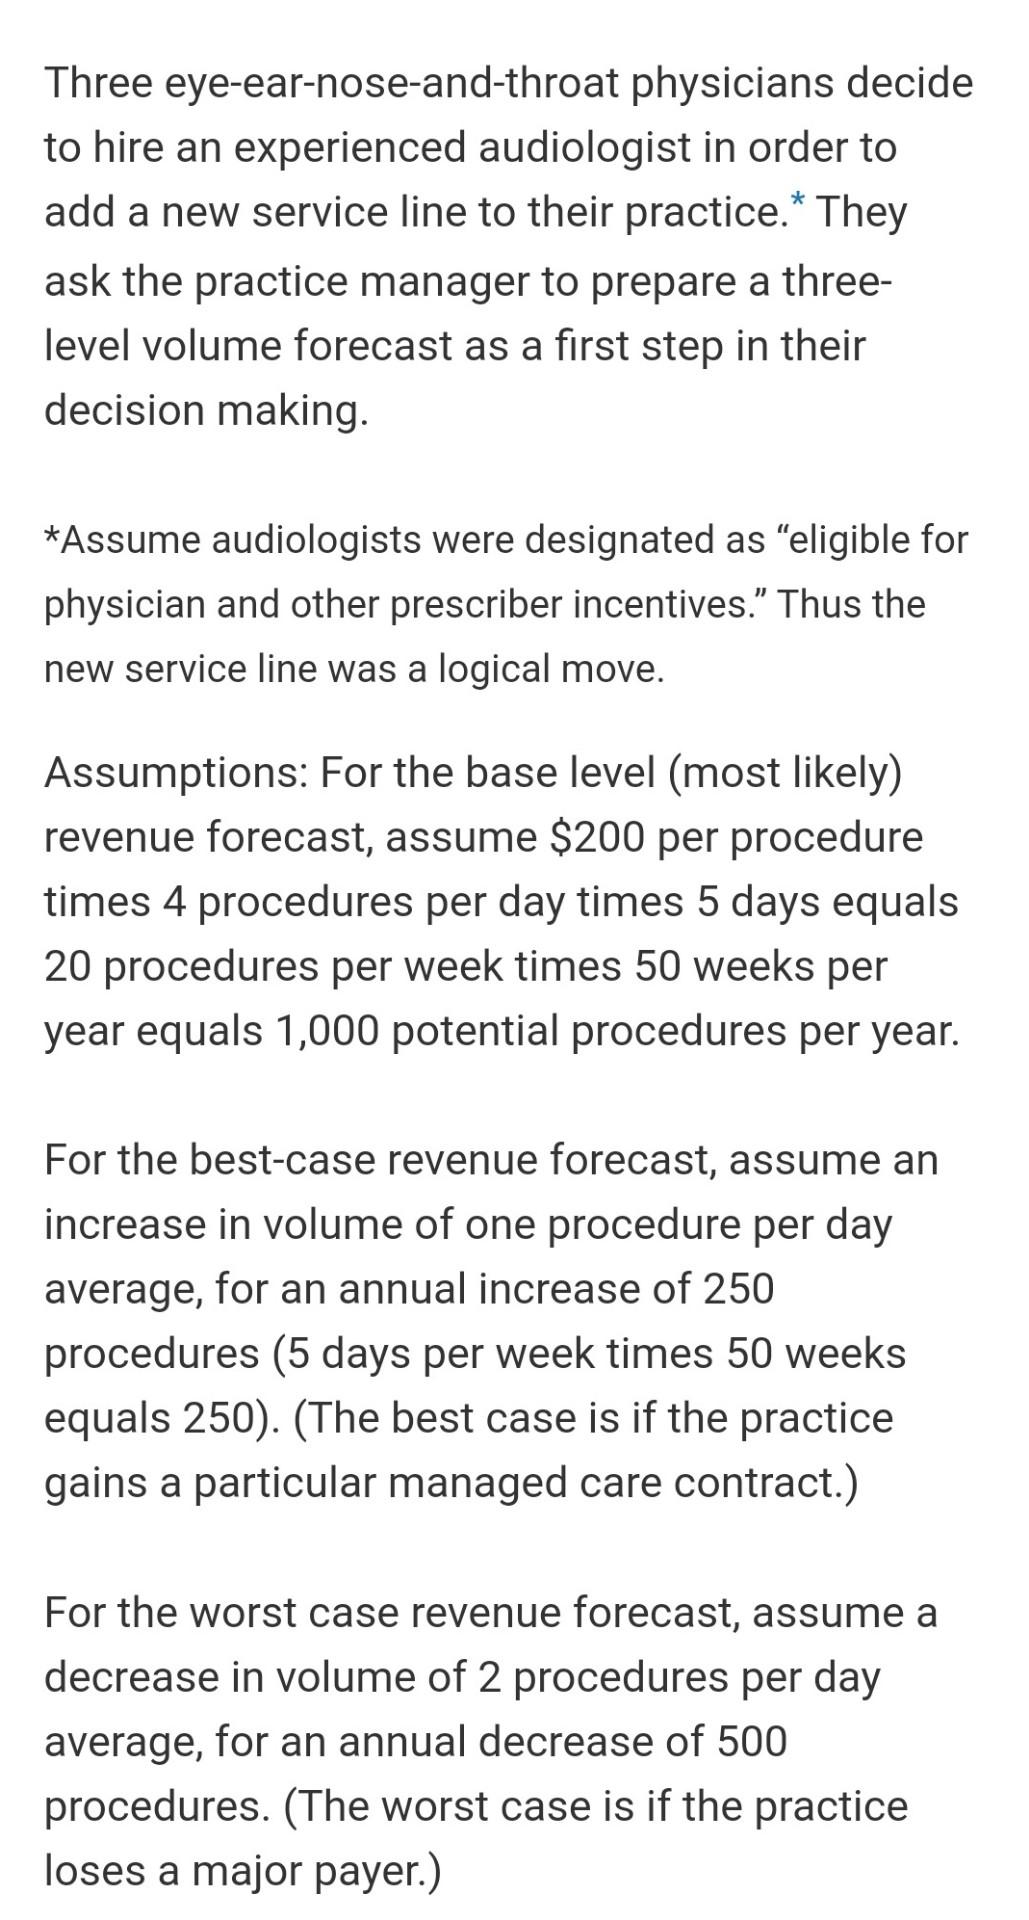
The idea of this assignment is that since we cannot tell the future we often make assumptions of what is likely to happen. When we make assumptions, we tend to have a realistic idea of what could happen, a sense of a 'worse case' scenario, and a sense of a 'best case' scenario. Looking at these three options helps us anticipate future need and plan accordingly.
To complete this assignment, you must calculate the revenue forecasts at each level (and show your work), but you do not need to create the line chart shown in Figure 18-5 (p. 219). In other words, just show your calculations -- do not worry about creating a chart/graph.
Assignment Exercise 18-2 already provides you with the facts that you need. You are given the the 'base level' forecast (which would be the same as the 'basic forecast' line in Fig. 18-5). From that you can use addition and subtraction to calculate the 'high forecast' (or 'best case') and 'low forecast' (or 'worst case') revenue amounts.
You might find it helpful to use this format:
Best: best volume per year x rate per procedure = best revenue per year
Base: base volume per year x rate per procedure = base revenue per year
Worse: worse volume per year x rate per procedure = worse revenue per year
Assignment Exercise 182: Three-Level Revenue Forecast
Step by Step Solution
There are 3 Steps involved in it
Step: 1

Get Instant Access to Expert-Tailored Solutions
See step-by-step solutions with expert insights and AI powered tools for academic success
Step: 2

Step: 3
Ace Your Homework with AI
Get the answers you need in no time with our AI-driven, step-by-step assistance
Get Started
Robonomics Prepare Today For The Jobless Economy Of Tomorrow
Authors: John Crews
1st Edition
1530910463, 978-1530910465