ASSIGNMENT in R art 3 SIMPLE and MULTIPLE REGRESSION To insert the plots, use Plots > Copy Clipboard in RStudio menu. Problem 7 l3+2+3+2+ 5+5=20marksl
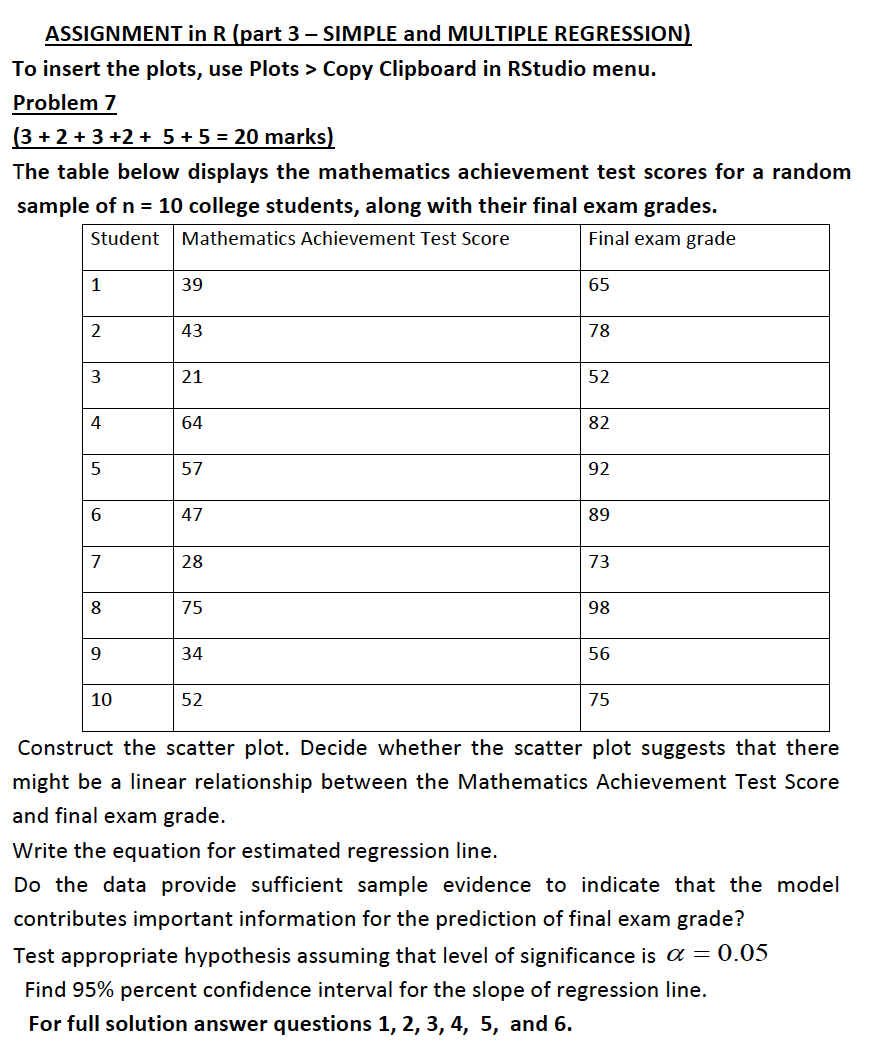
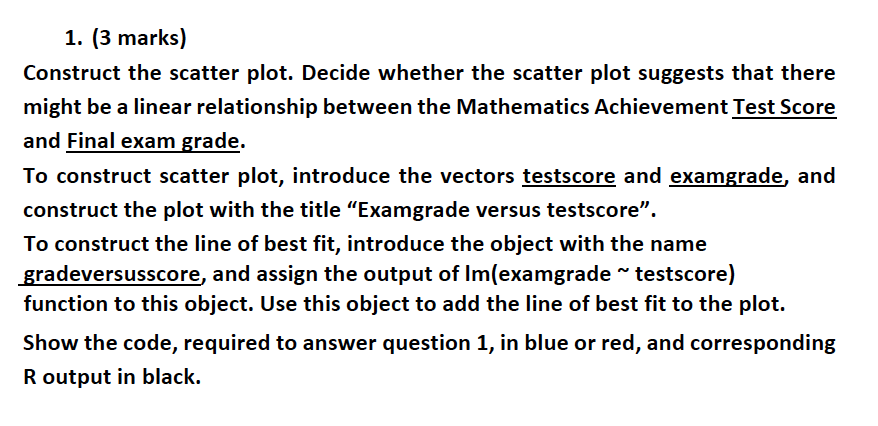
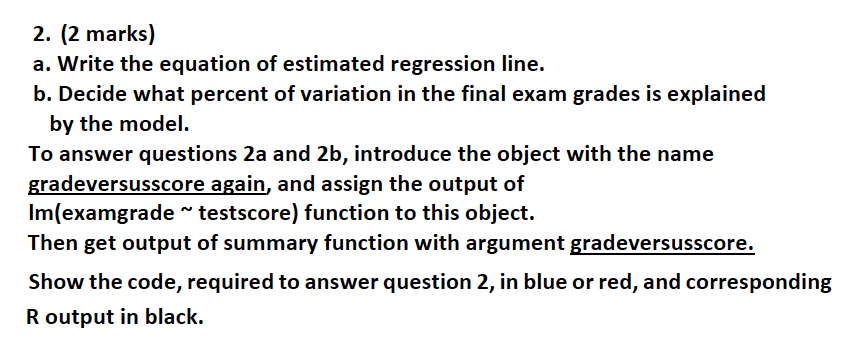
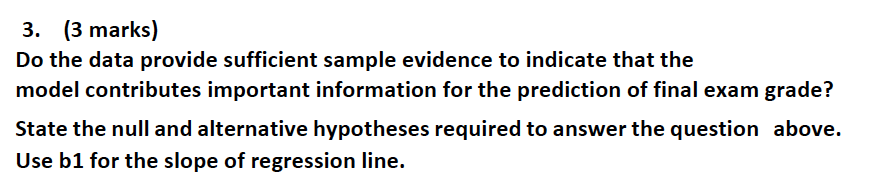
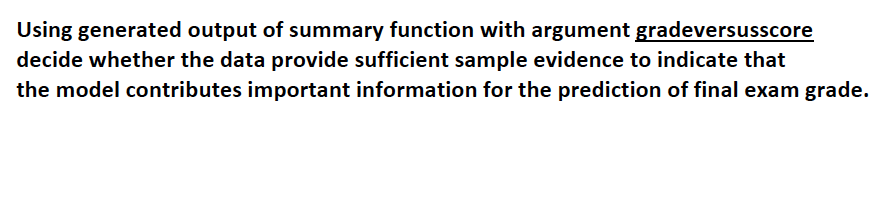
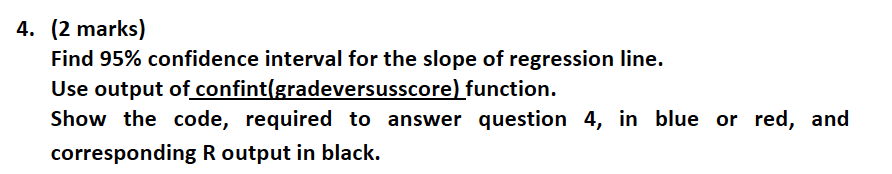
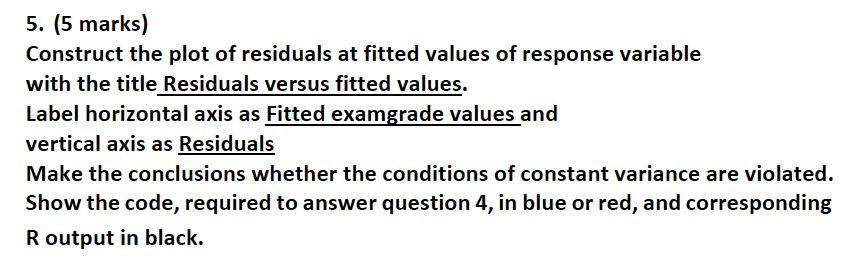
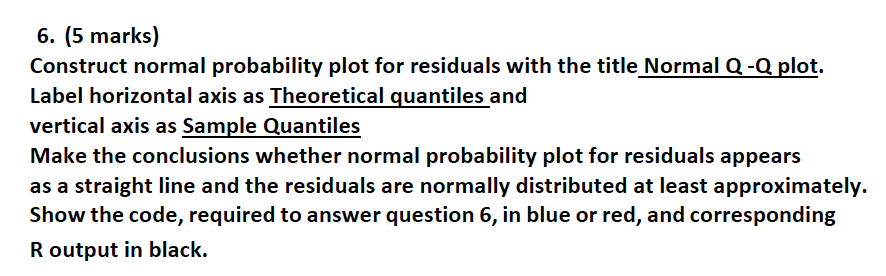
ASSIGNMENT in R art 3 SIMPLE and MULTIPLE REGRESSION To insert the plots, use Plots > Copy Clipboard in RStudio menu. Problem 7 l3+2+3+2+ 5+5=20marksl The table below displays the mathematics achievement test scores for a random sample of n = 10 college students, along with their final exam grades. Student Mathematics Achievement Test Score Final exam grade 1 39 65 2 43 78 3 21 52 4 64 82 5 57 92 6 47 89 7 28 73 8 75 98 9 34 56 10 52 75 Construct the scatter plot. Decide whether the scatter plot suggests that there might be a linear relationship between the Mathematics Achievement Test Score and final exam grade. Write the equation for estimated regression line. Do the data provide sufficient sample evidence to indicate that the model contributes important information for the prediction of final exam grade? Test appropriate hypothesis assuming that level of significance is (I = 0.05 Find 95% percent confidence interval for the slope of regression line. For full solution answer questions 1, 2, 3, 4, 5, and 6. 1. (3 marks} Construct the scatter plot. Decide whether the scatter plot suggests that there might be a linear relationship between the Mathematics Achievement Test Score and Final exam grade. To construct scatter plot, introduce the vectors testscore and examgrade, and construct the plot with the title "Examgrade versus testscore". To construct the line of best fit, introduce the object with the name W and assign the output of lm(examgrade " testscore) function to this object. Use this object to add the line of best fit to the plot. Show the code, required to answer question 1, in blue or red, and corresponding R output in black. 2. [2 marks) a. Write the equation of estimated regression line. b. Decide what percent of variation in the final exam grades is explained by the model. To answer questions 2a and 2b, introduce the object with the name gradeversusscore again, and assign the output of lmlexamgrade \" testscore} function to this object. Then get output of summary function with argument gradeversusscore. Show the code, required to answer question 2, in blue or red, and corresponding R output in black. 3. [3 marks) Do the data provide sufficient sample evidence to indicate that the model contributes important information for the prediction of final exam grade? State the null and alternative hypotheses required to answer the question above. Use b1 for the slope of regression line. Using generated output of summary function with argument gradeversusscore decide whether the data provide sufficient sample evidence to indicate that the model contributes important information for the prediction of final exam grade. 4. (2 marks} Find 95% confidence interval for the slope of regression line. Use output of confintlgradeversusscorel function. Show the code, required to answer question 4, in blue or red, and corresponding R output in black. 5. [5 marks) Construct the plot of residuals at fitted values of response variable with the title Residuals versus fitted values. Label horizontal axis as Fitted examgrade values and vertical axis as Residuals Make the conclusions whether the conditions of constant variance are violated. Show the code, required to answer question 4, in blue or red, and corresponding R output in black. 6. [5 marks) Construct normal probability plot for residuals with the title Normal (1 -C1 plot. Label horizontal axis as Theoretical guantiles and vertical axis as Sample Quantiles Make the conclusions whether normal probability plot for residuals appears as a straight line and the residuals are normallyr distributed at least approximately. Show the code, required to answer question 6, in blue or red, and corresponding R output in black
Step by Step Solution
There are 3 Steps involved in it
Step: 1
Get Instant Access to Expert-Tailored Solutions
See step-by-step solutions with expert insights and AI powered tools for academic success
Step: 2
Step: 3
Ace Your Homework with AI
Get the answers you need in no time with our AI-driven, step-by-step assistance