

Answered step by step
Verified Expert Solution
Question
1 Approved Answer
Assignment Part 2 - Bayes; Conditional Probability Data have been collected from the Kirsten Skeletal Collection (KSC) which is housed within the Division of
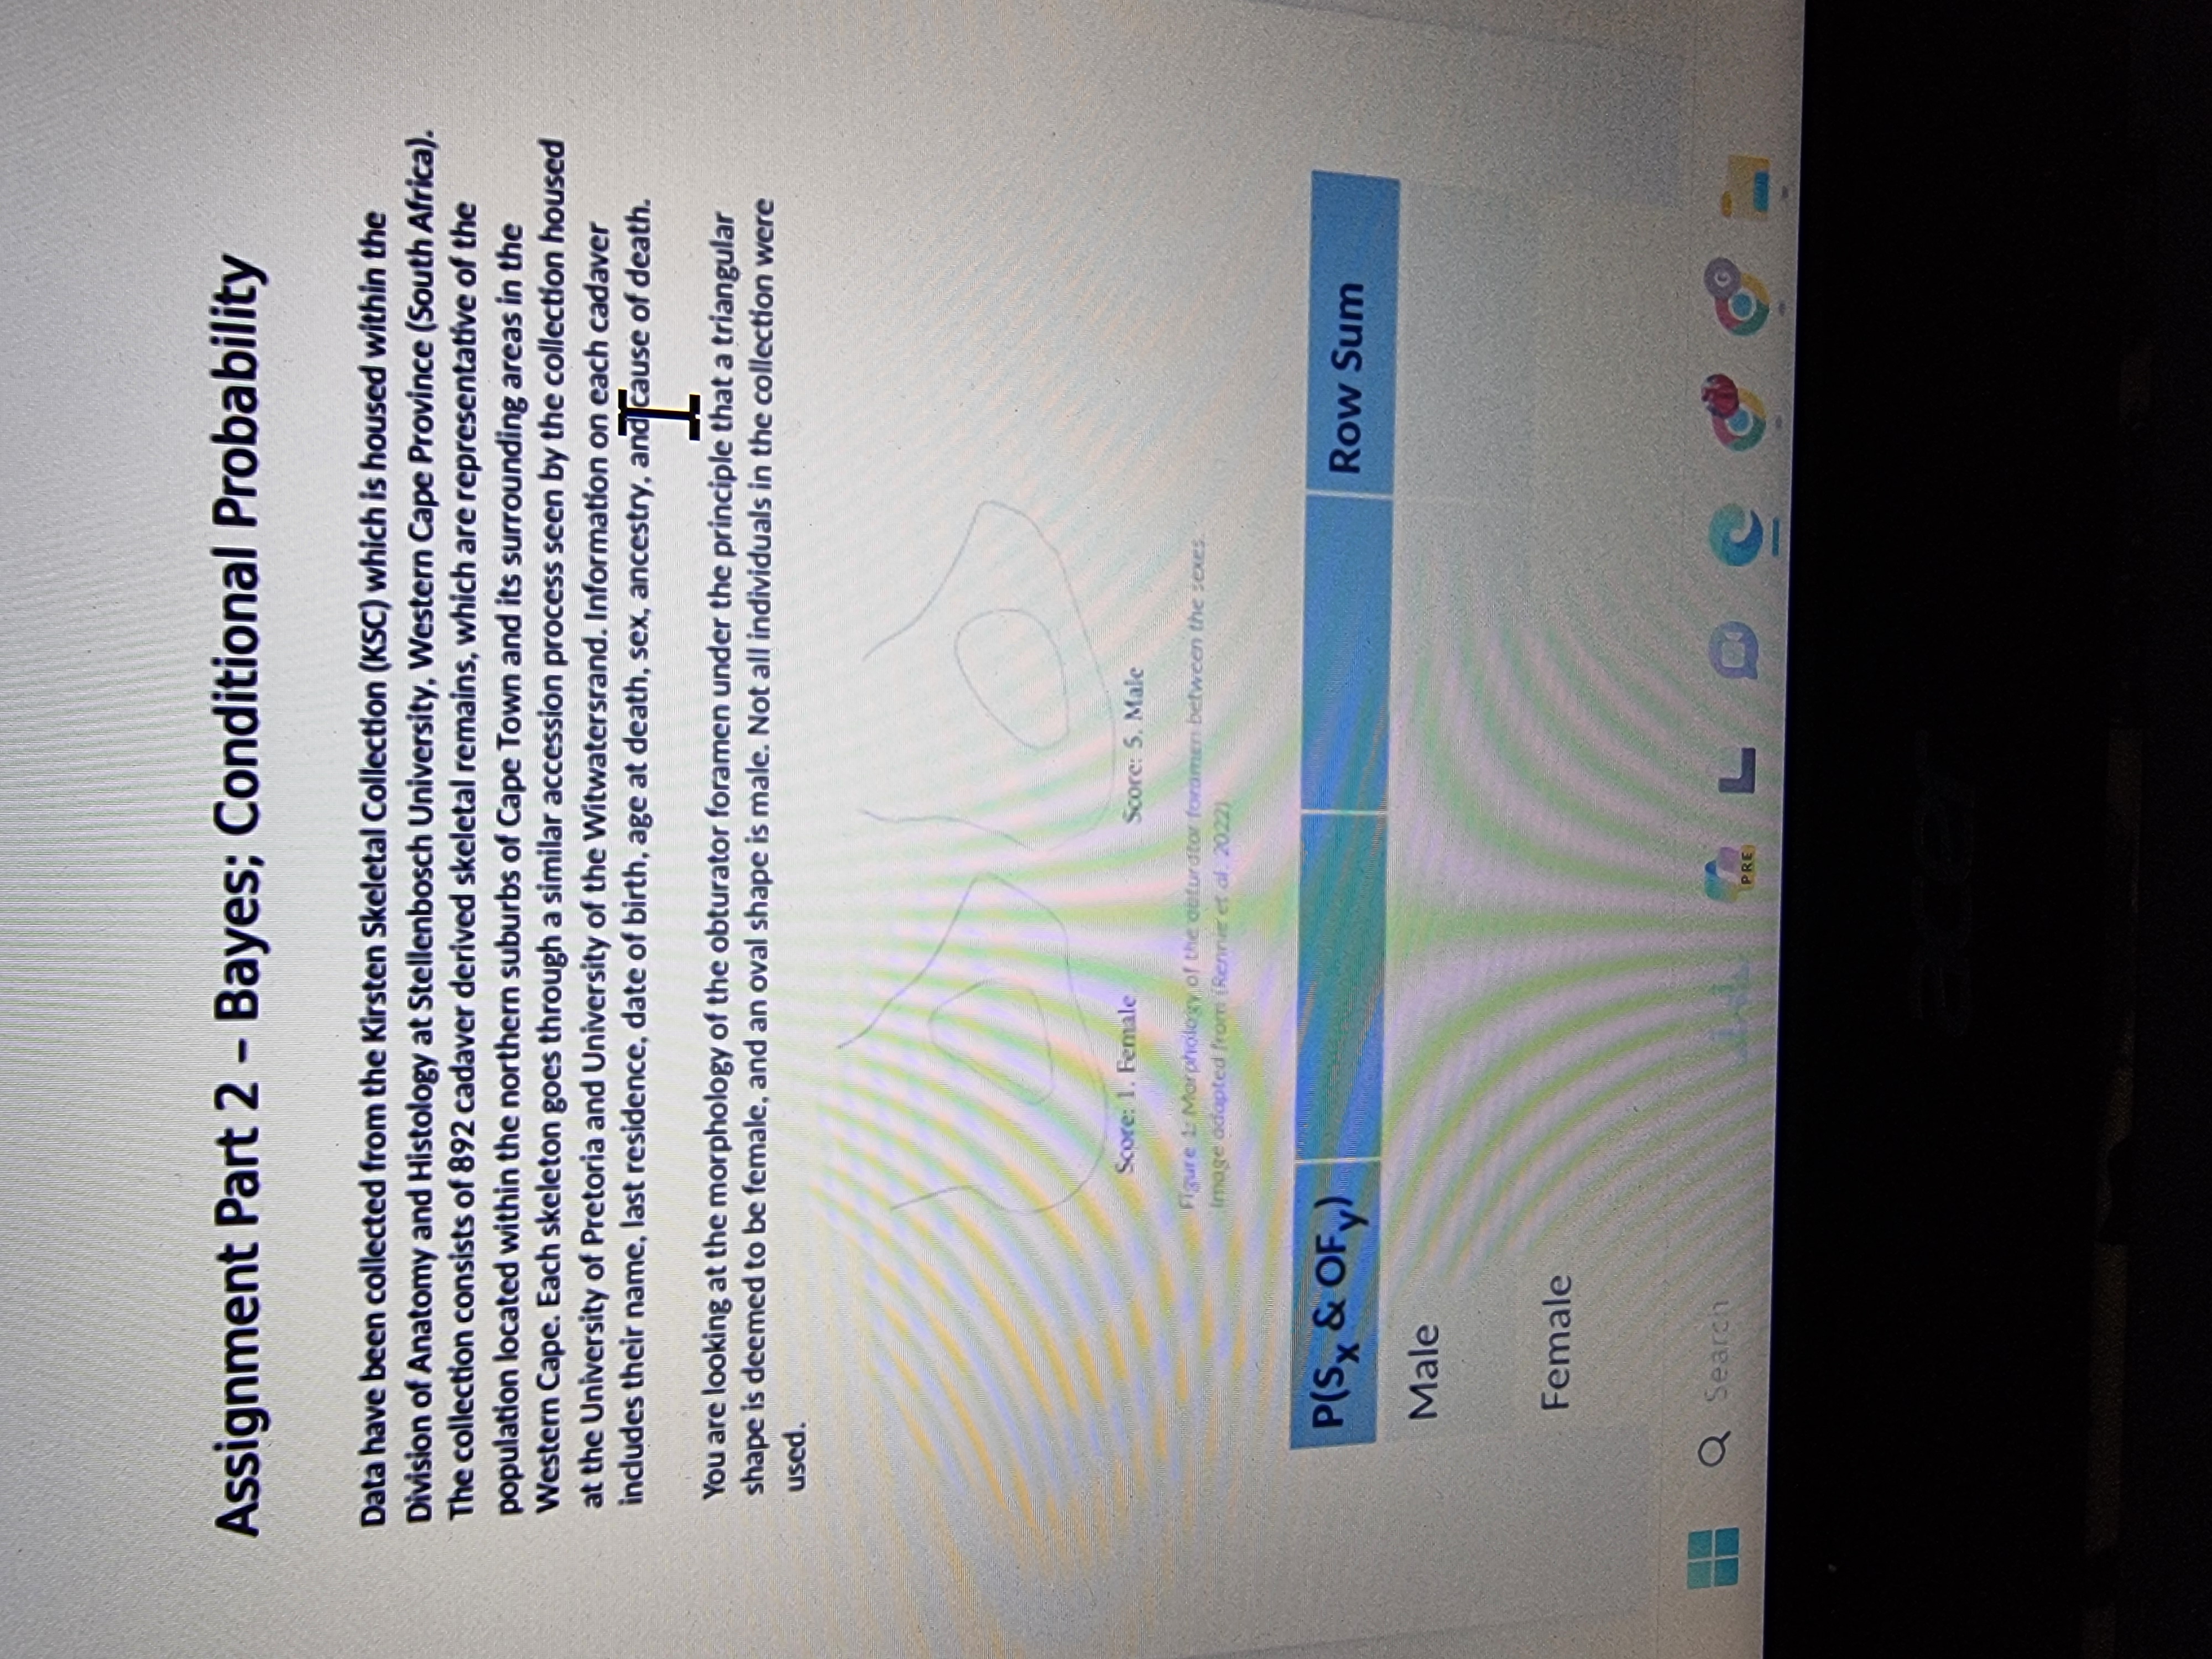
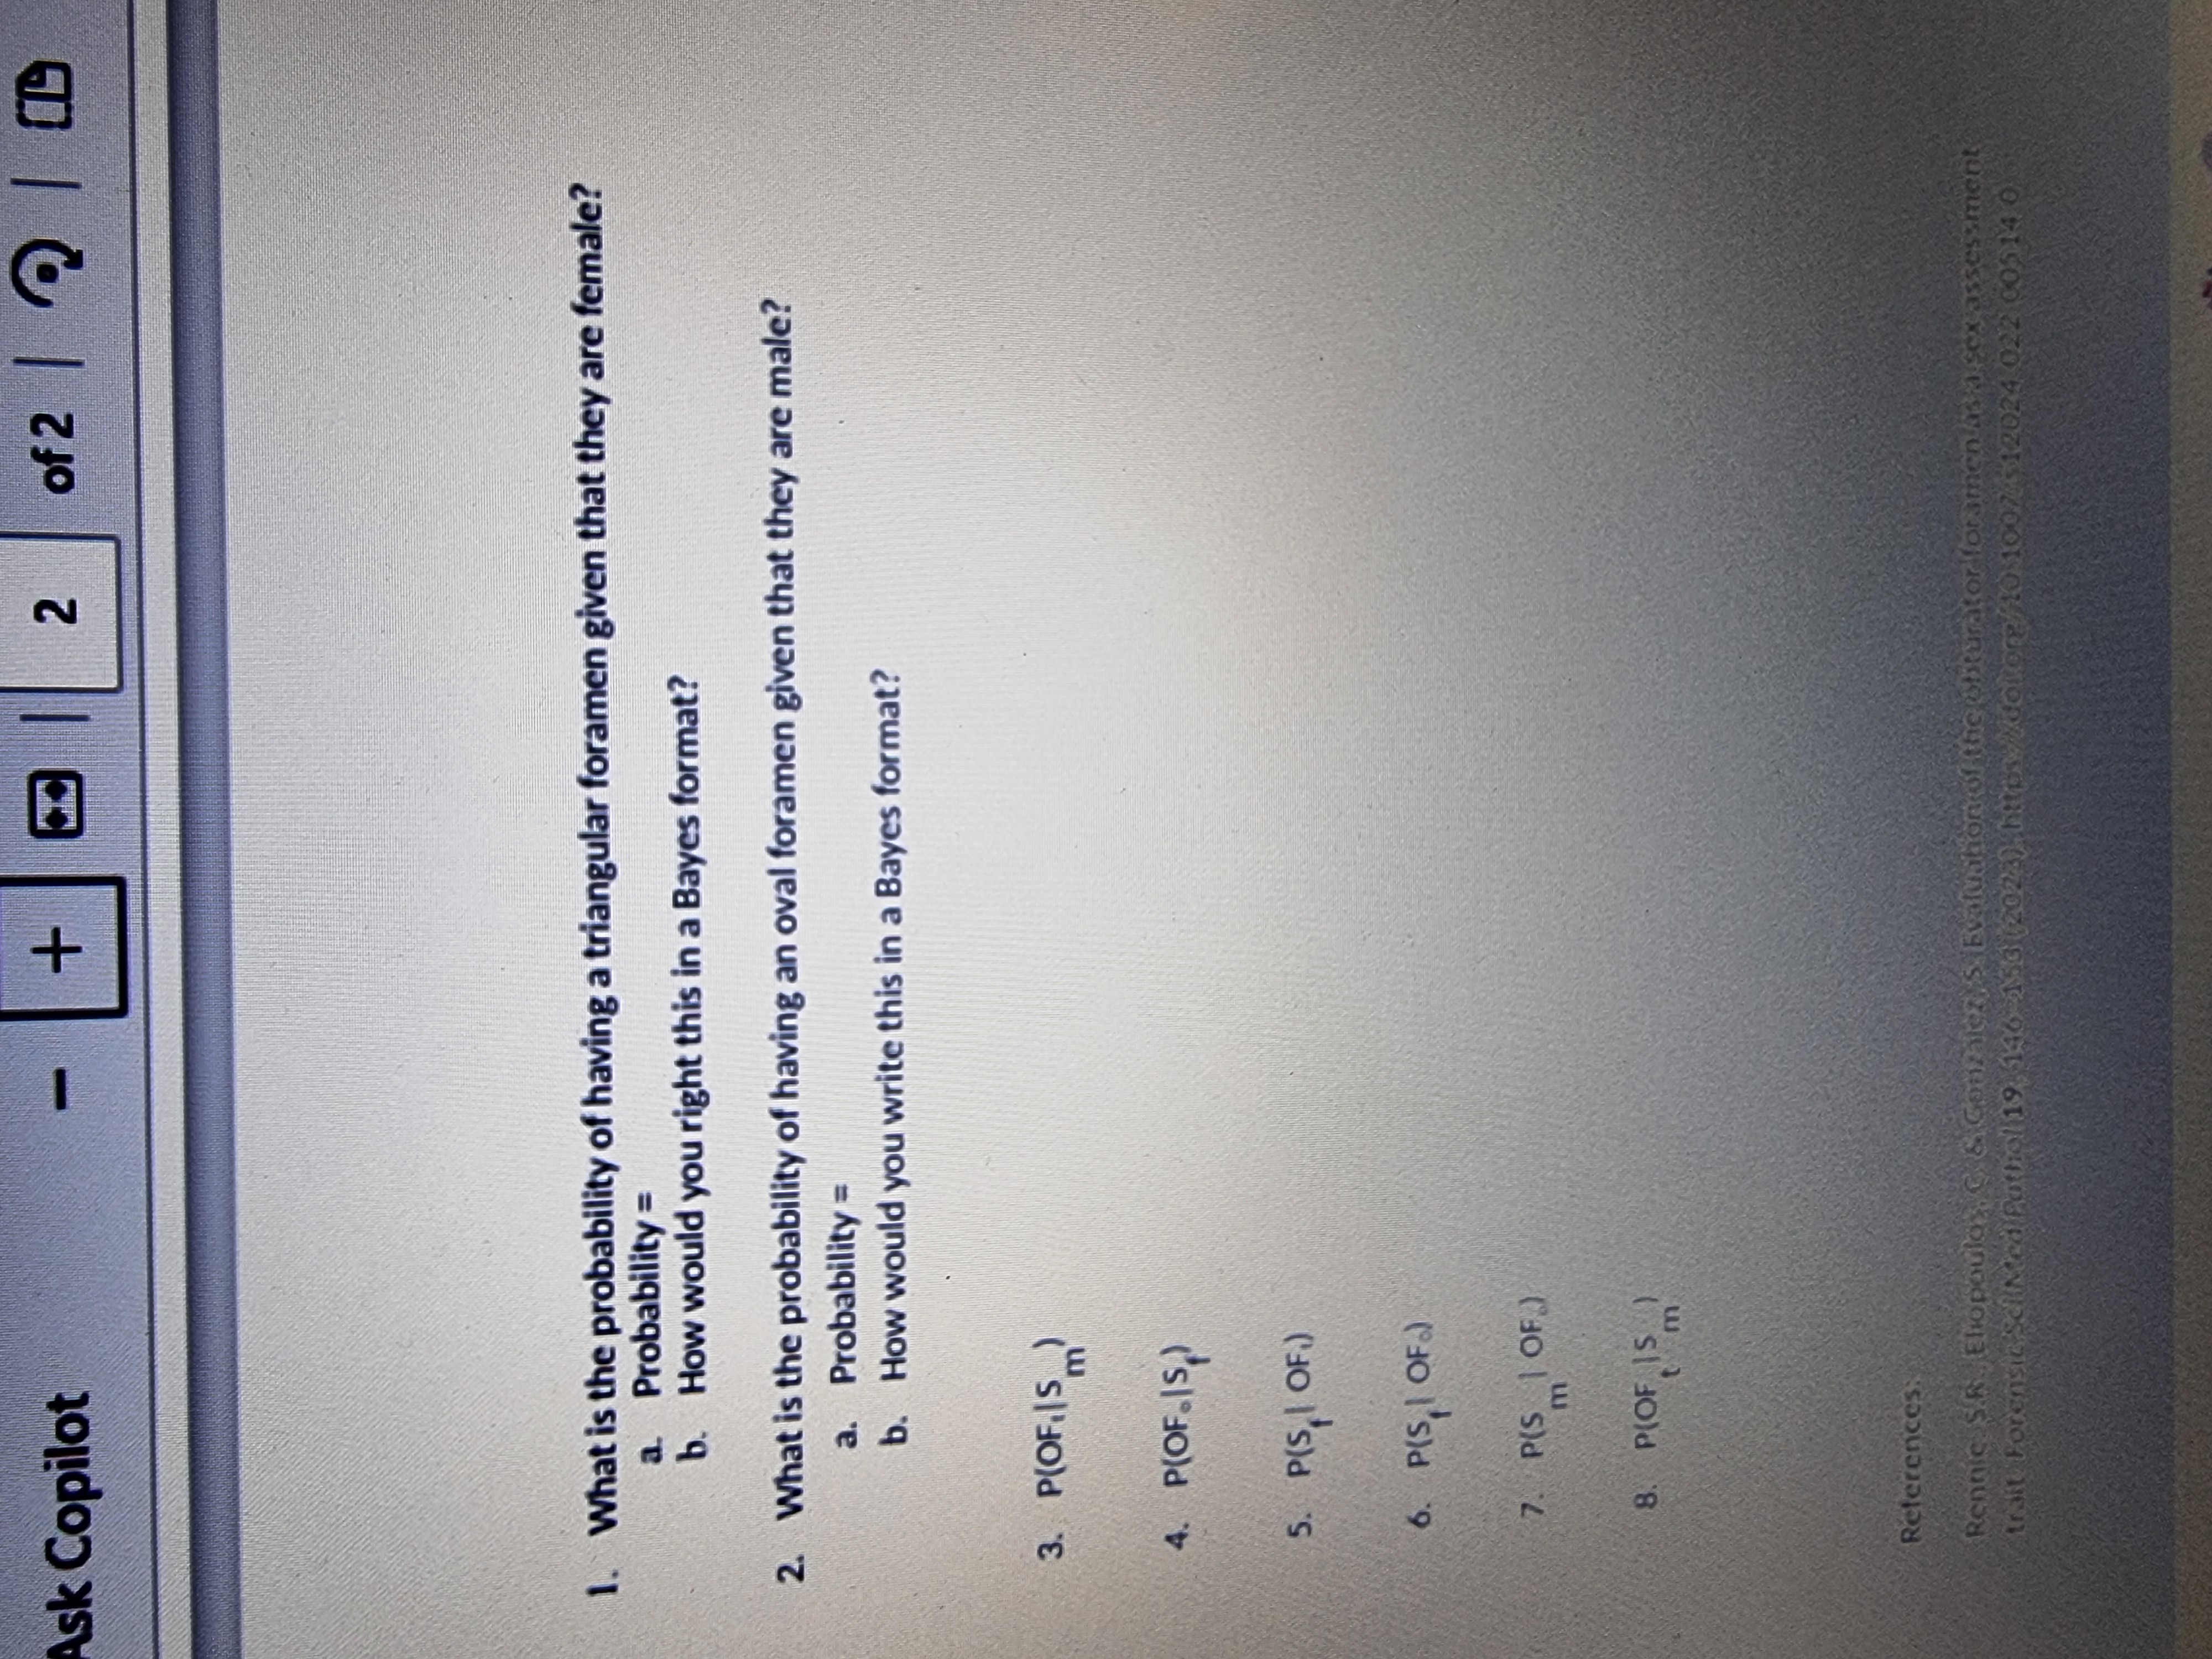
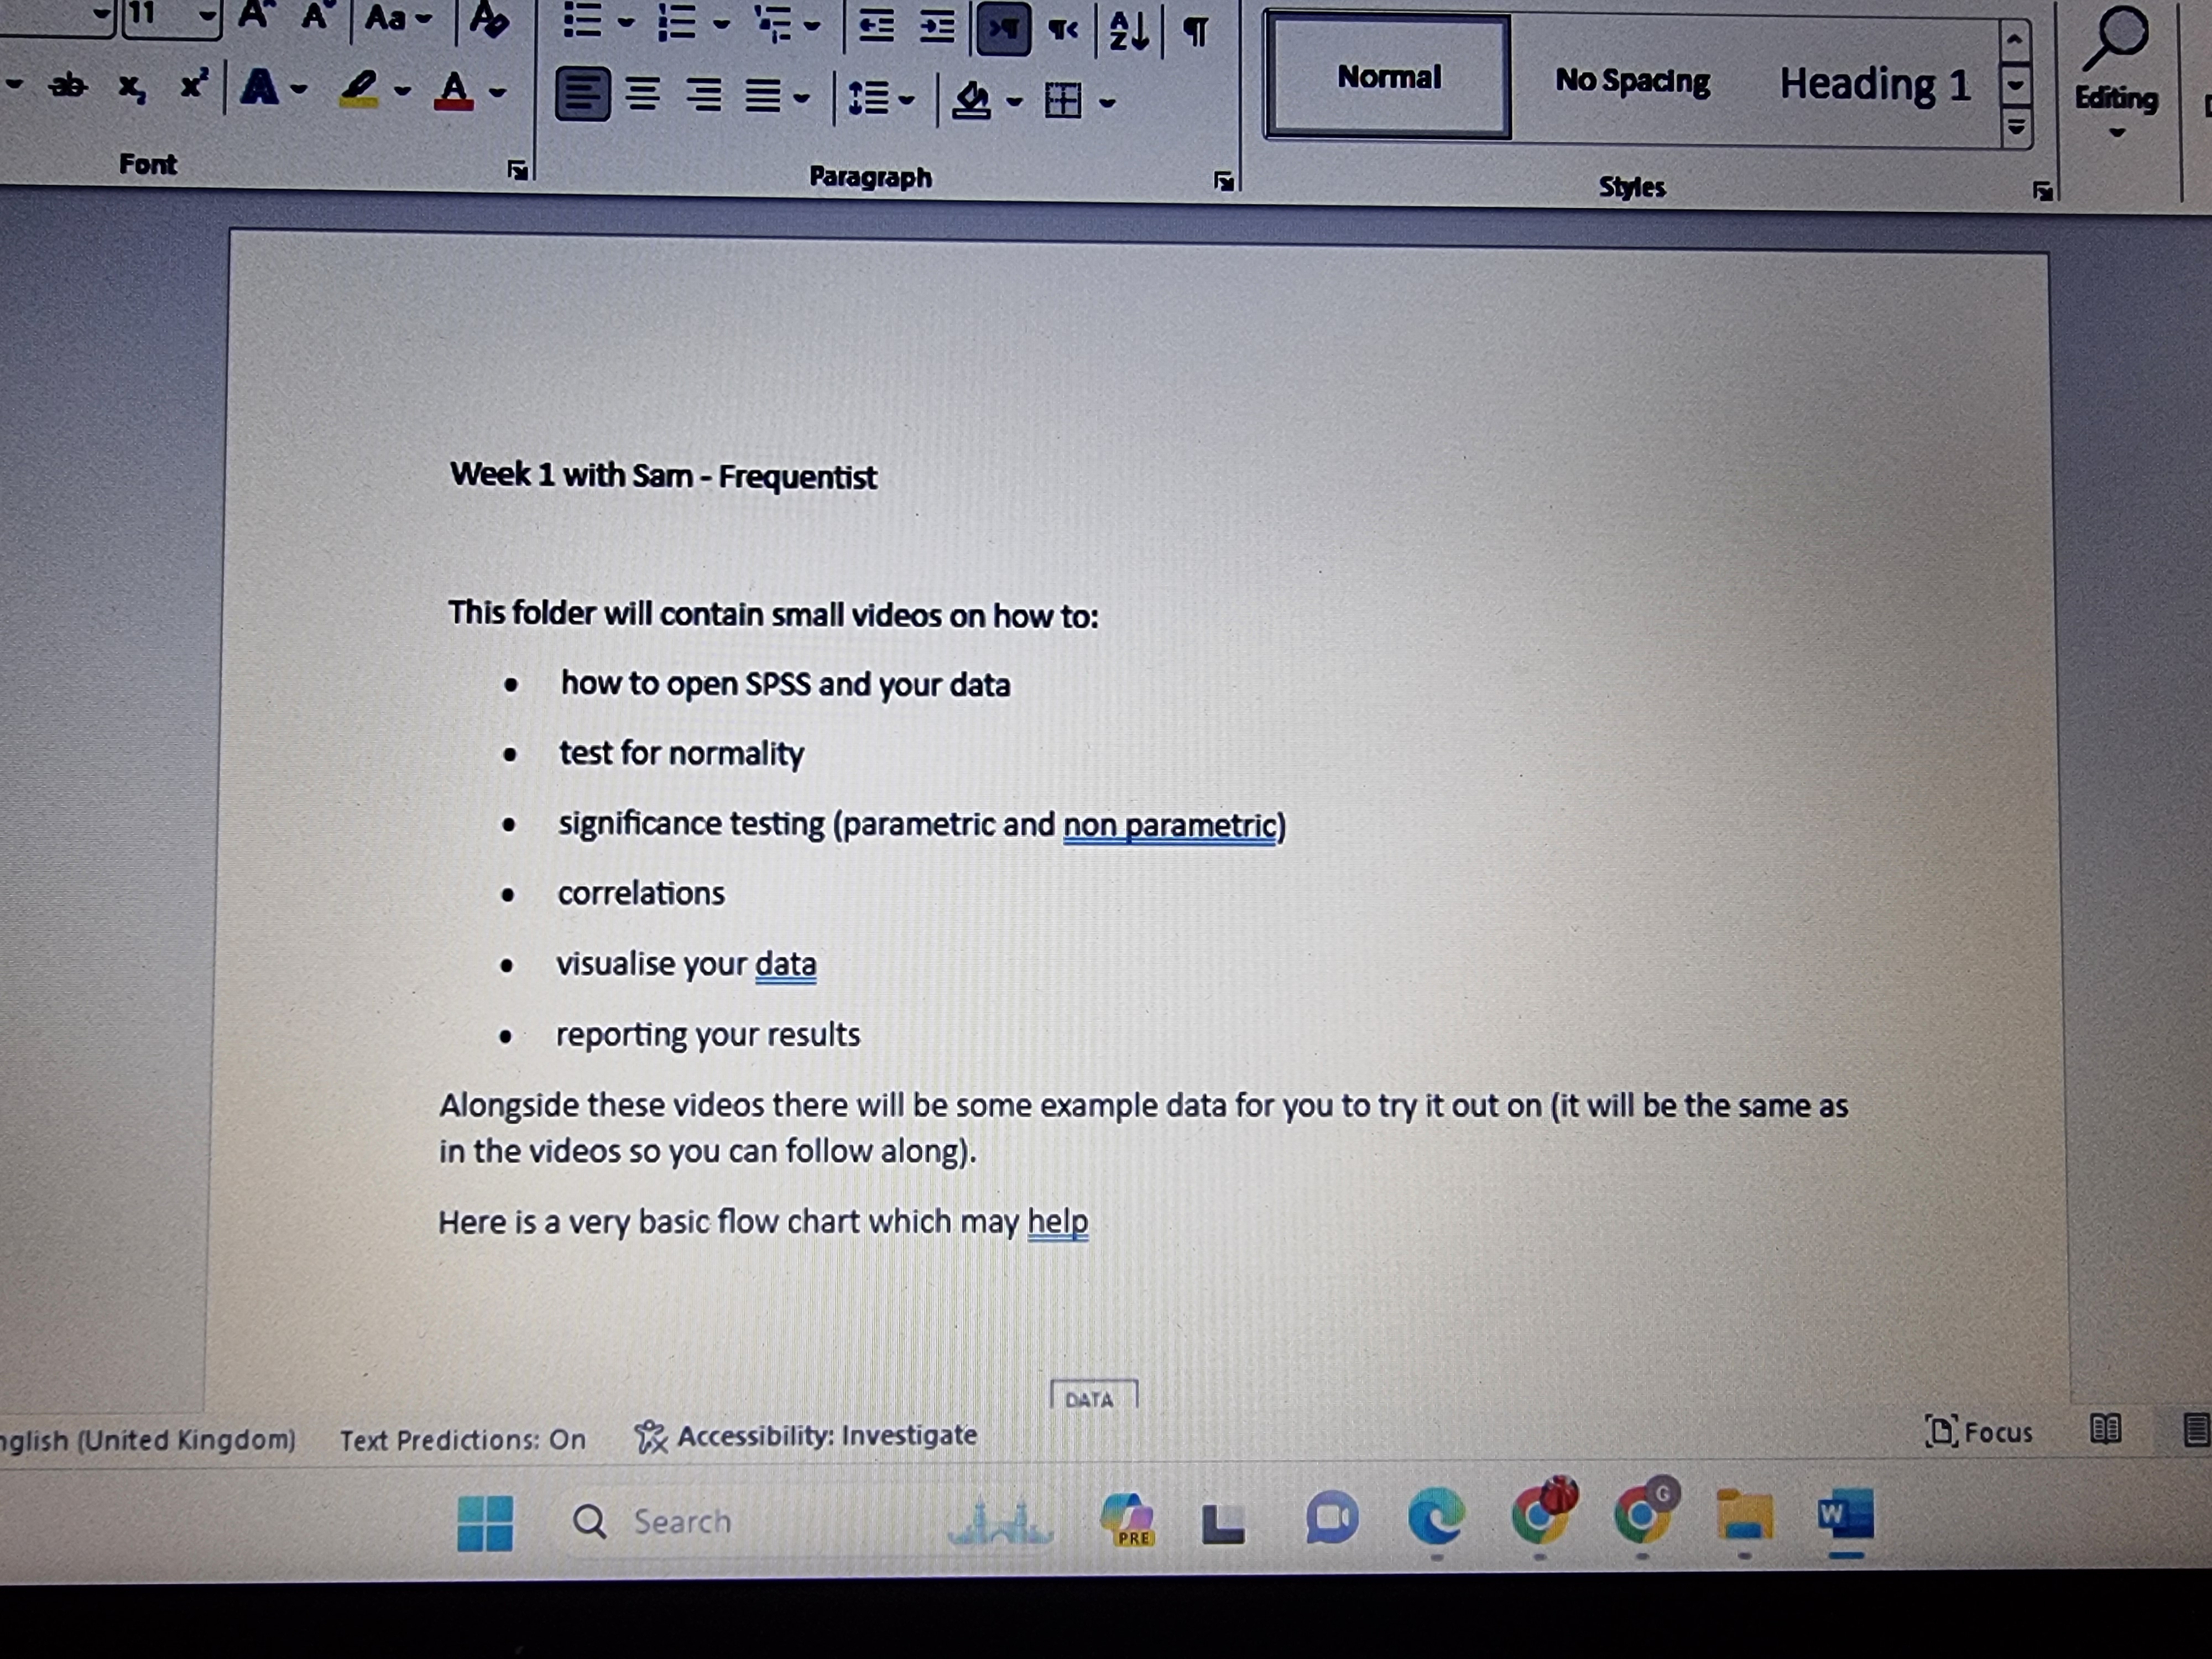
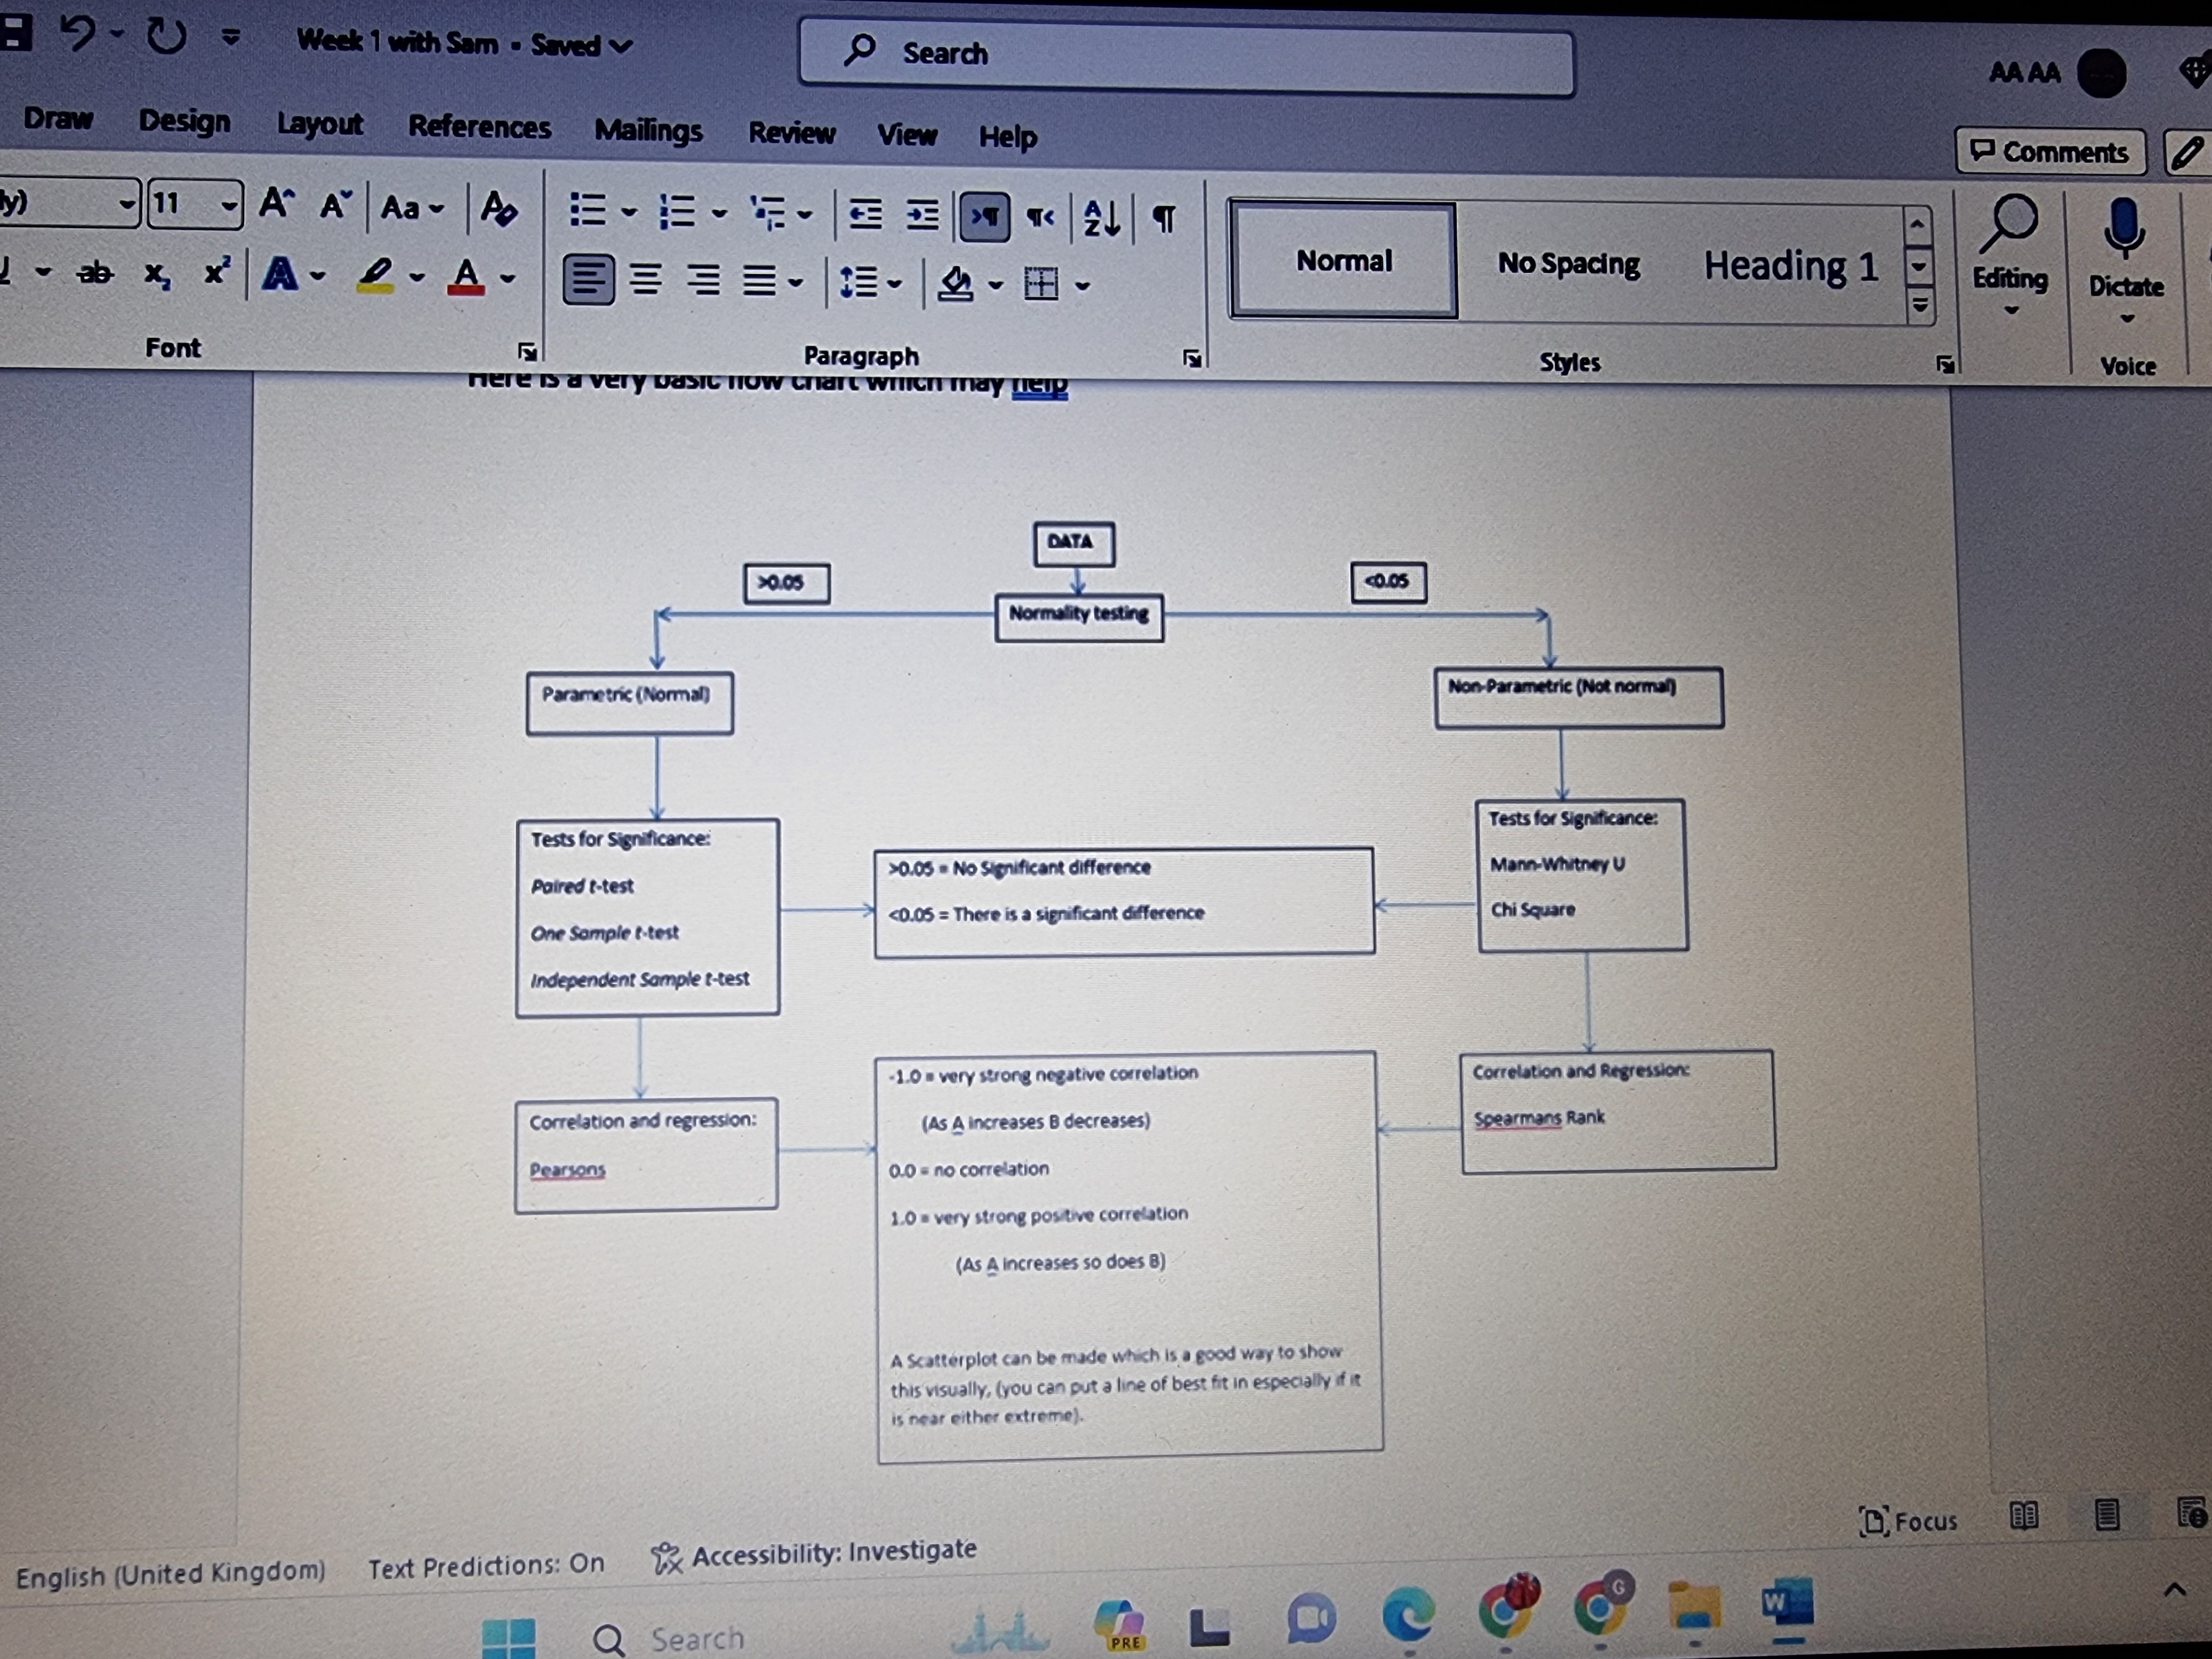
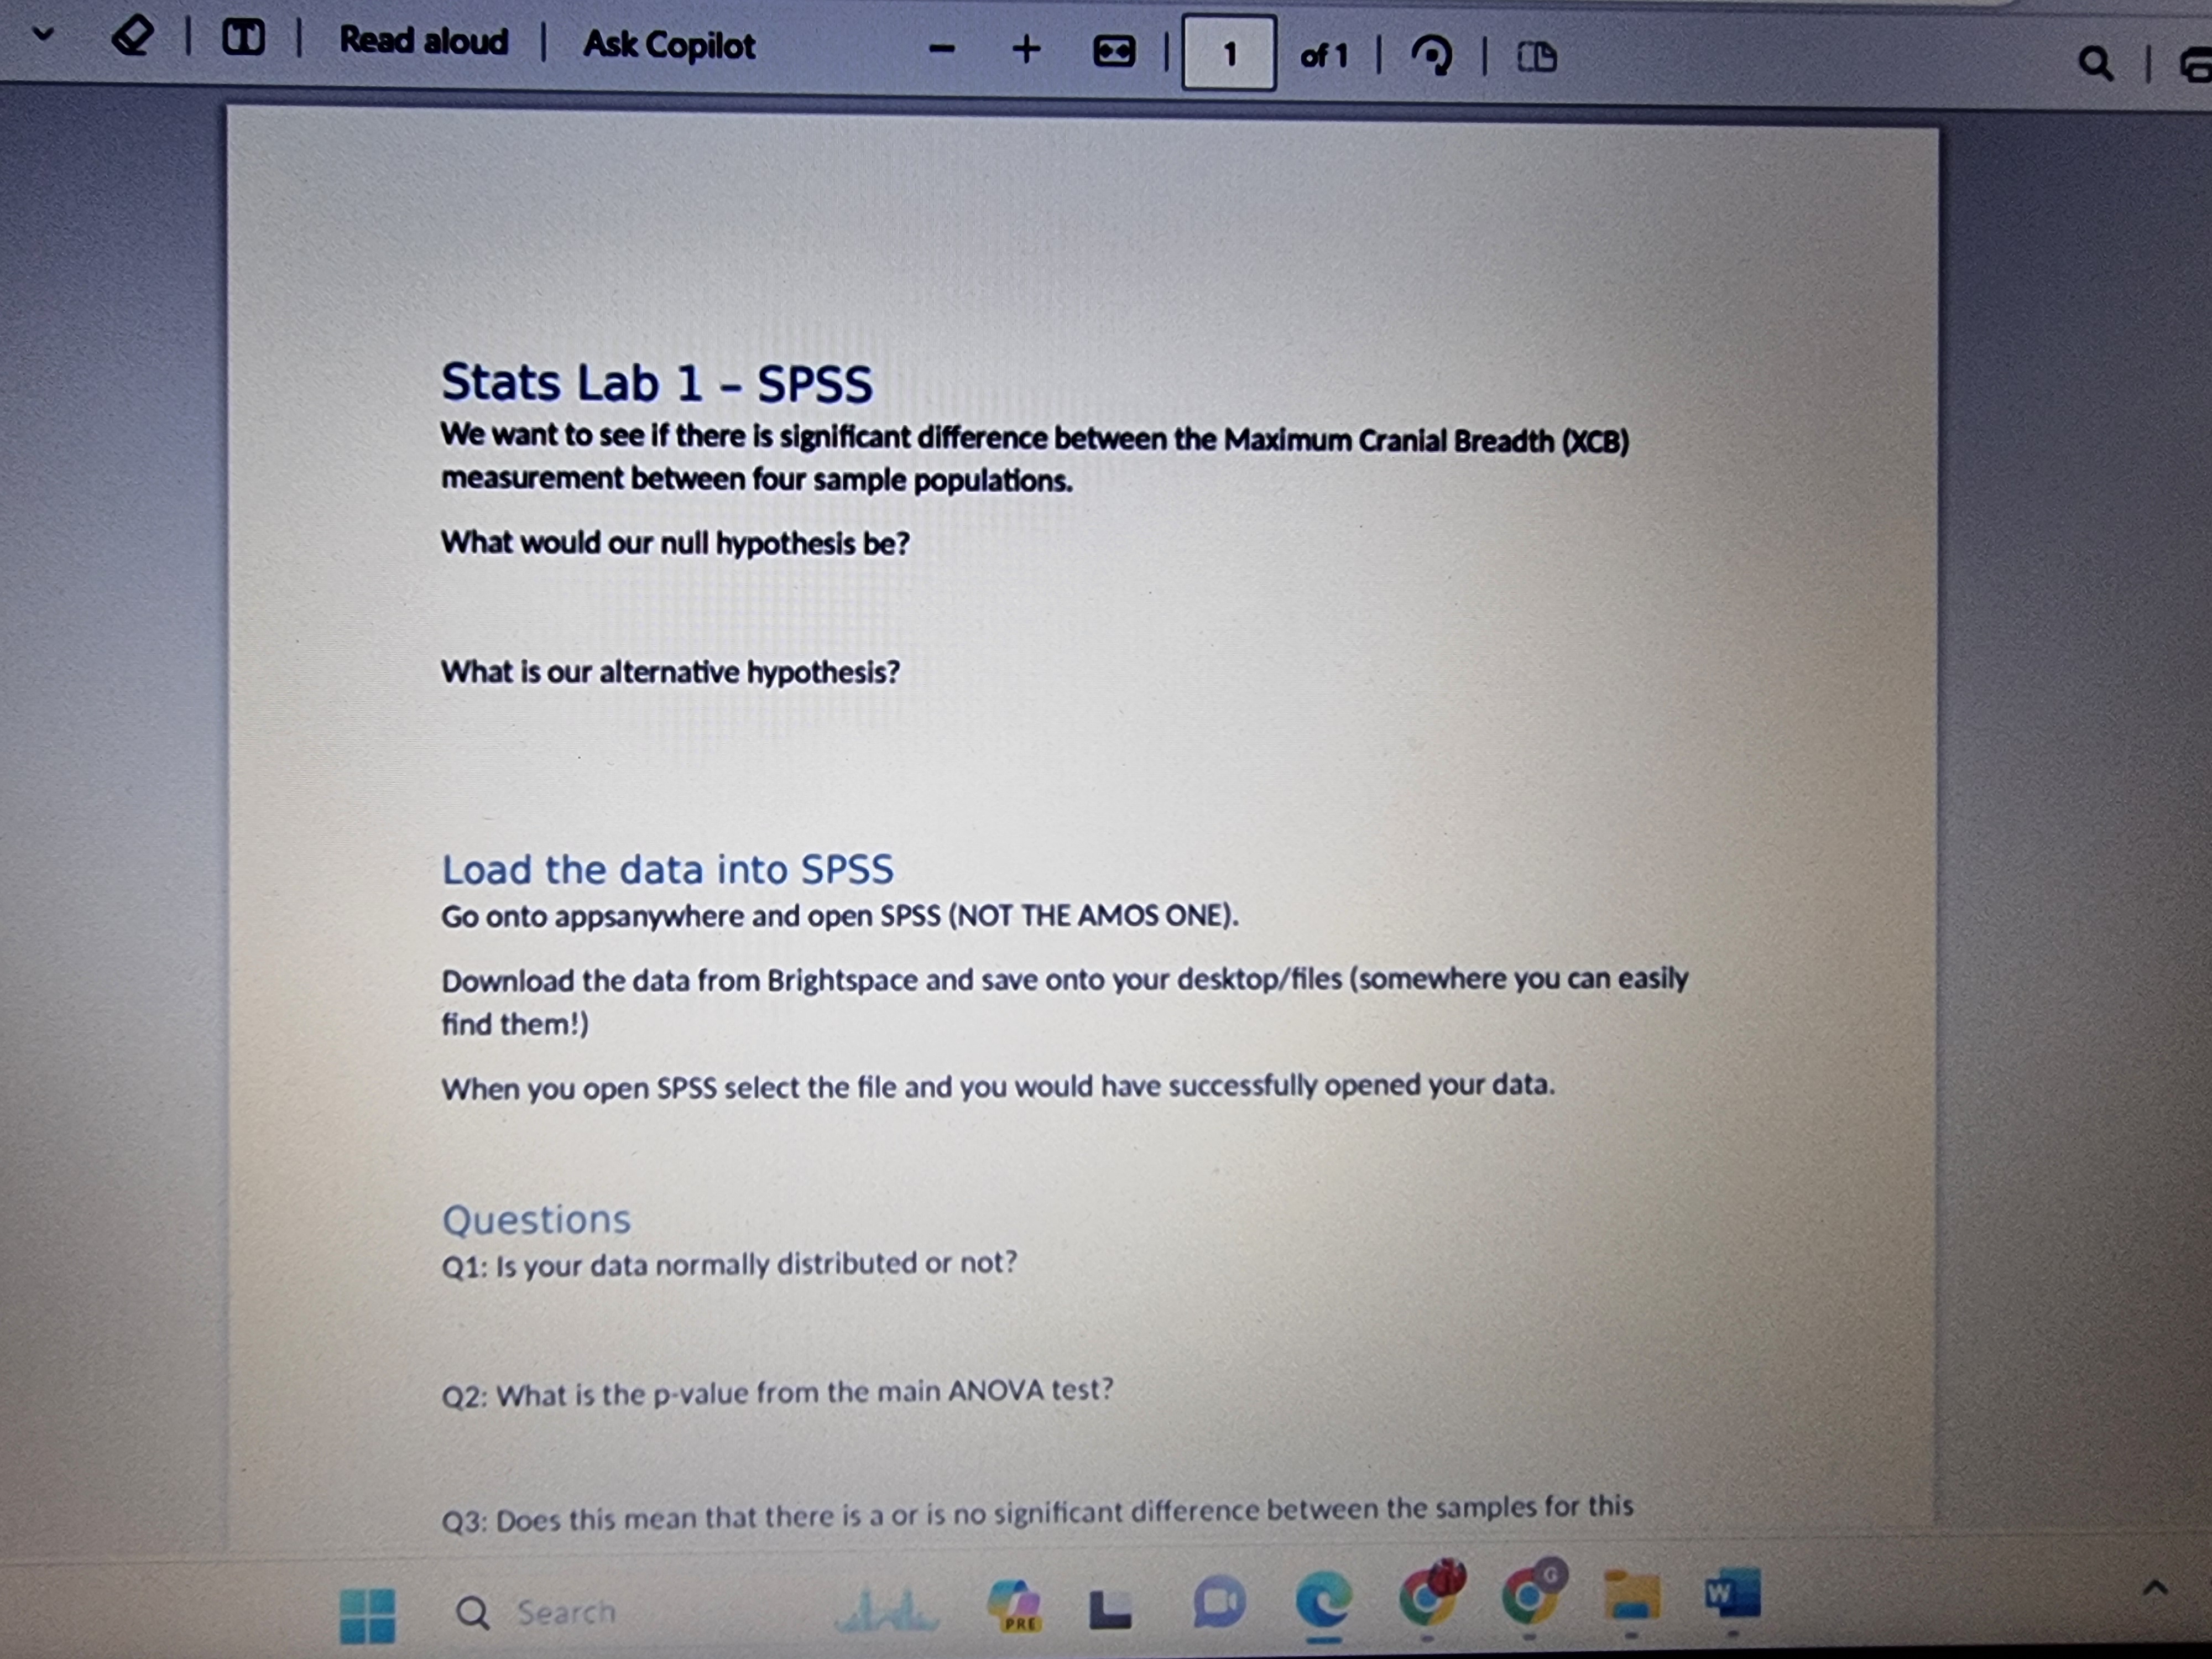
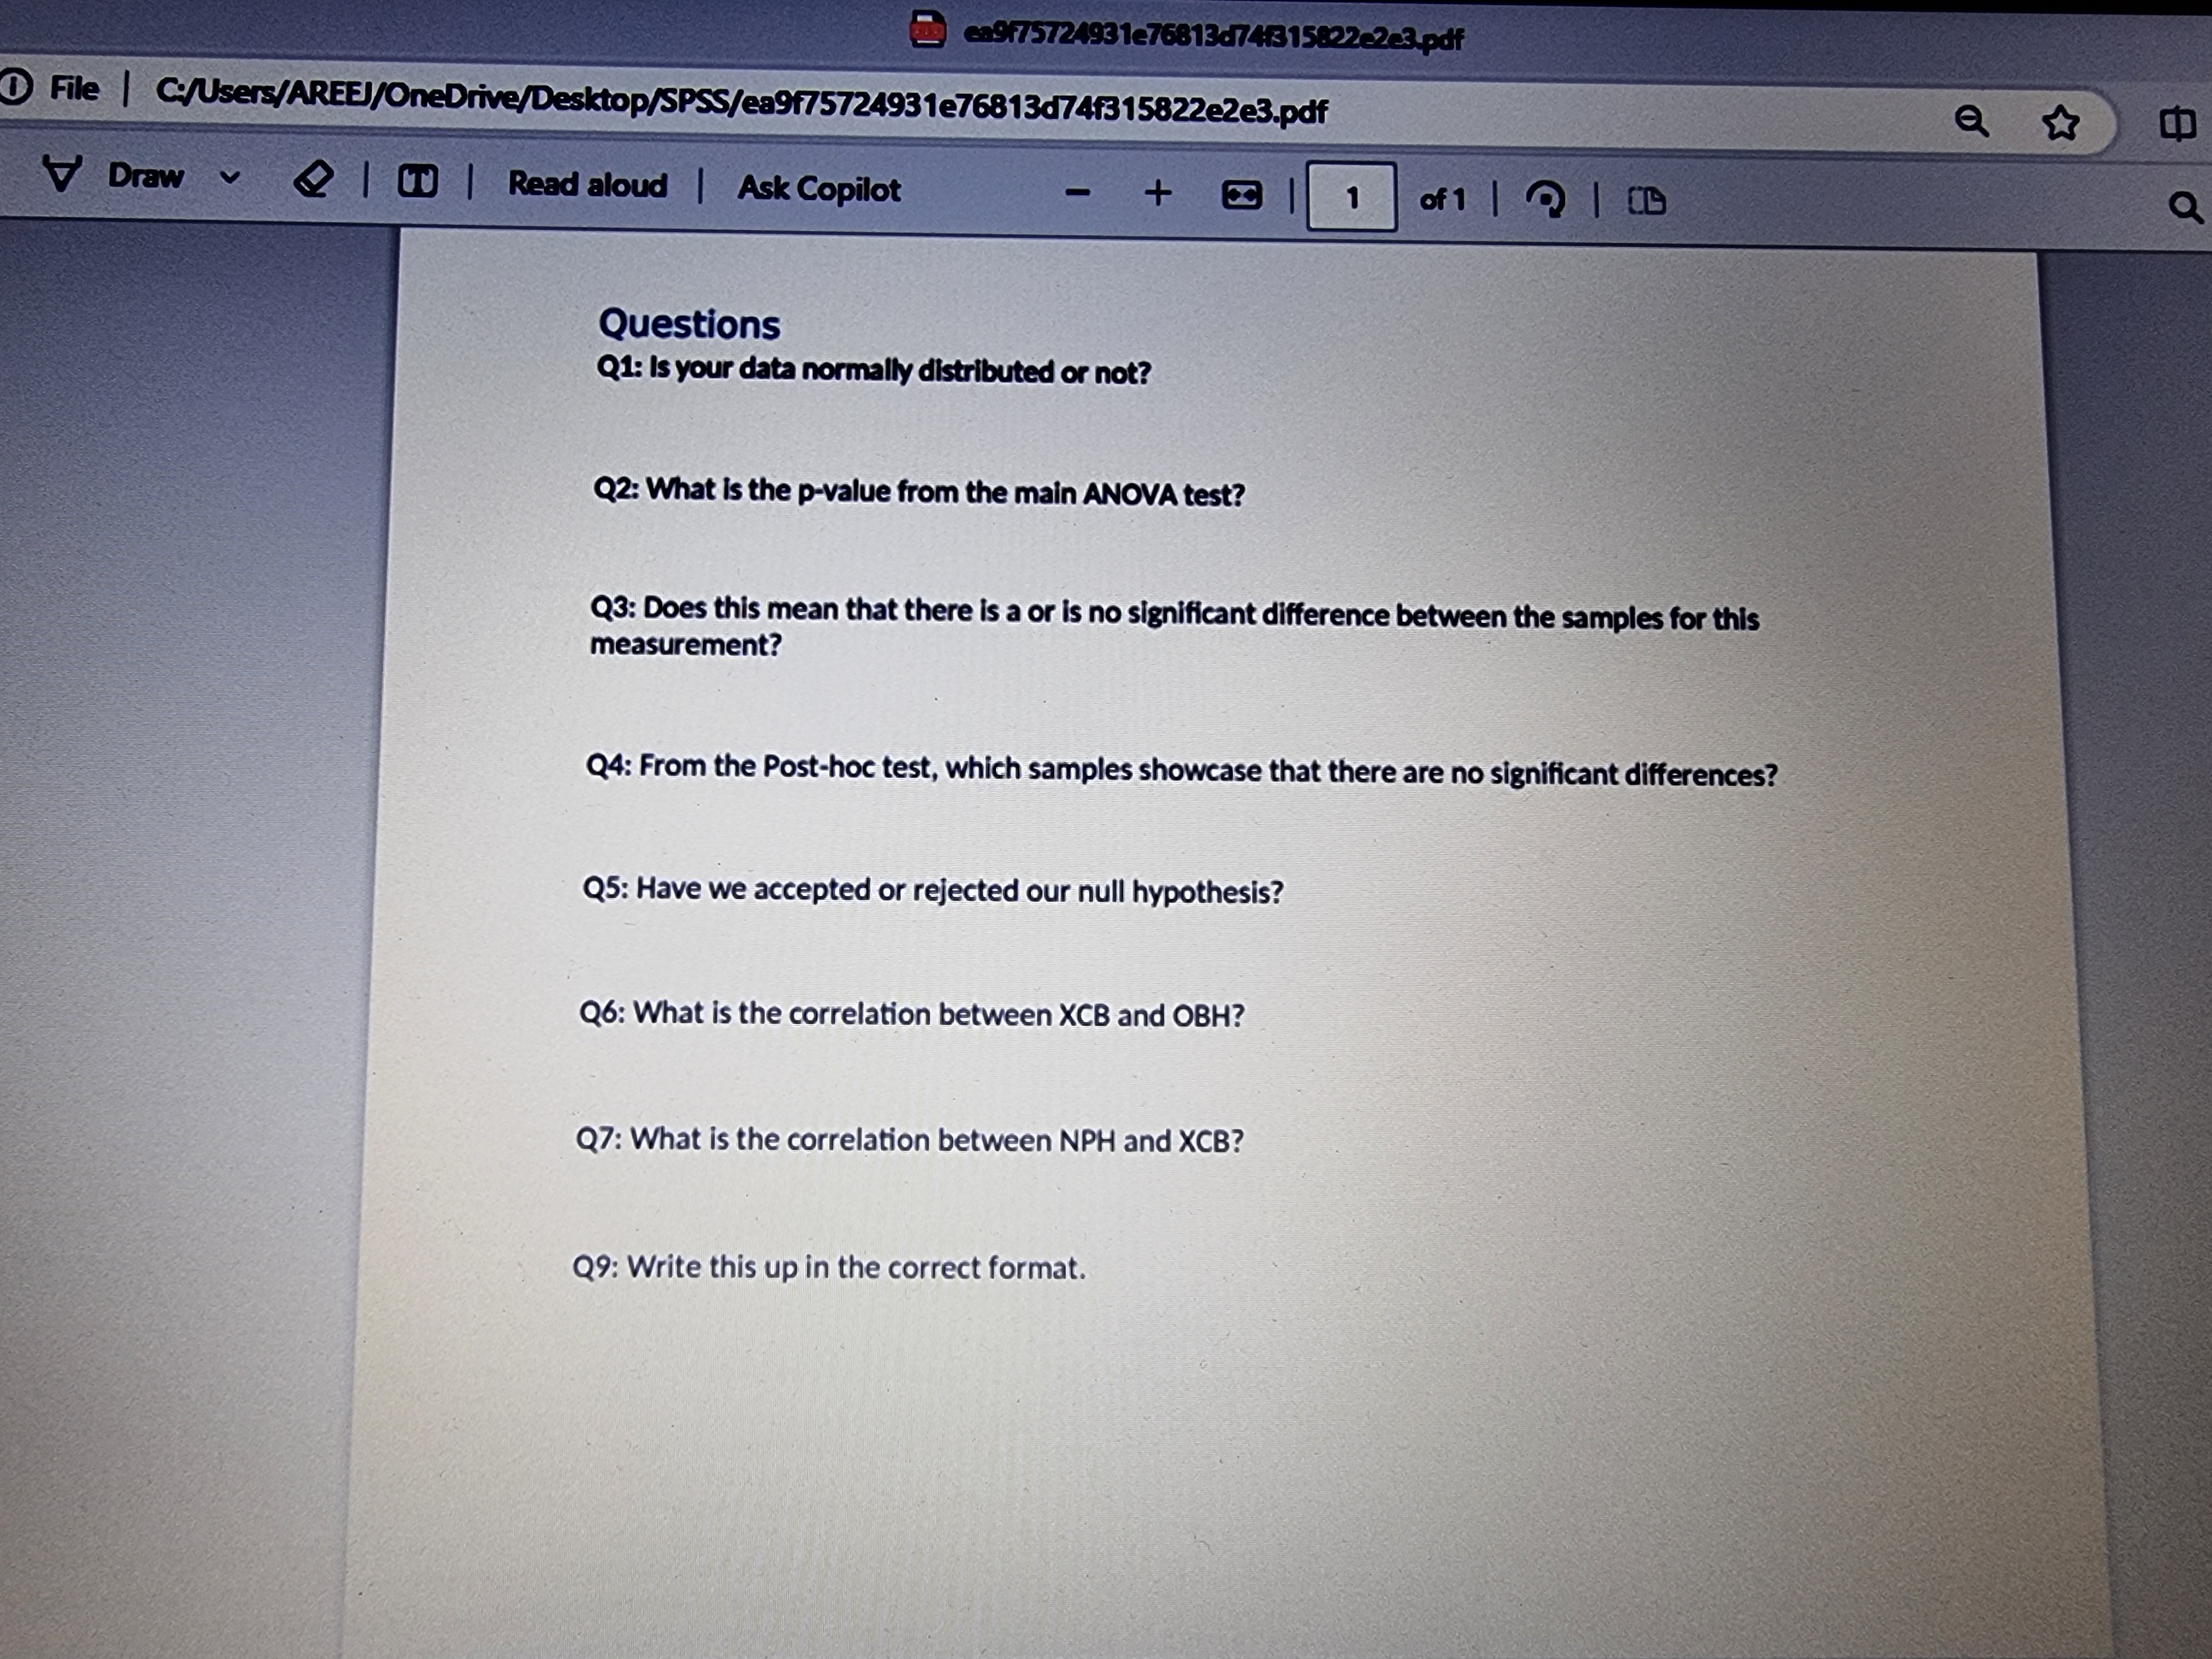
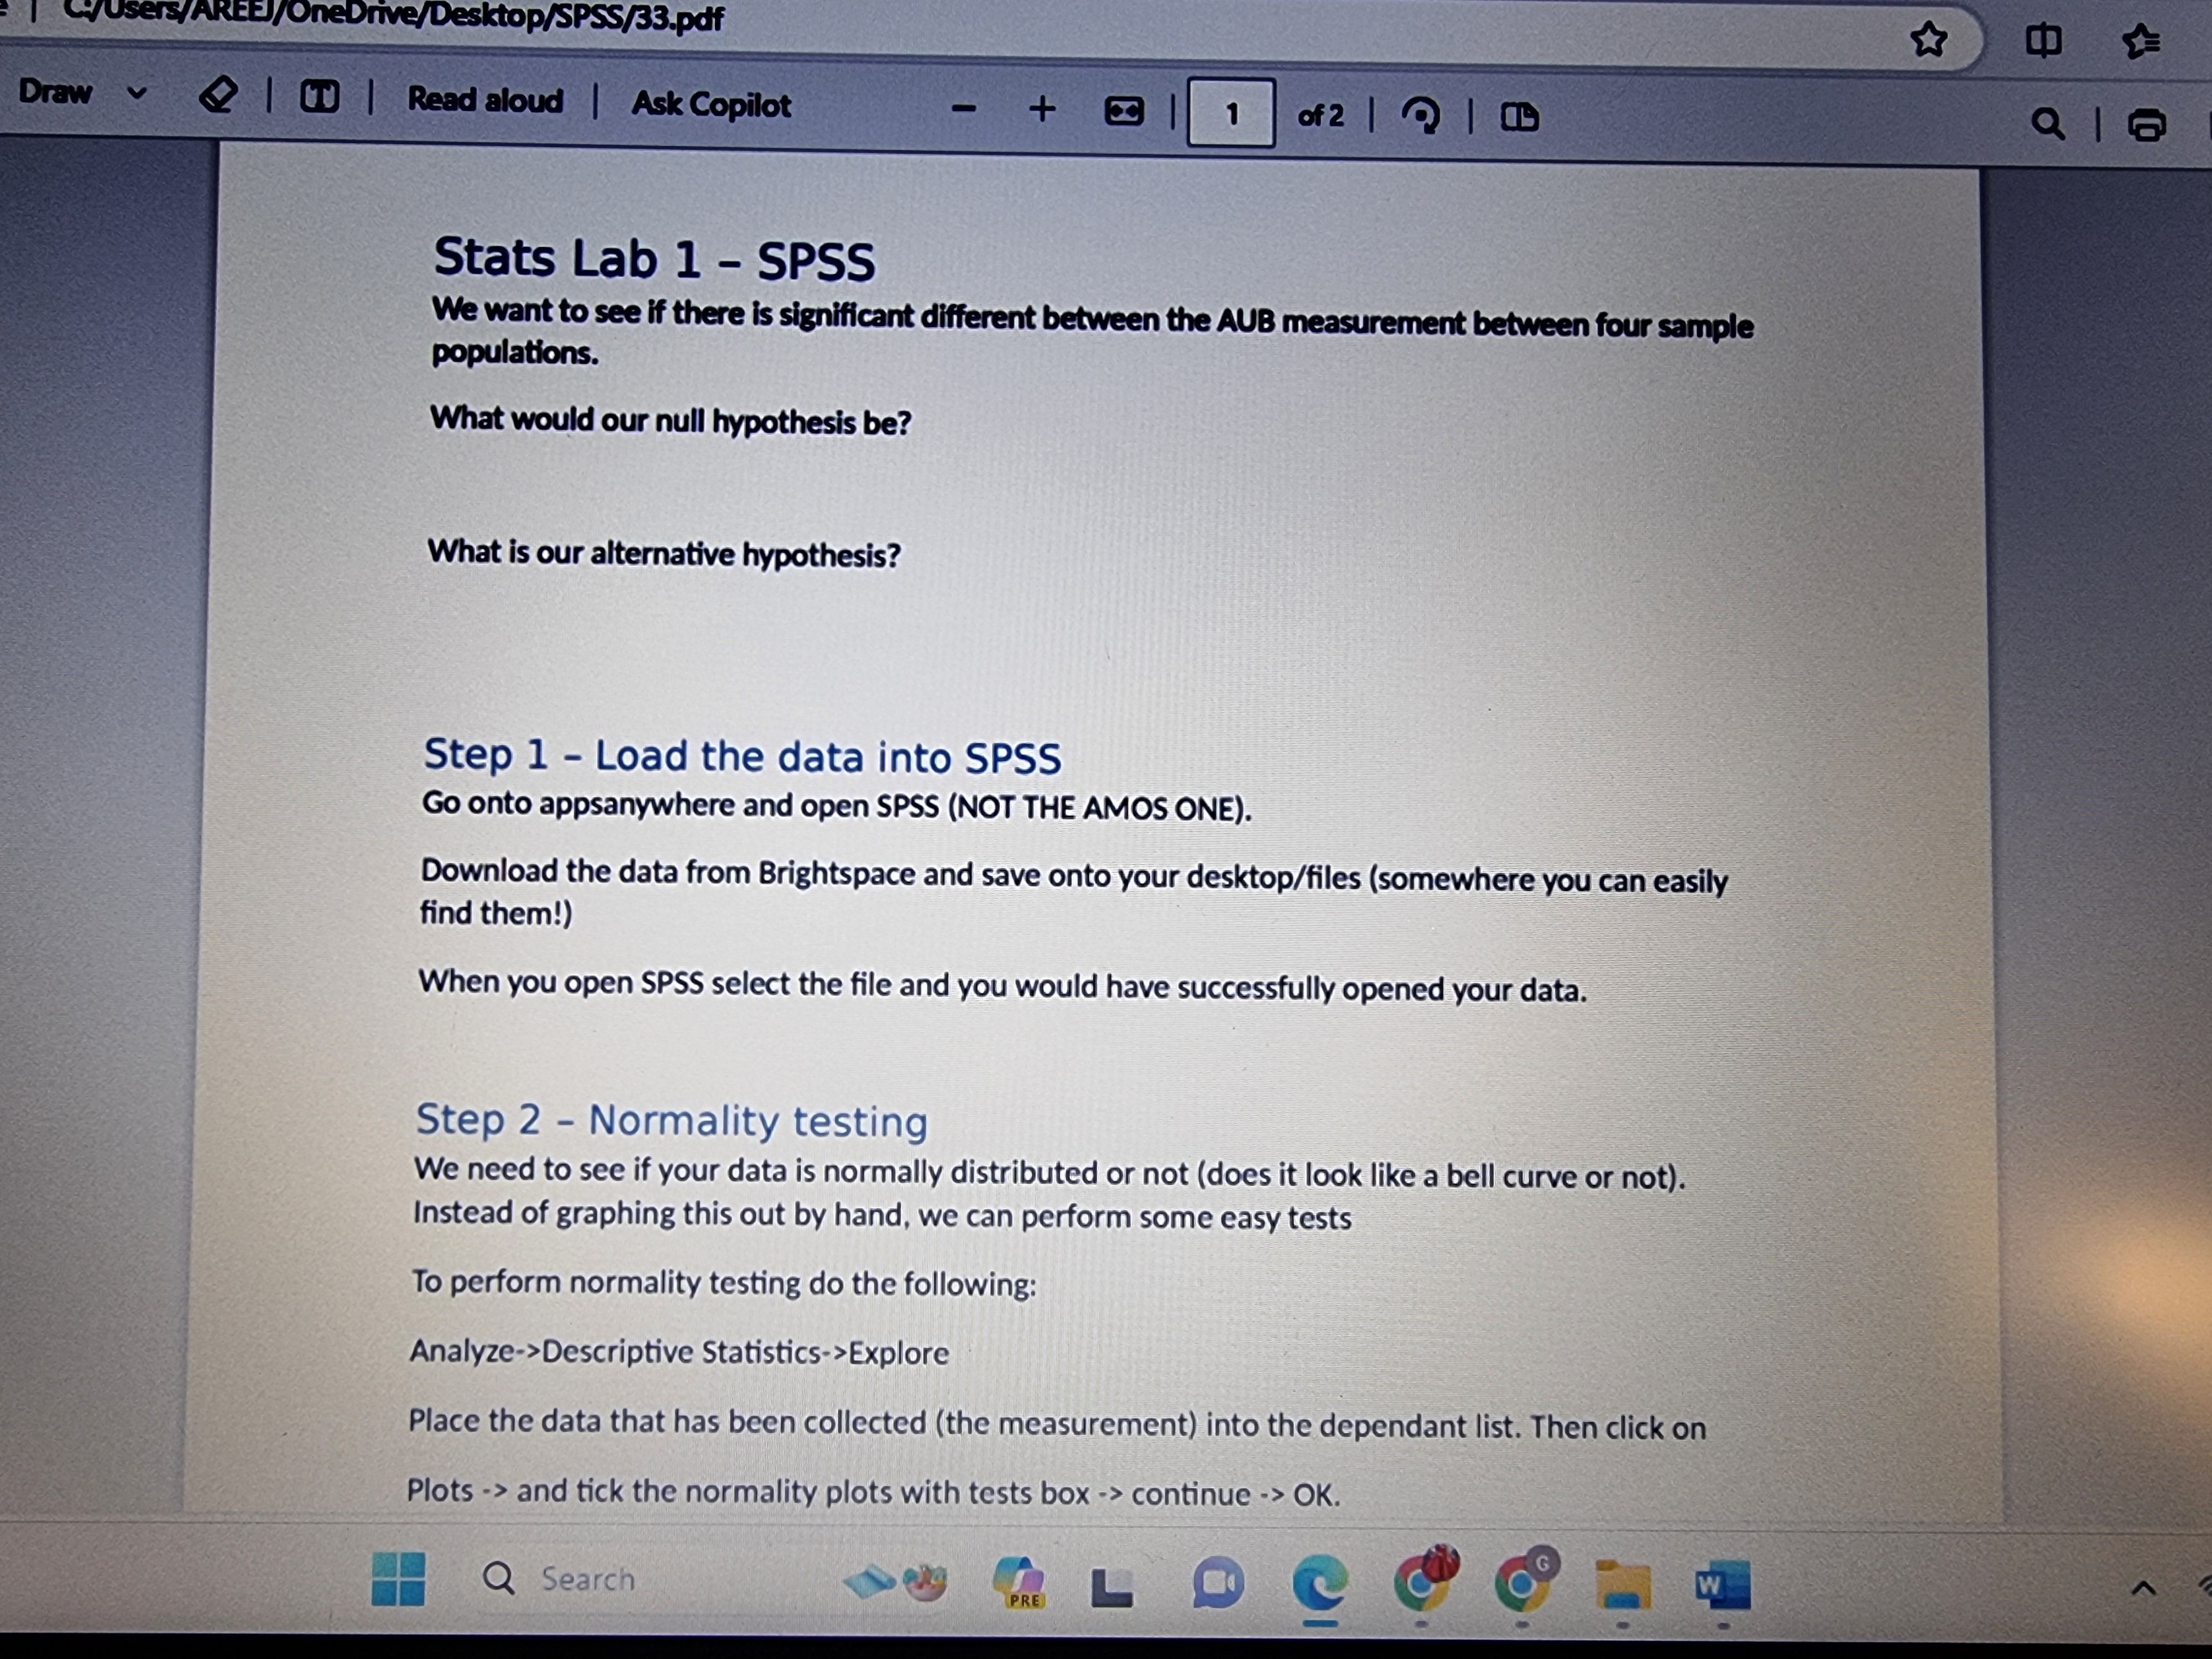
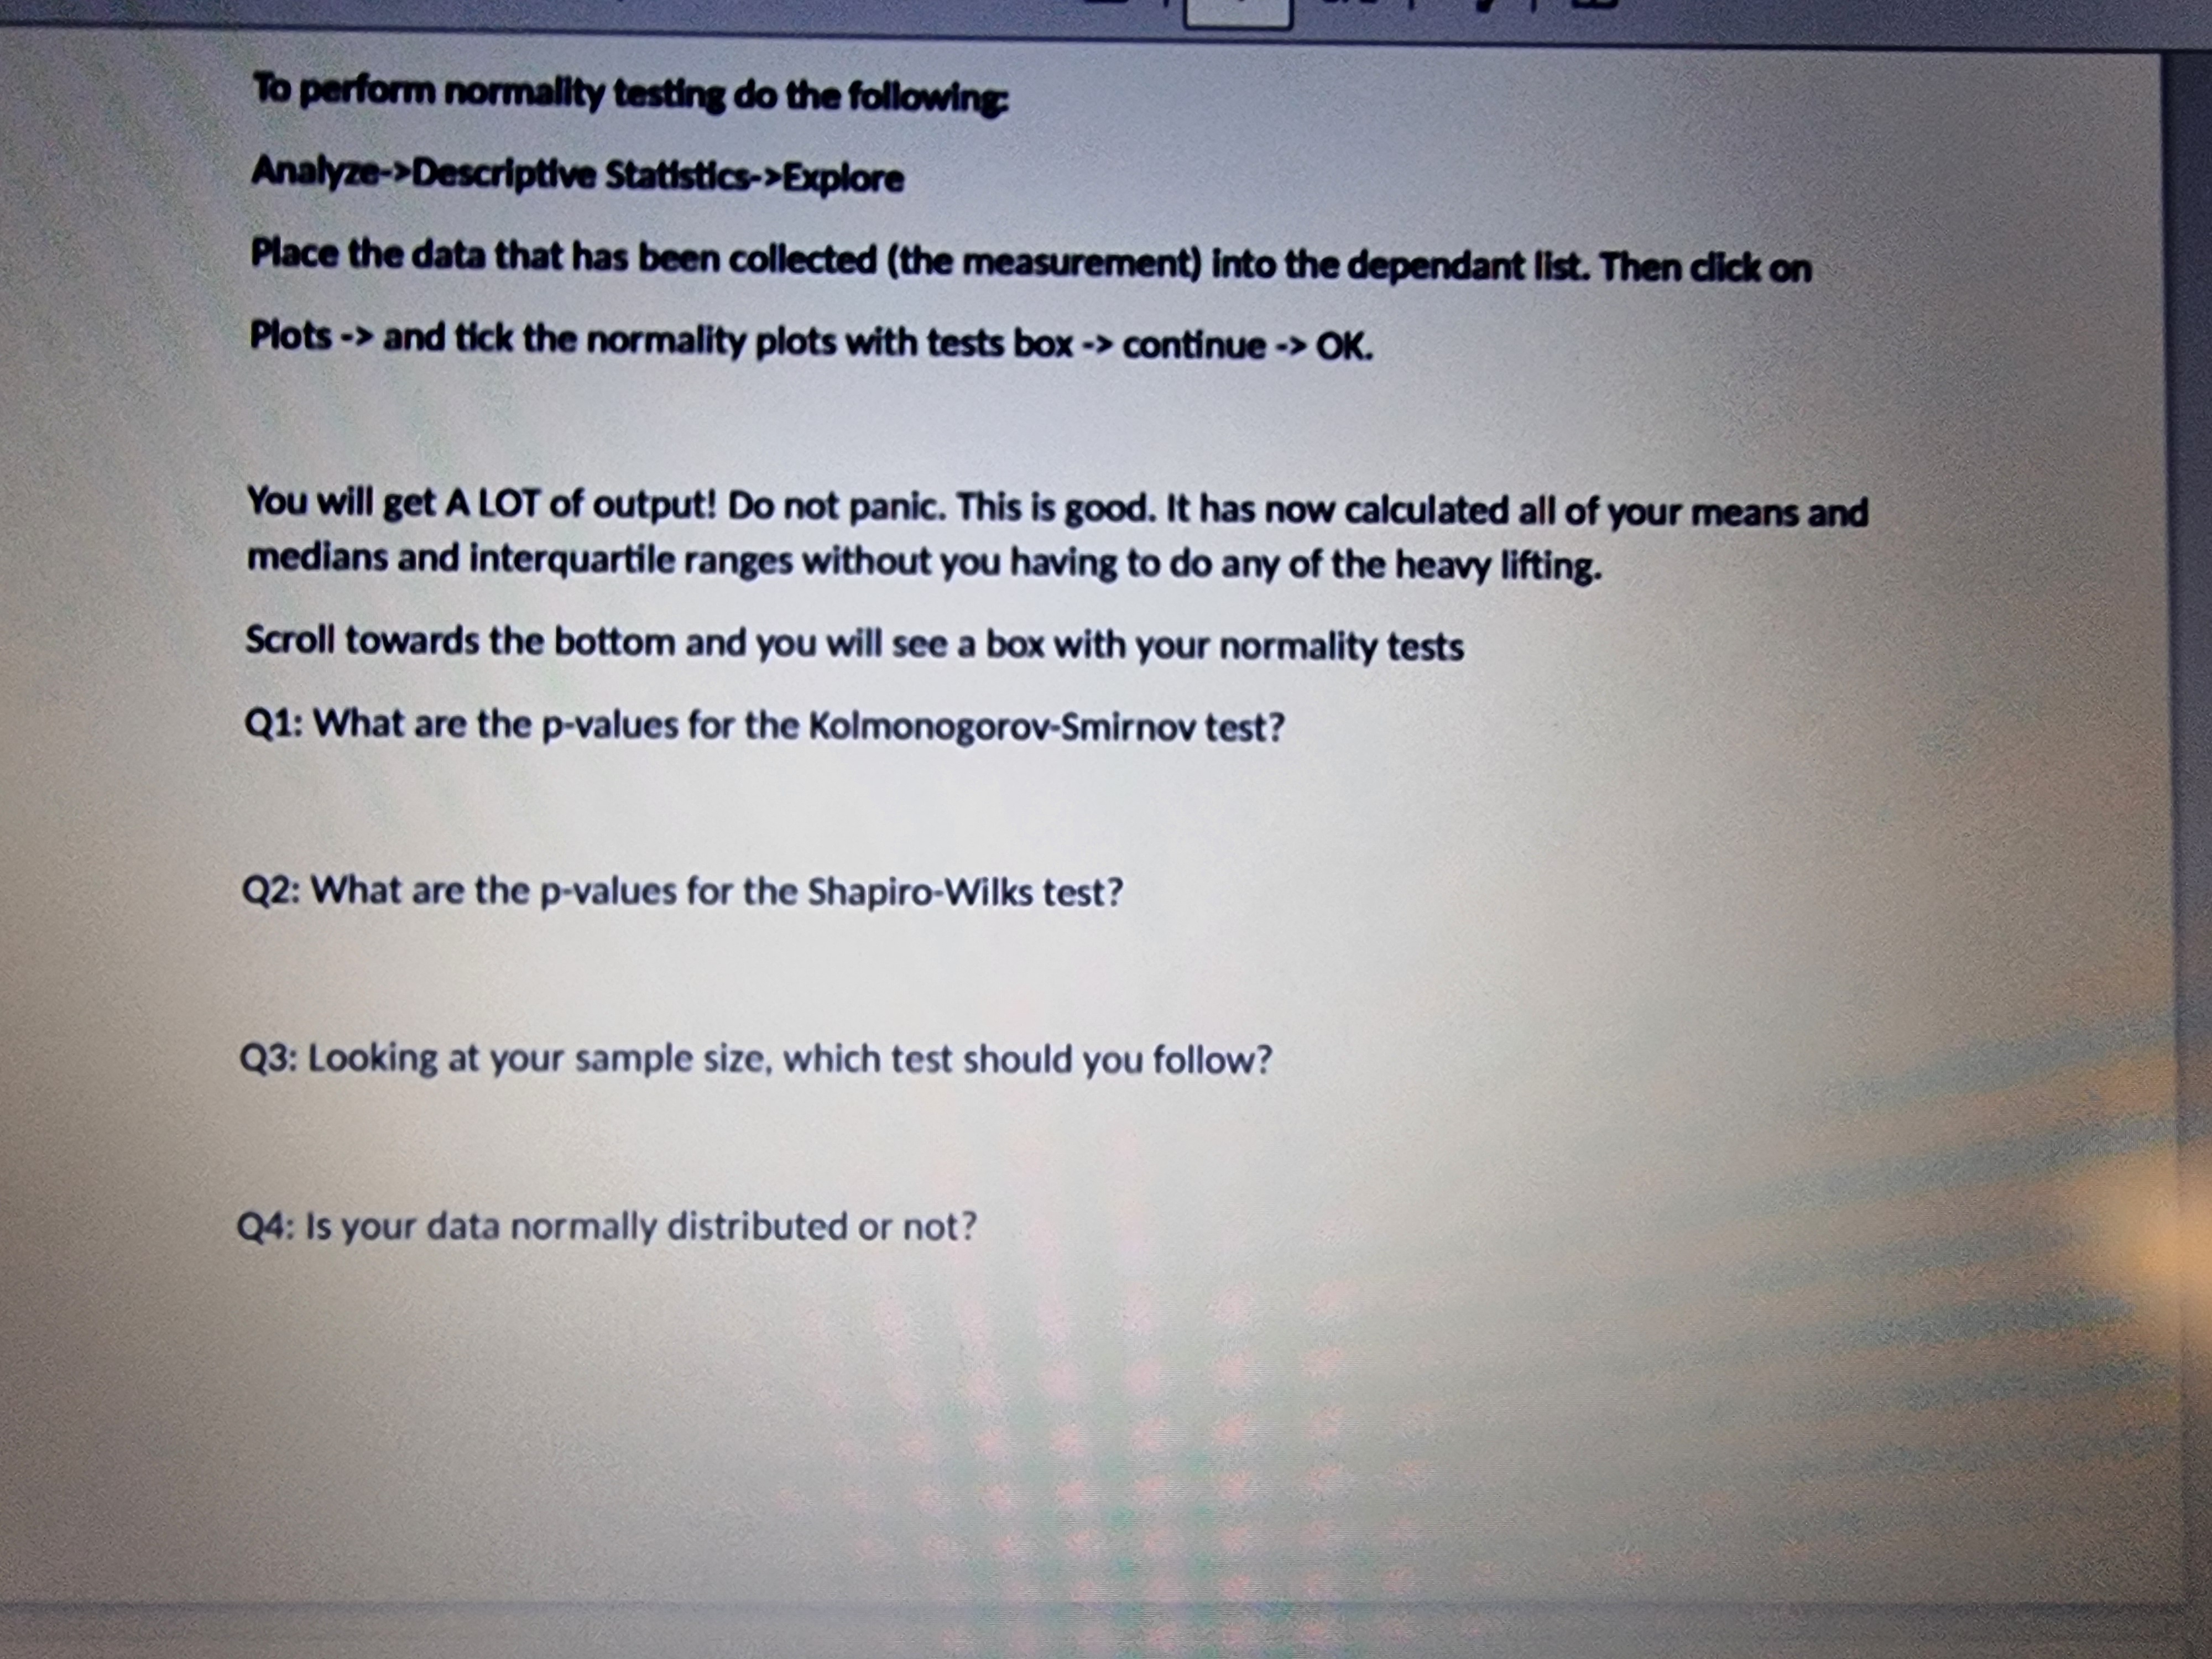
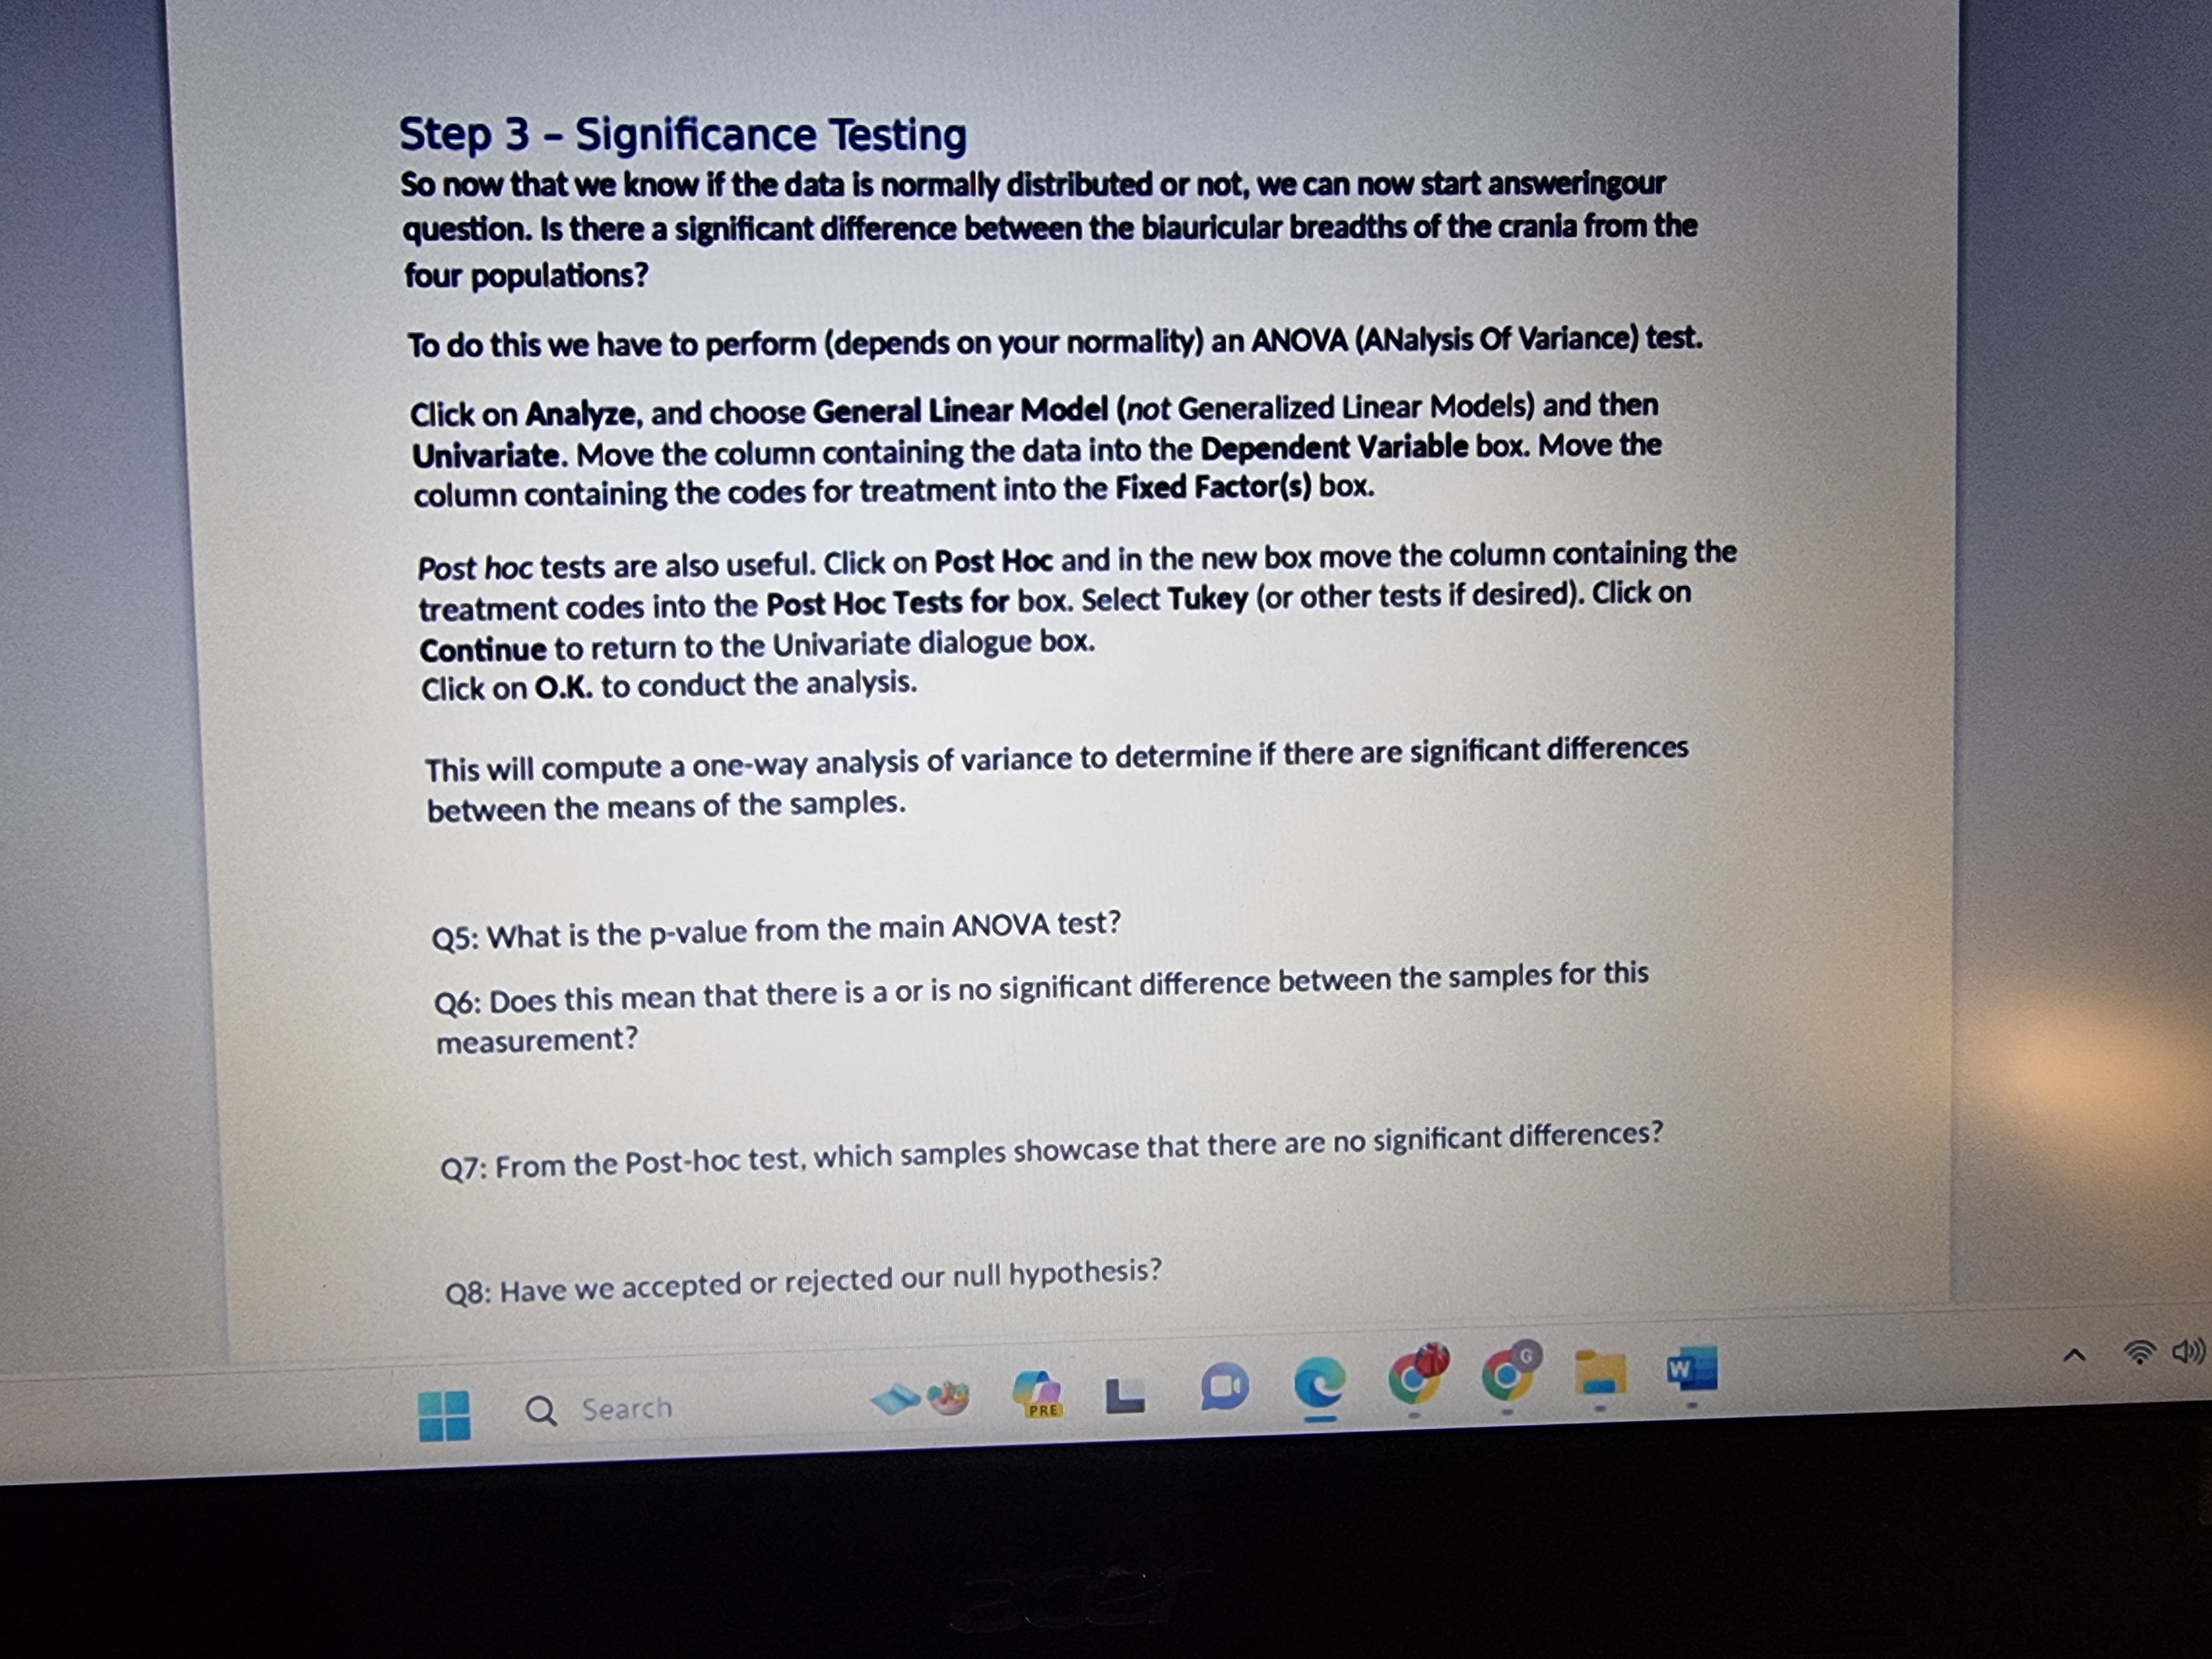
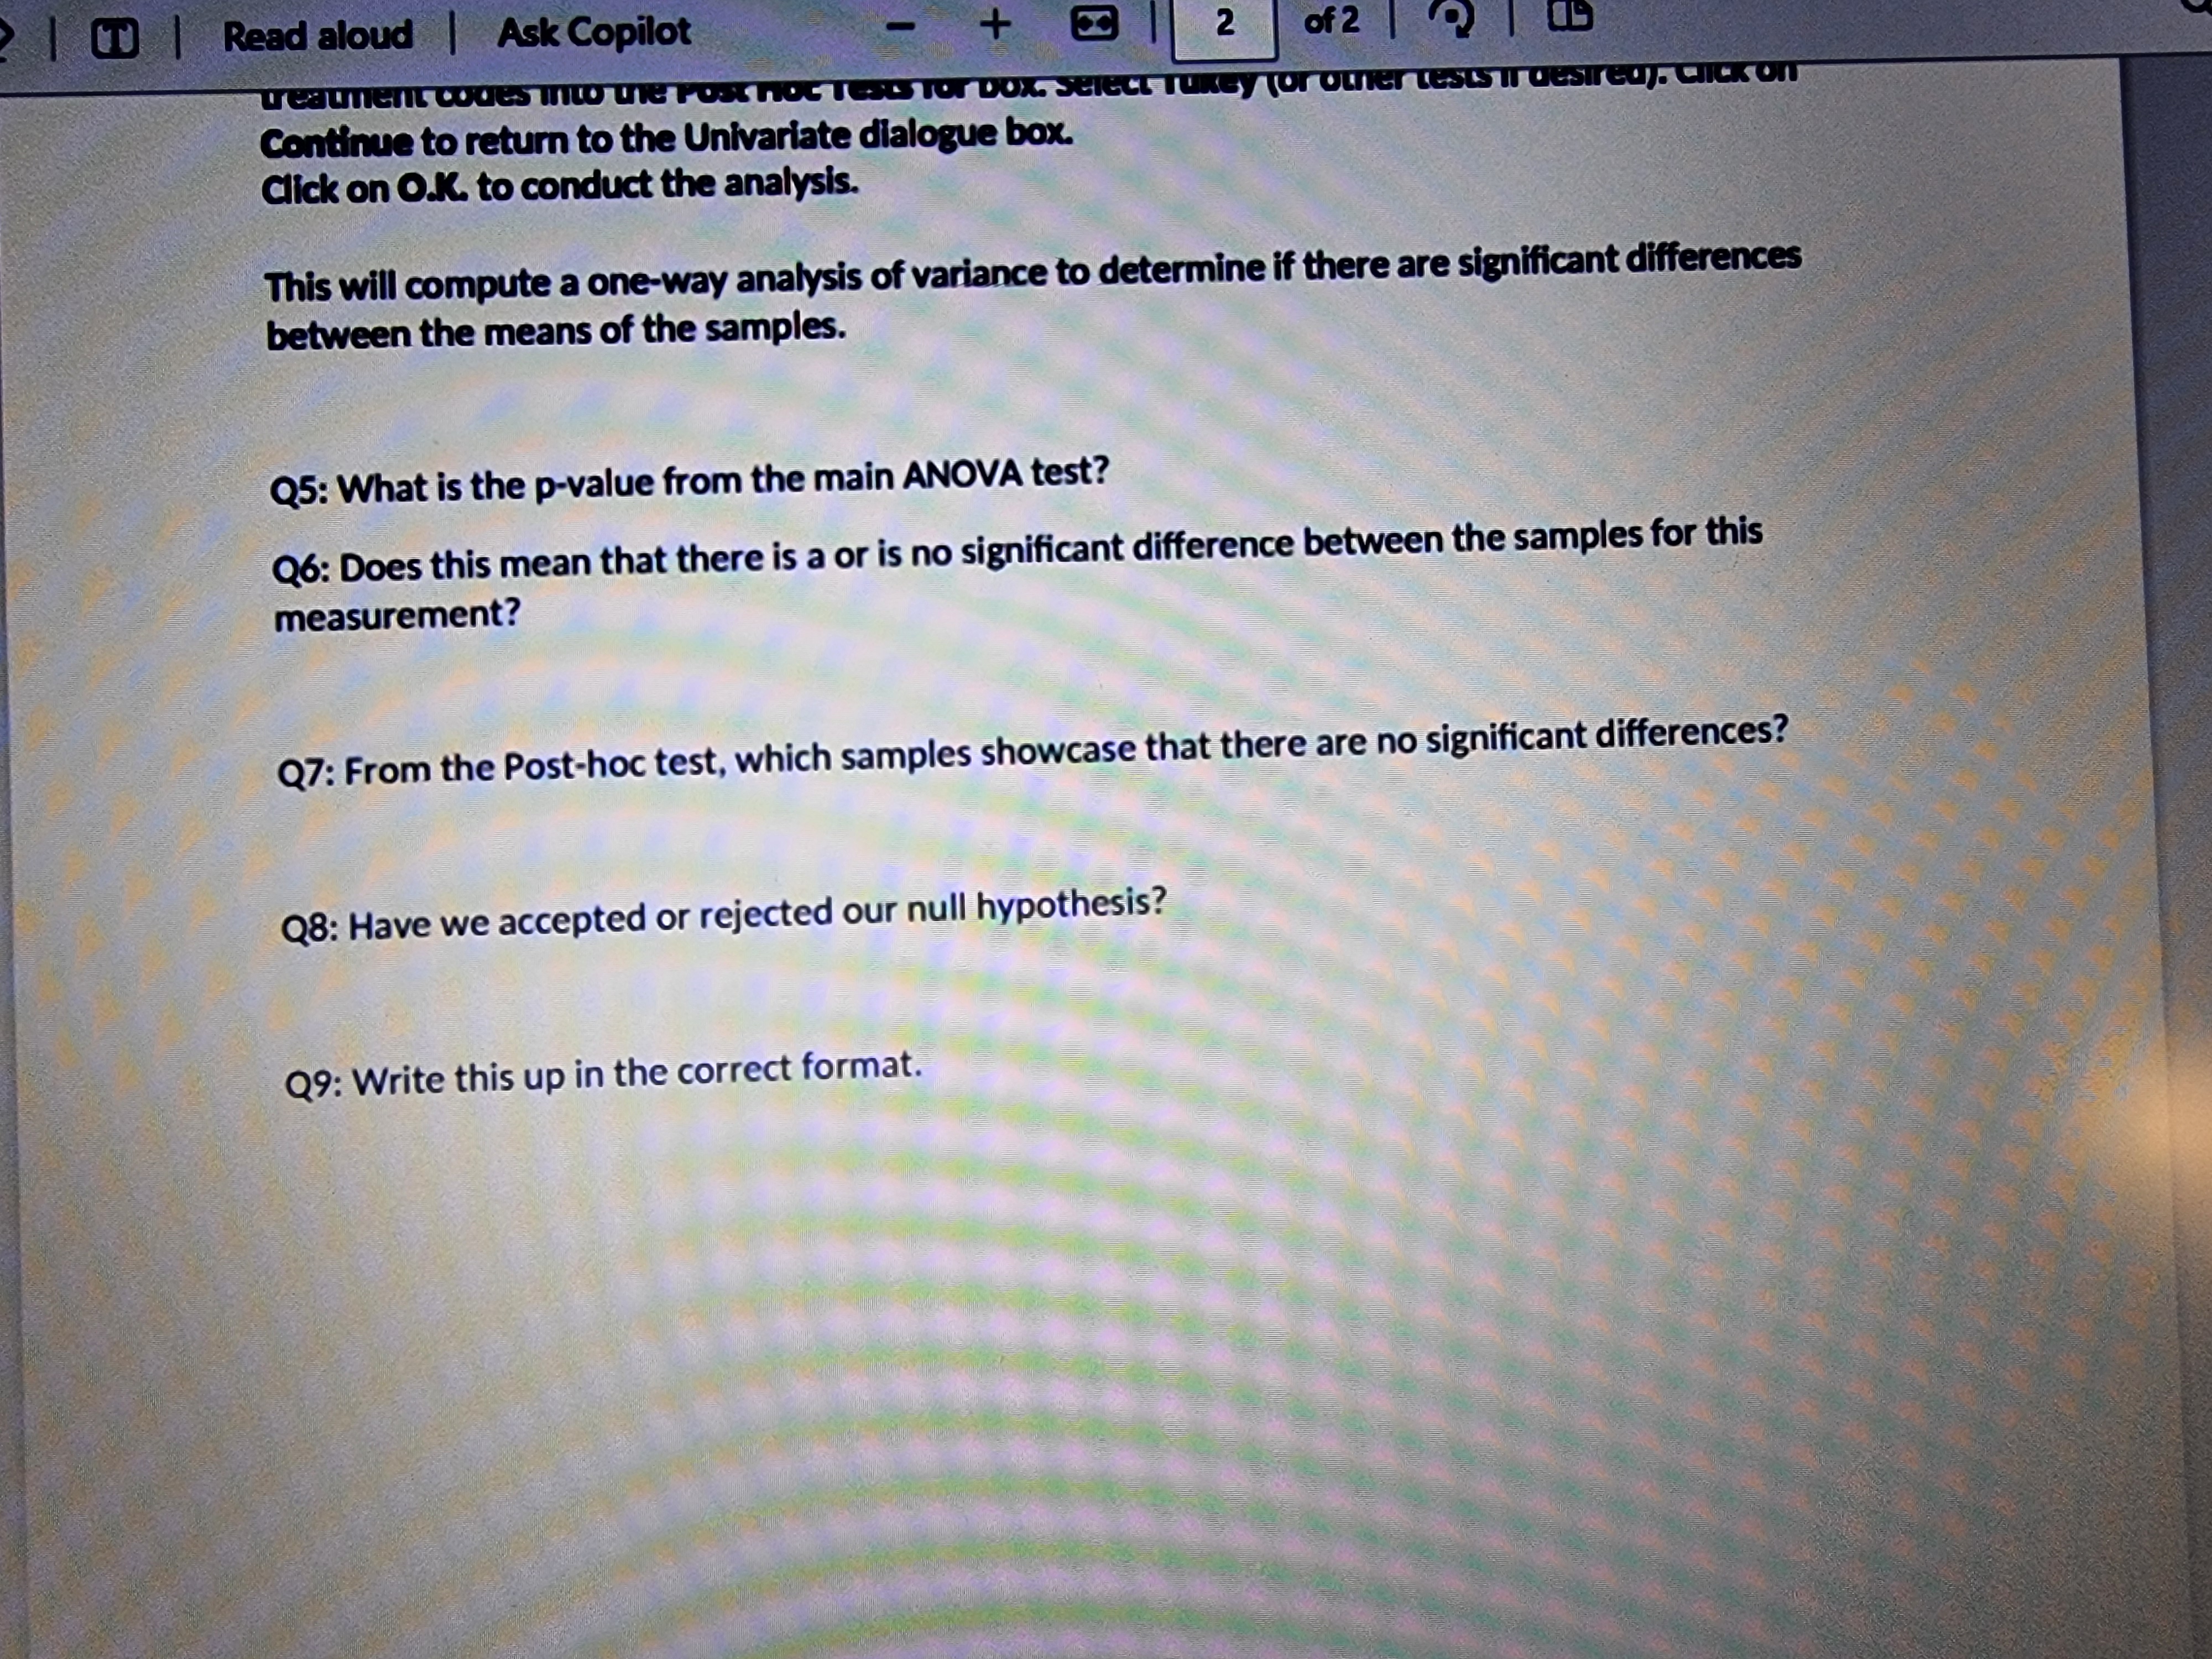
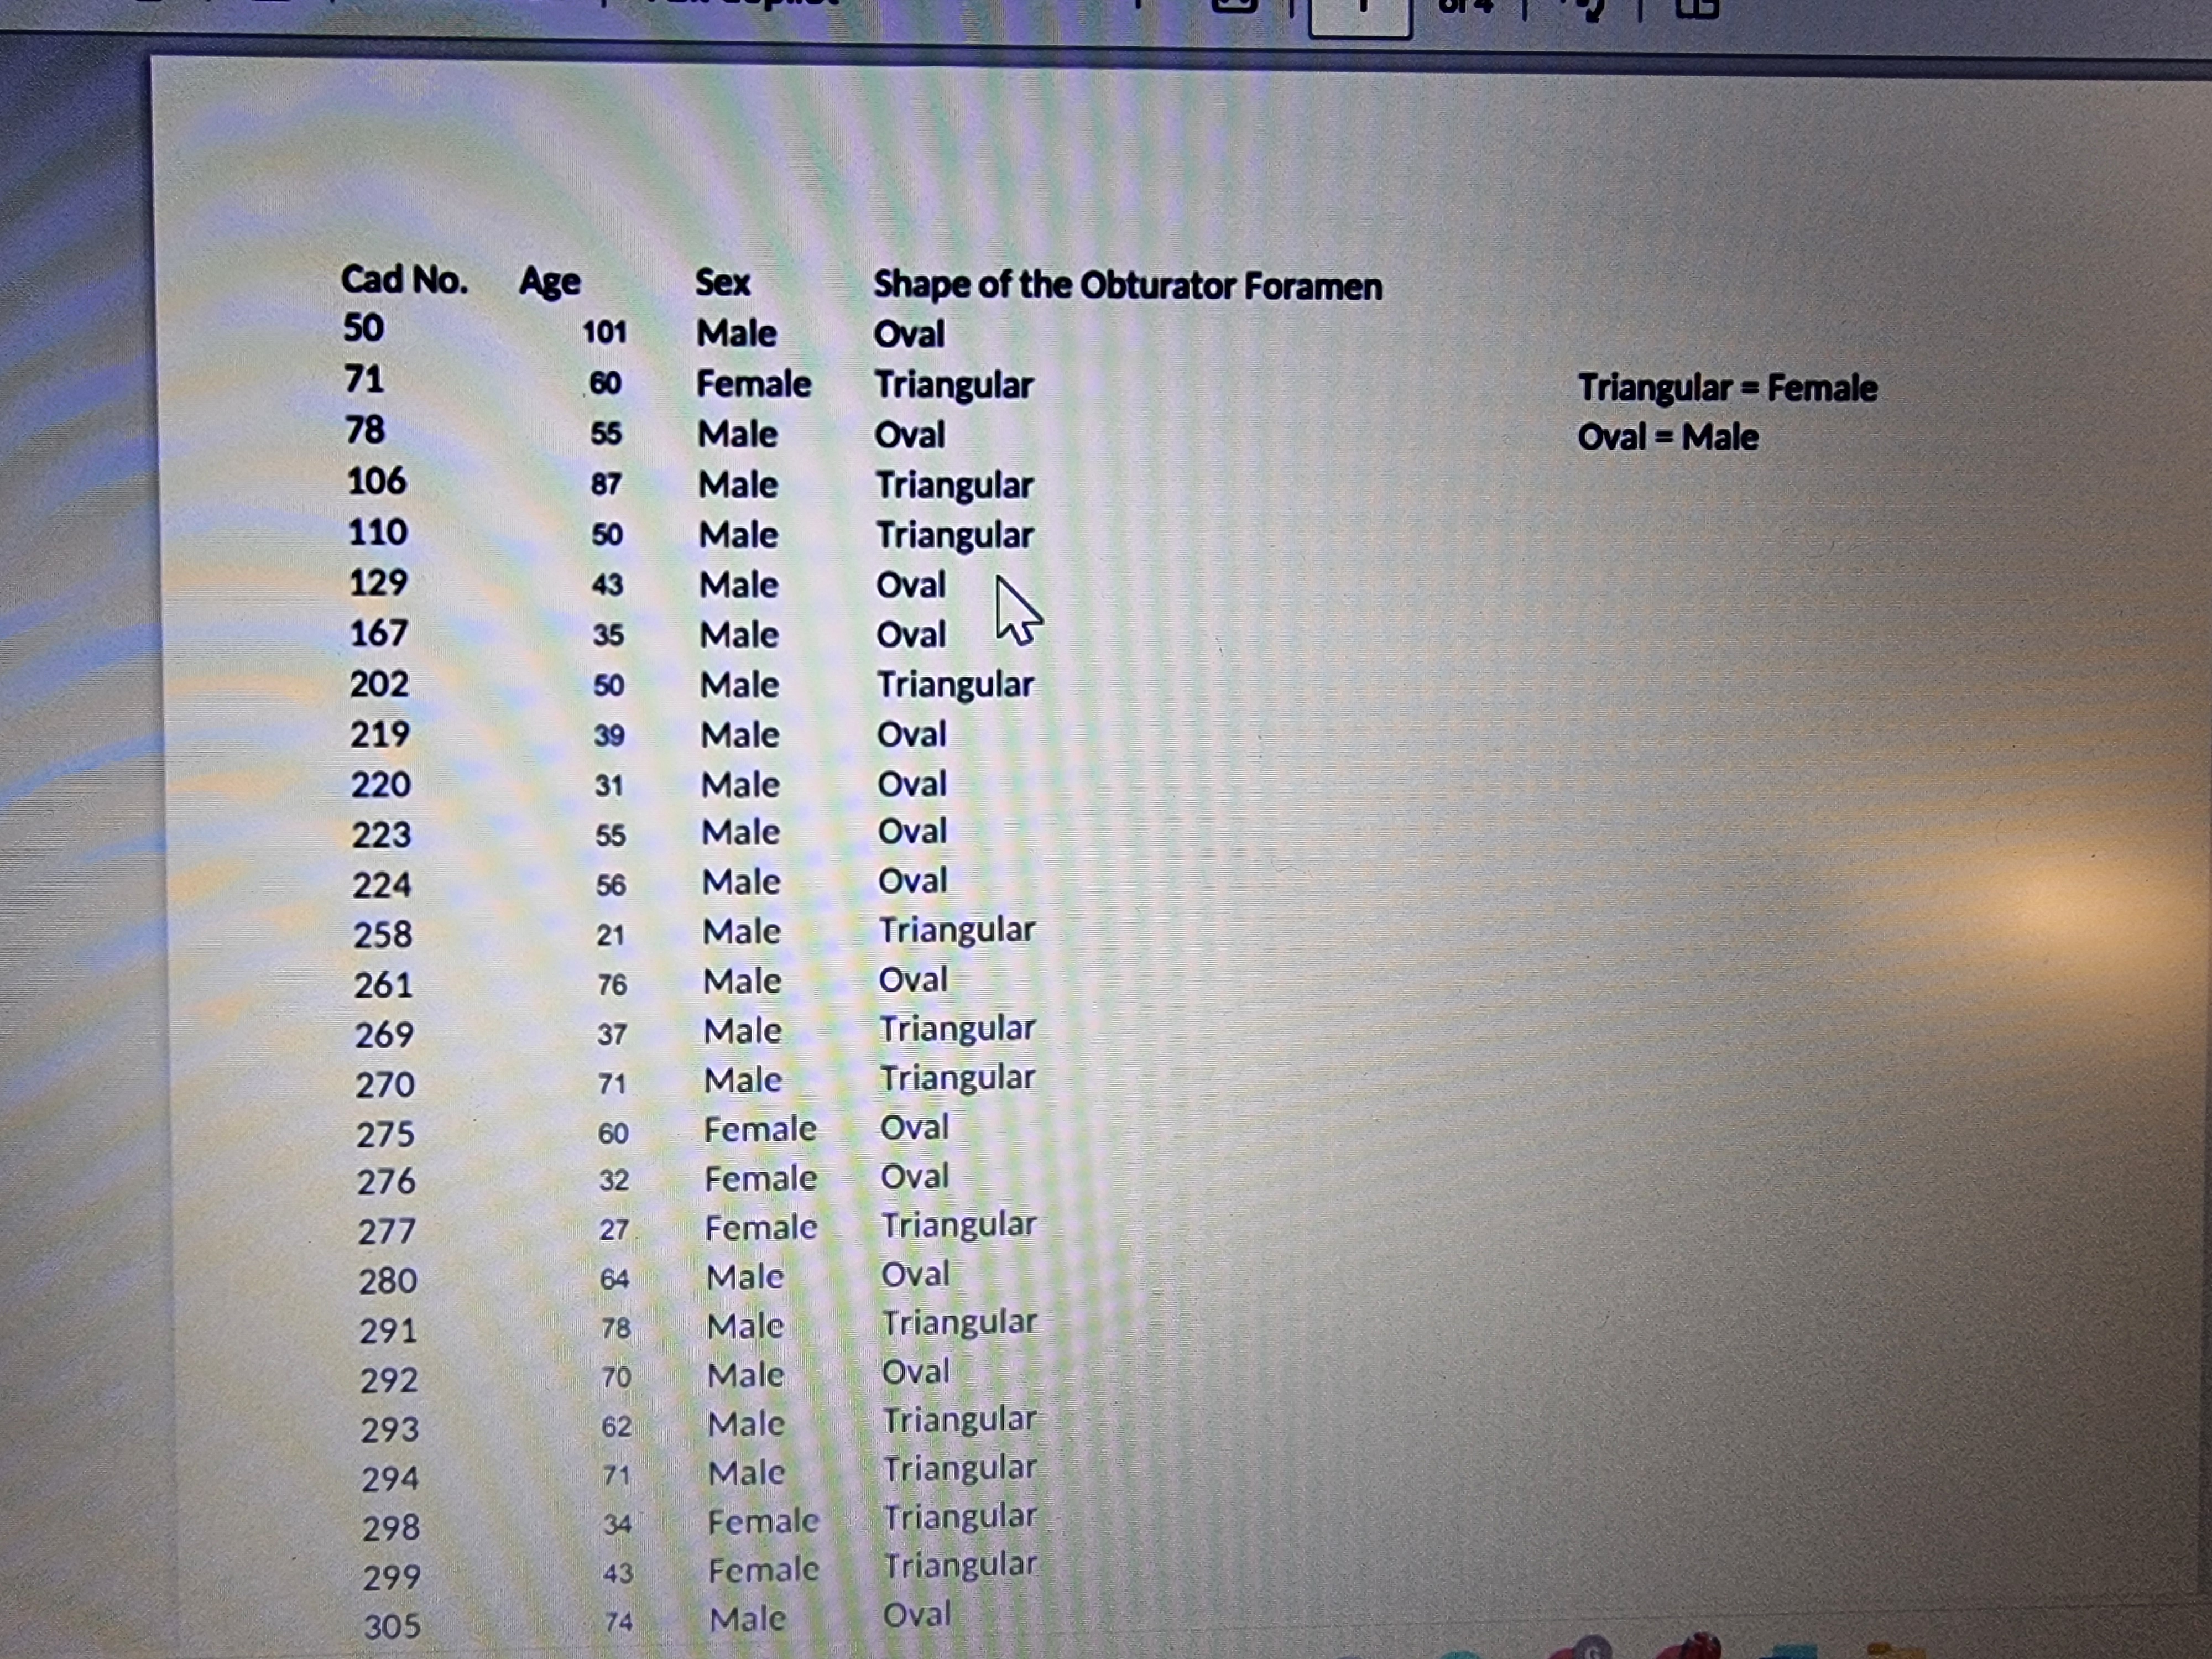
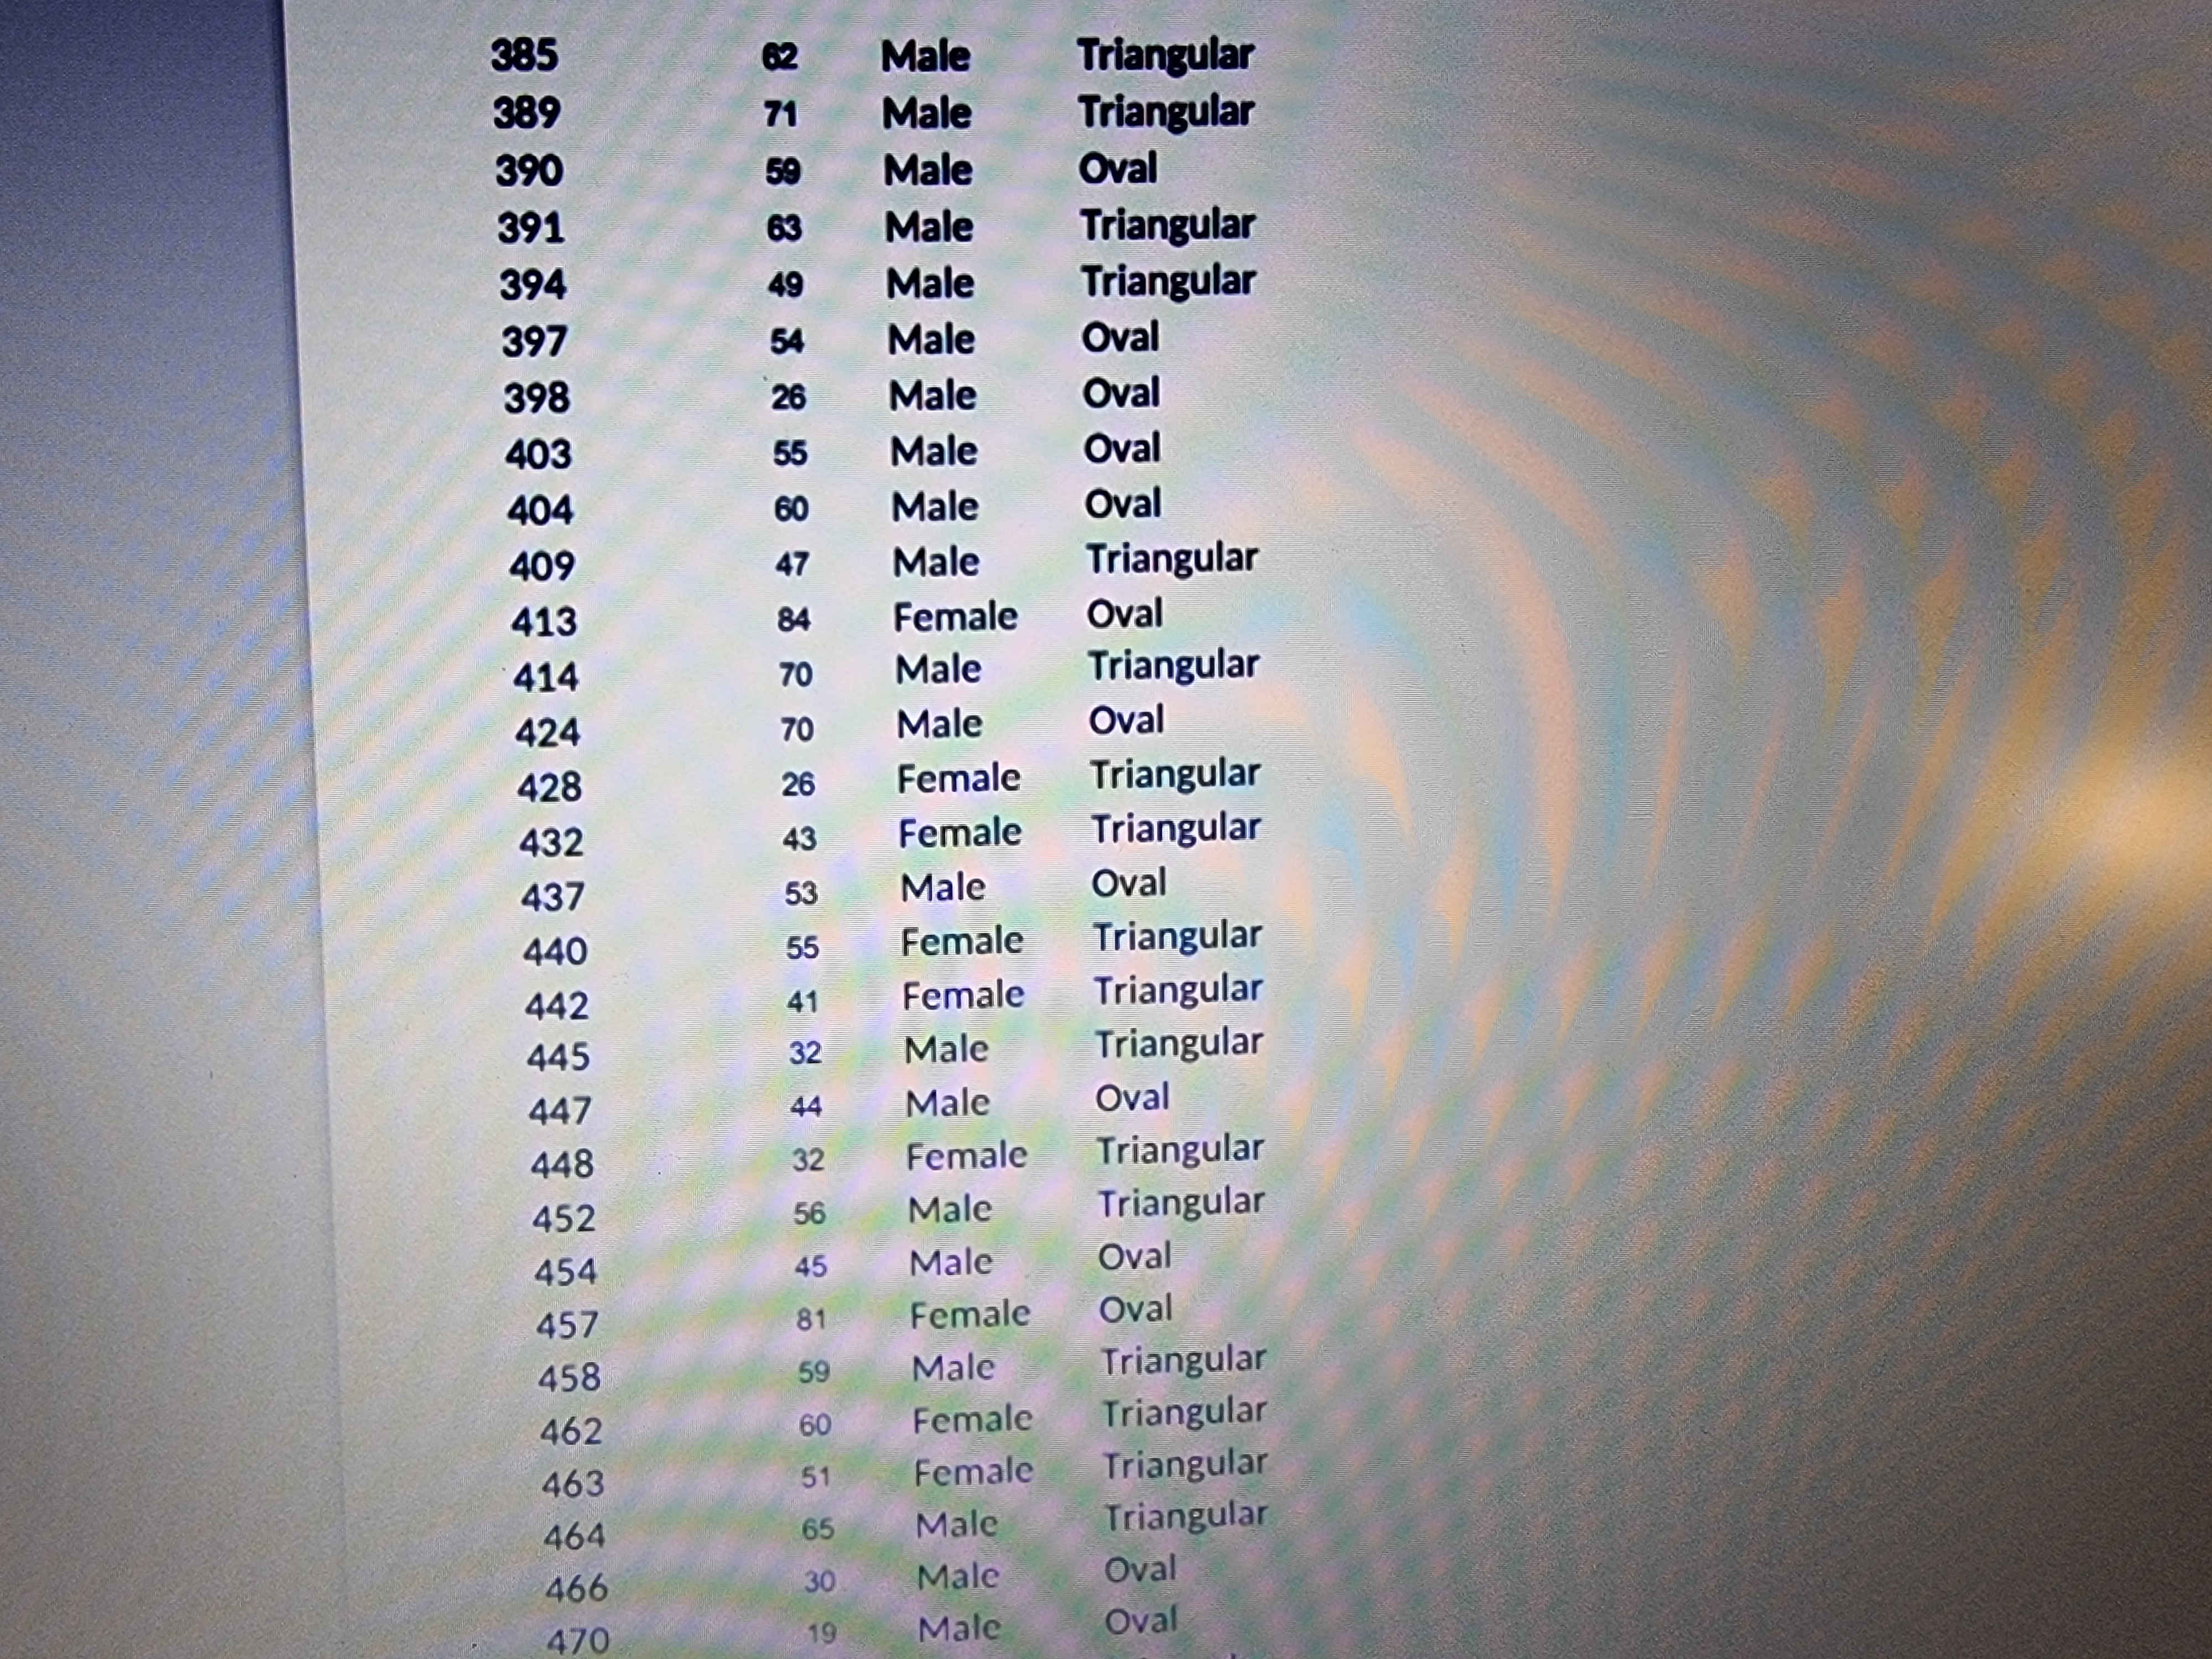
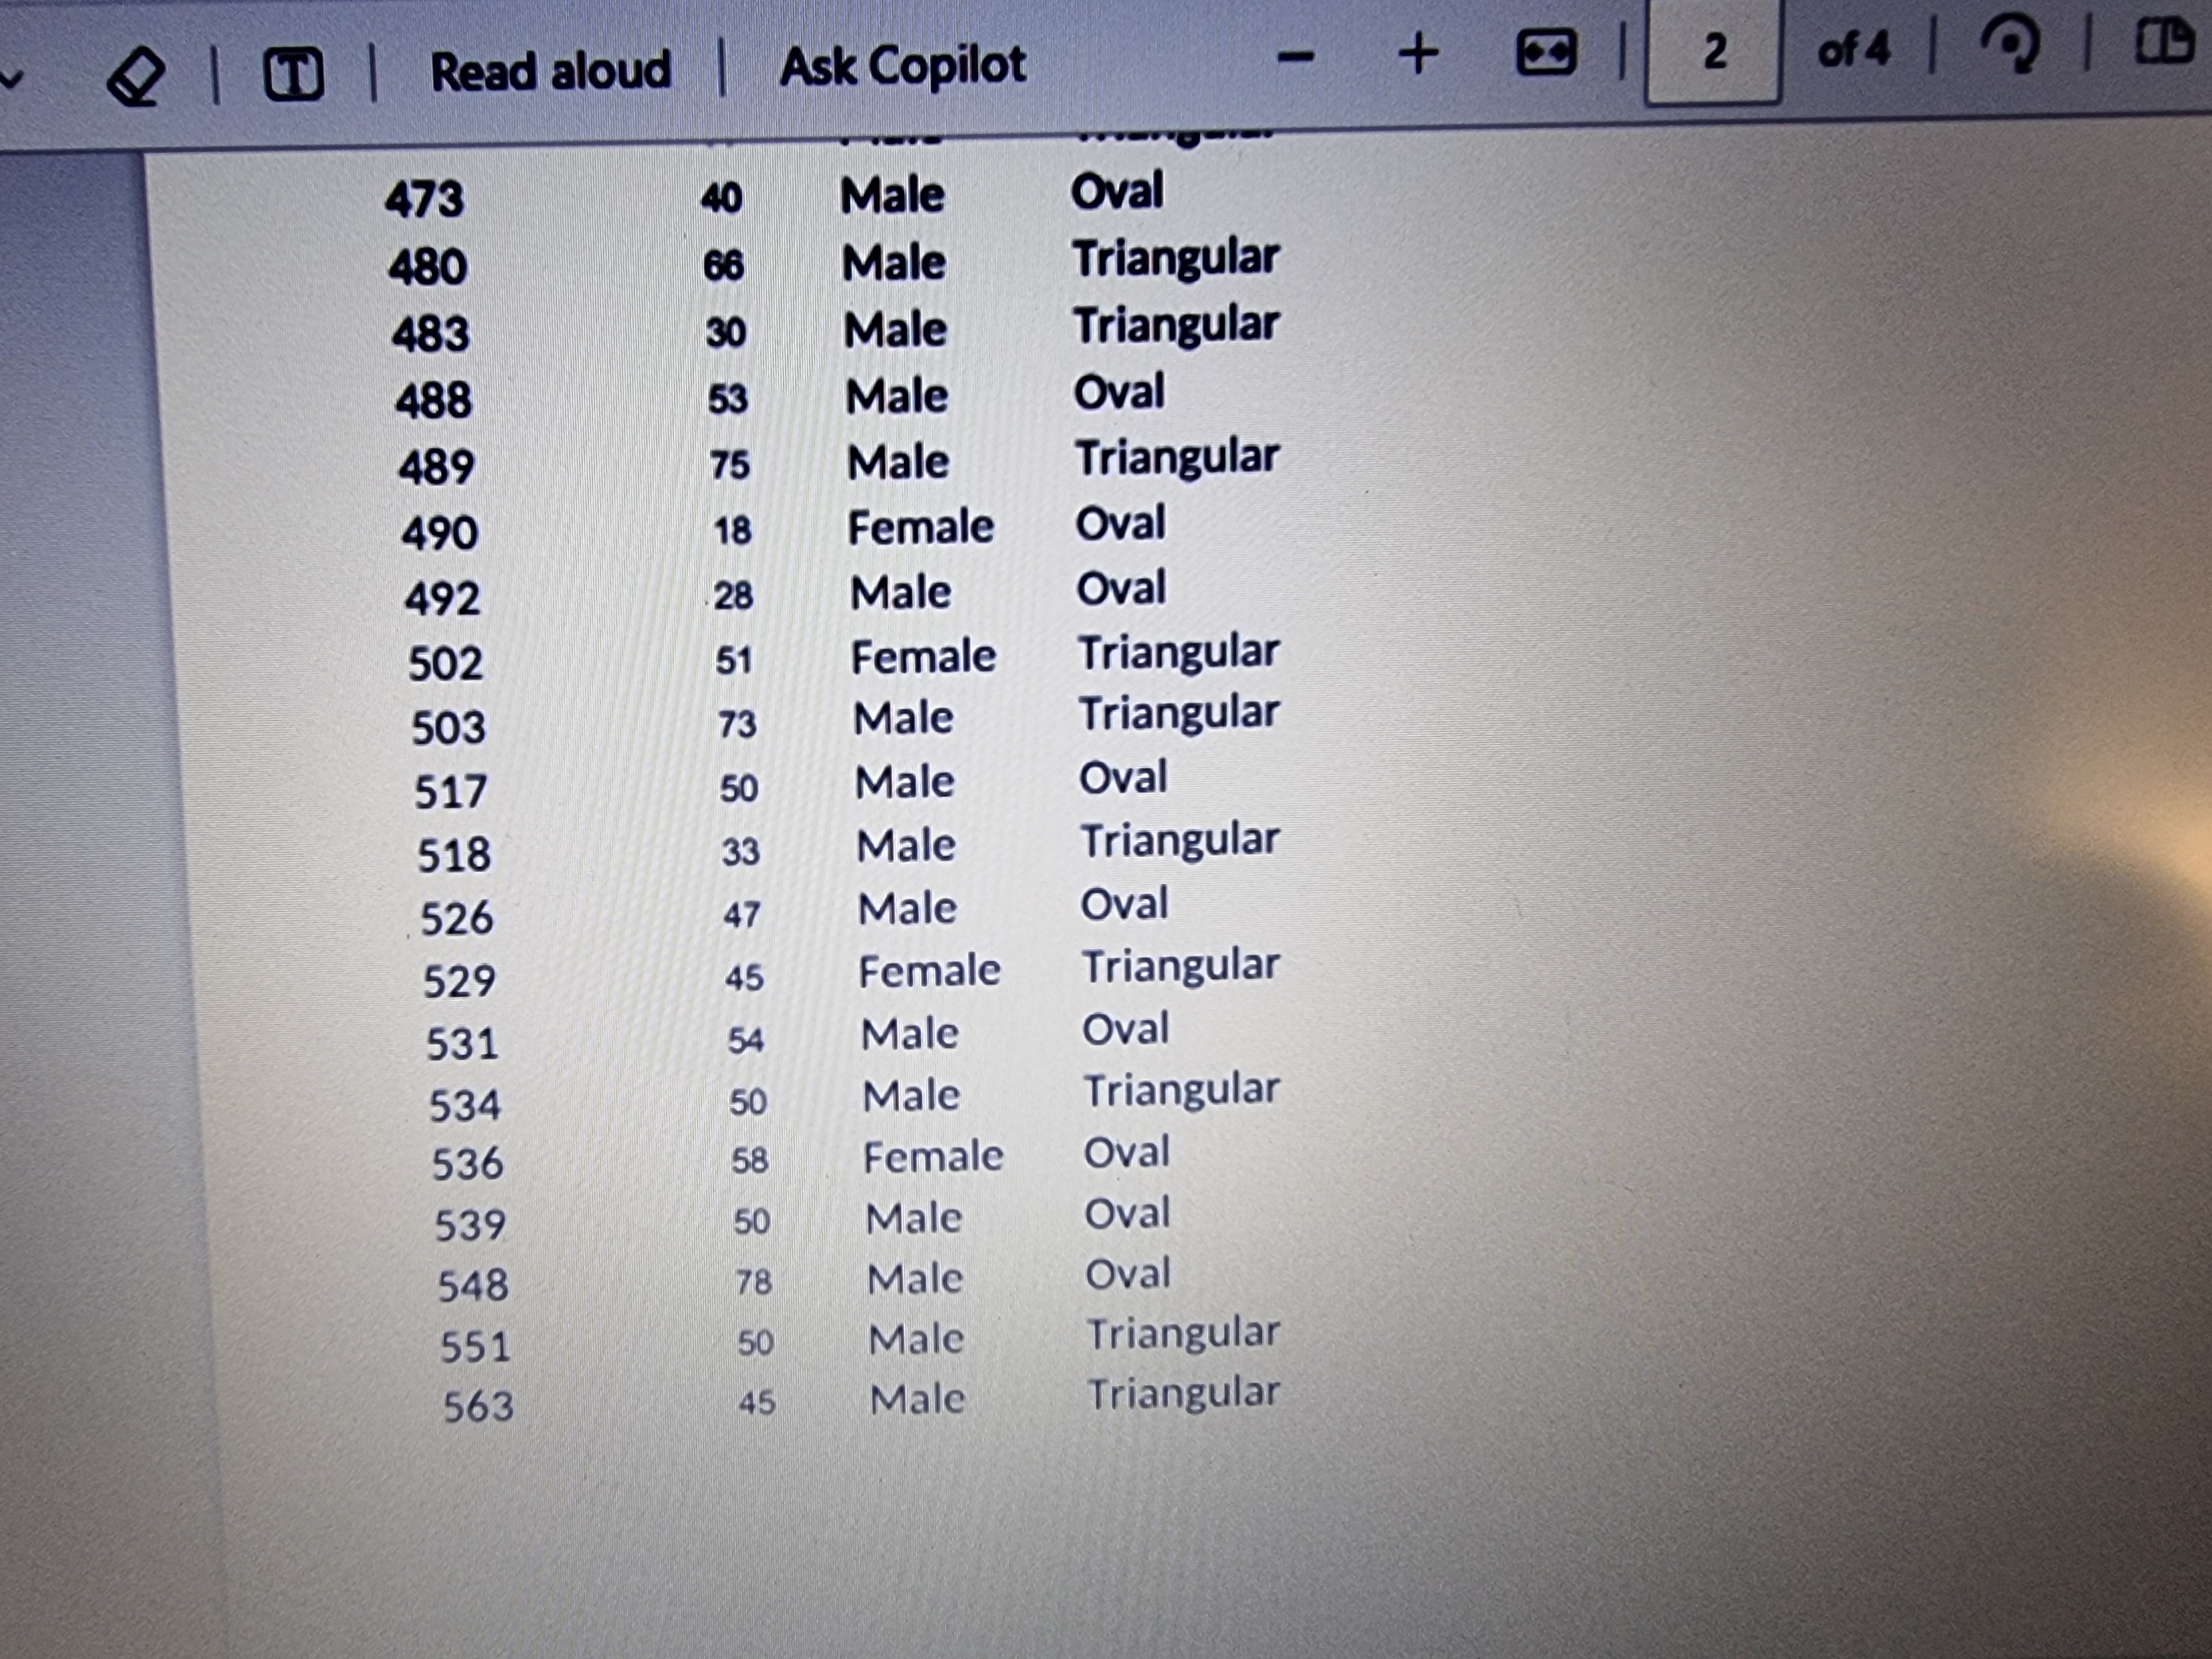
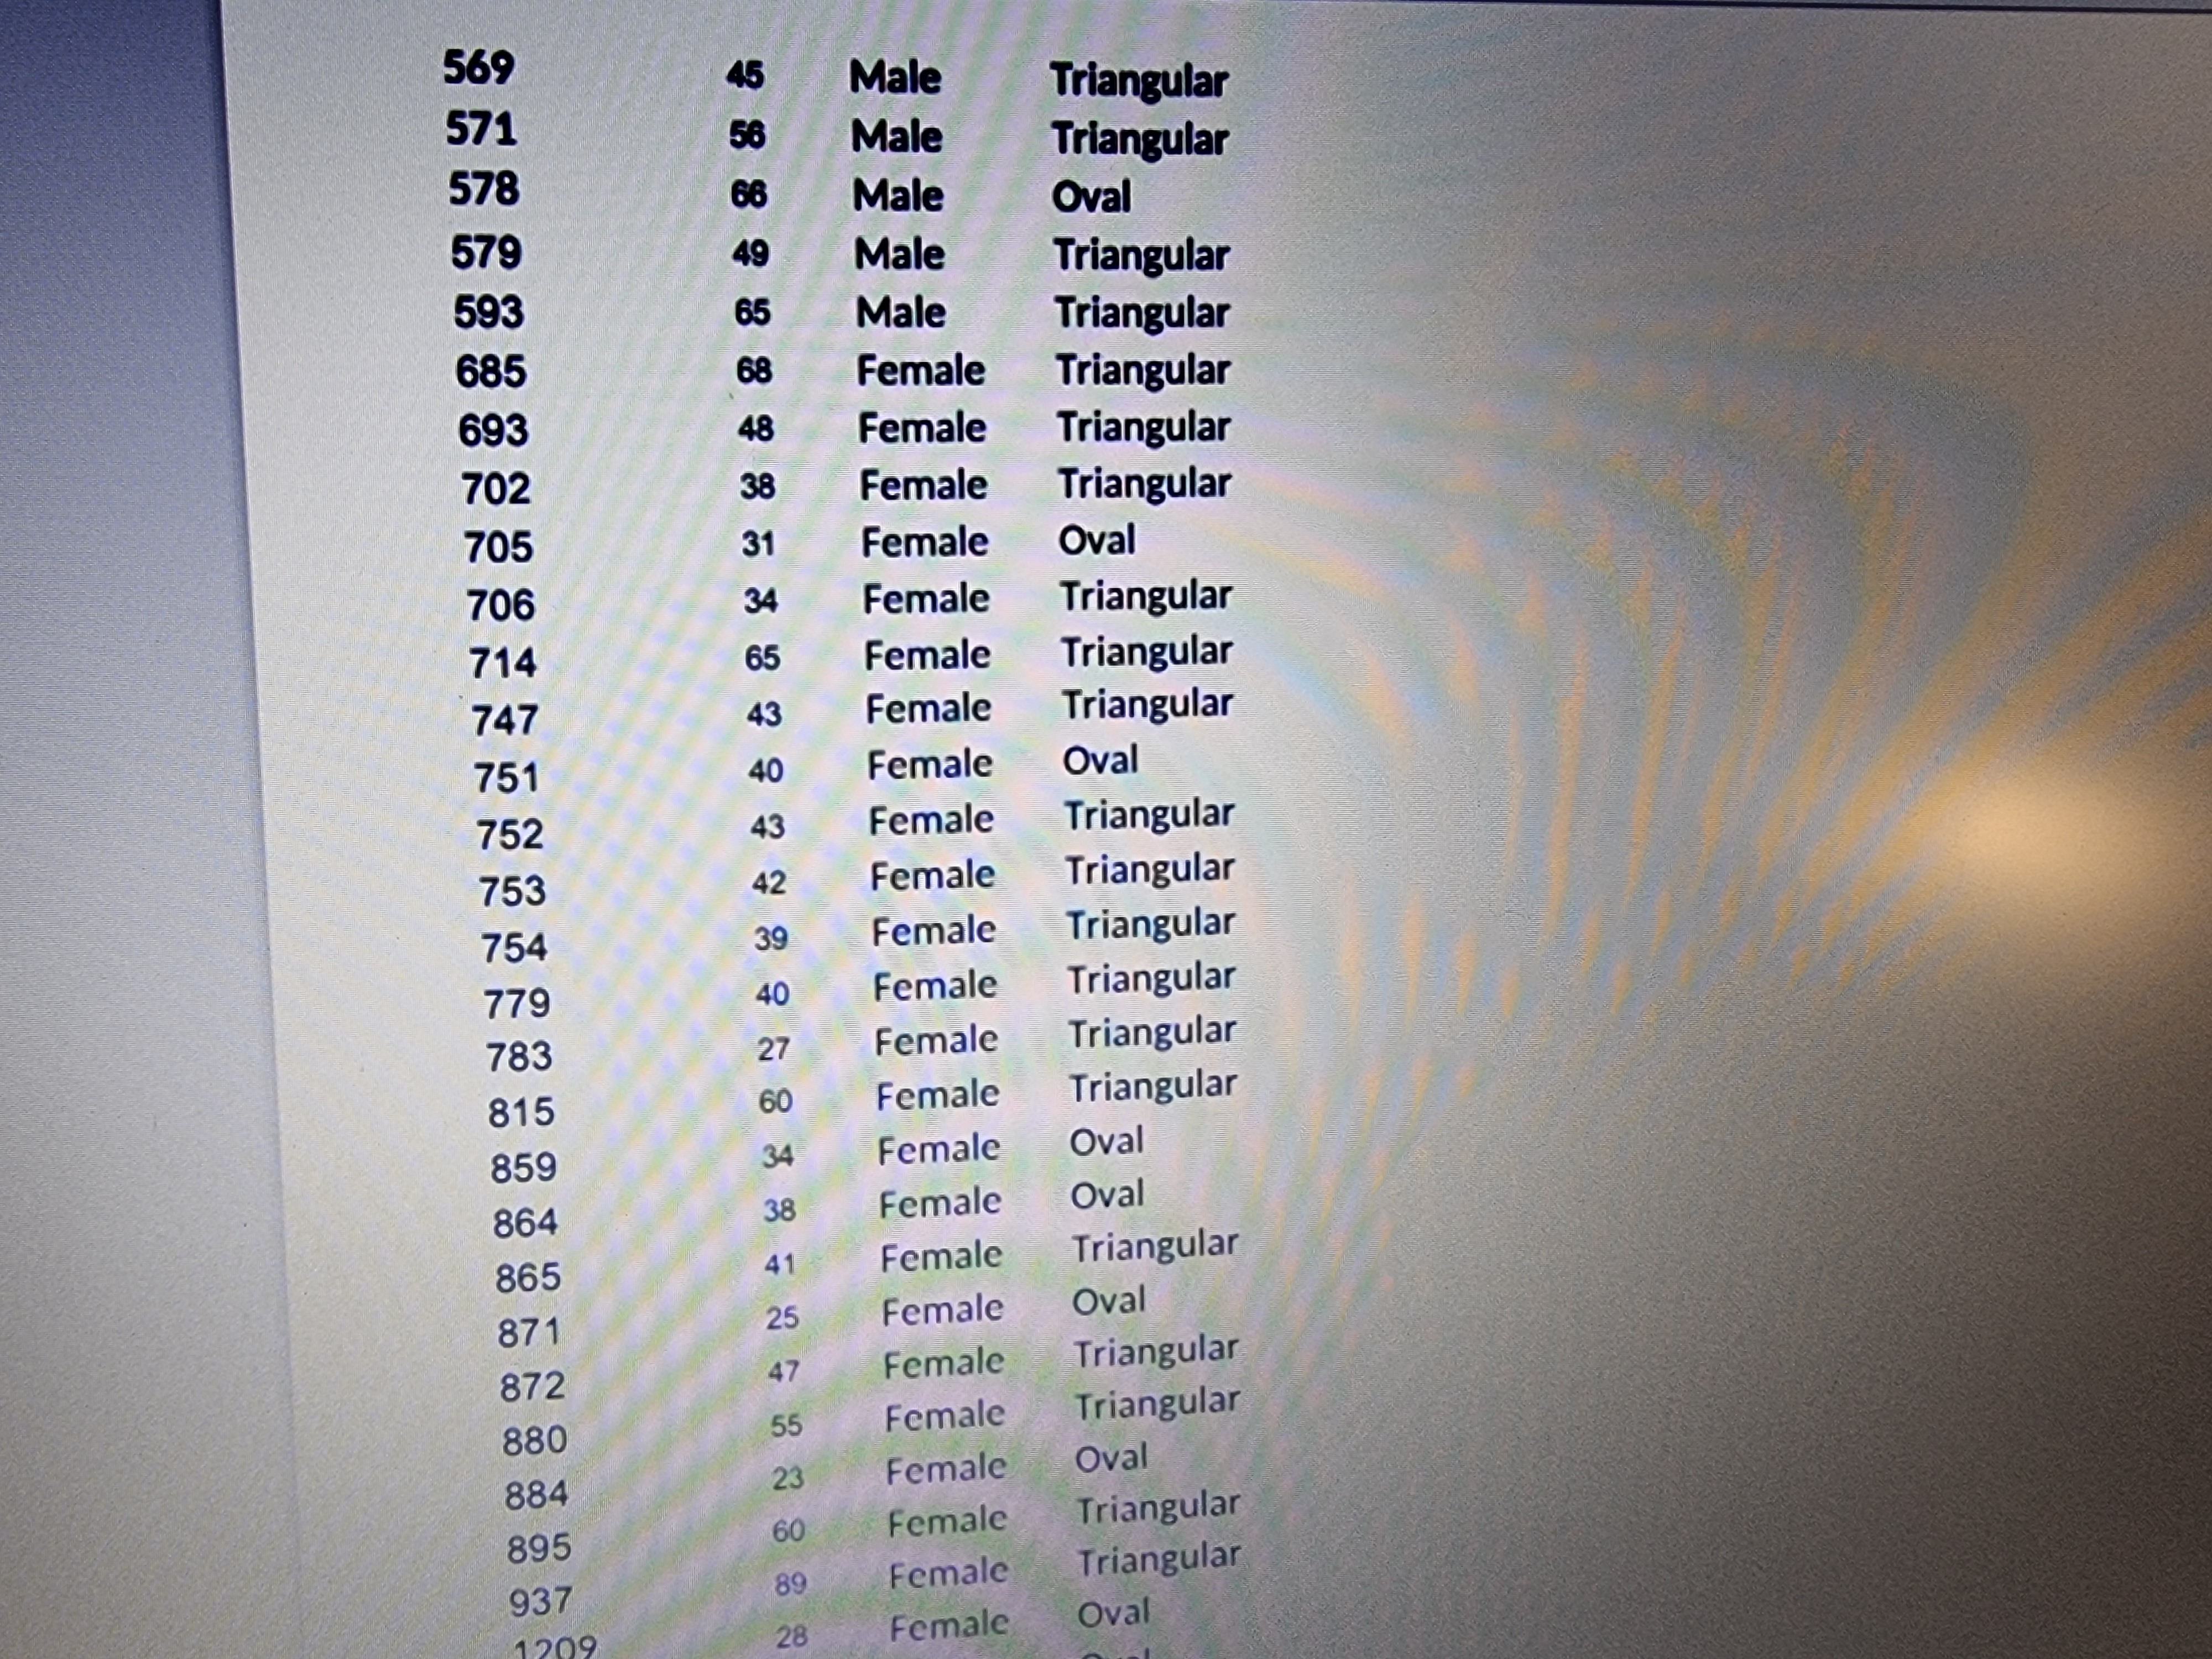
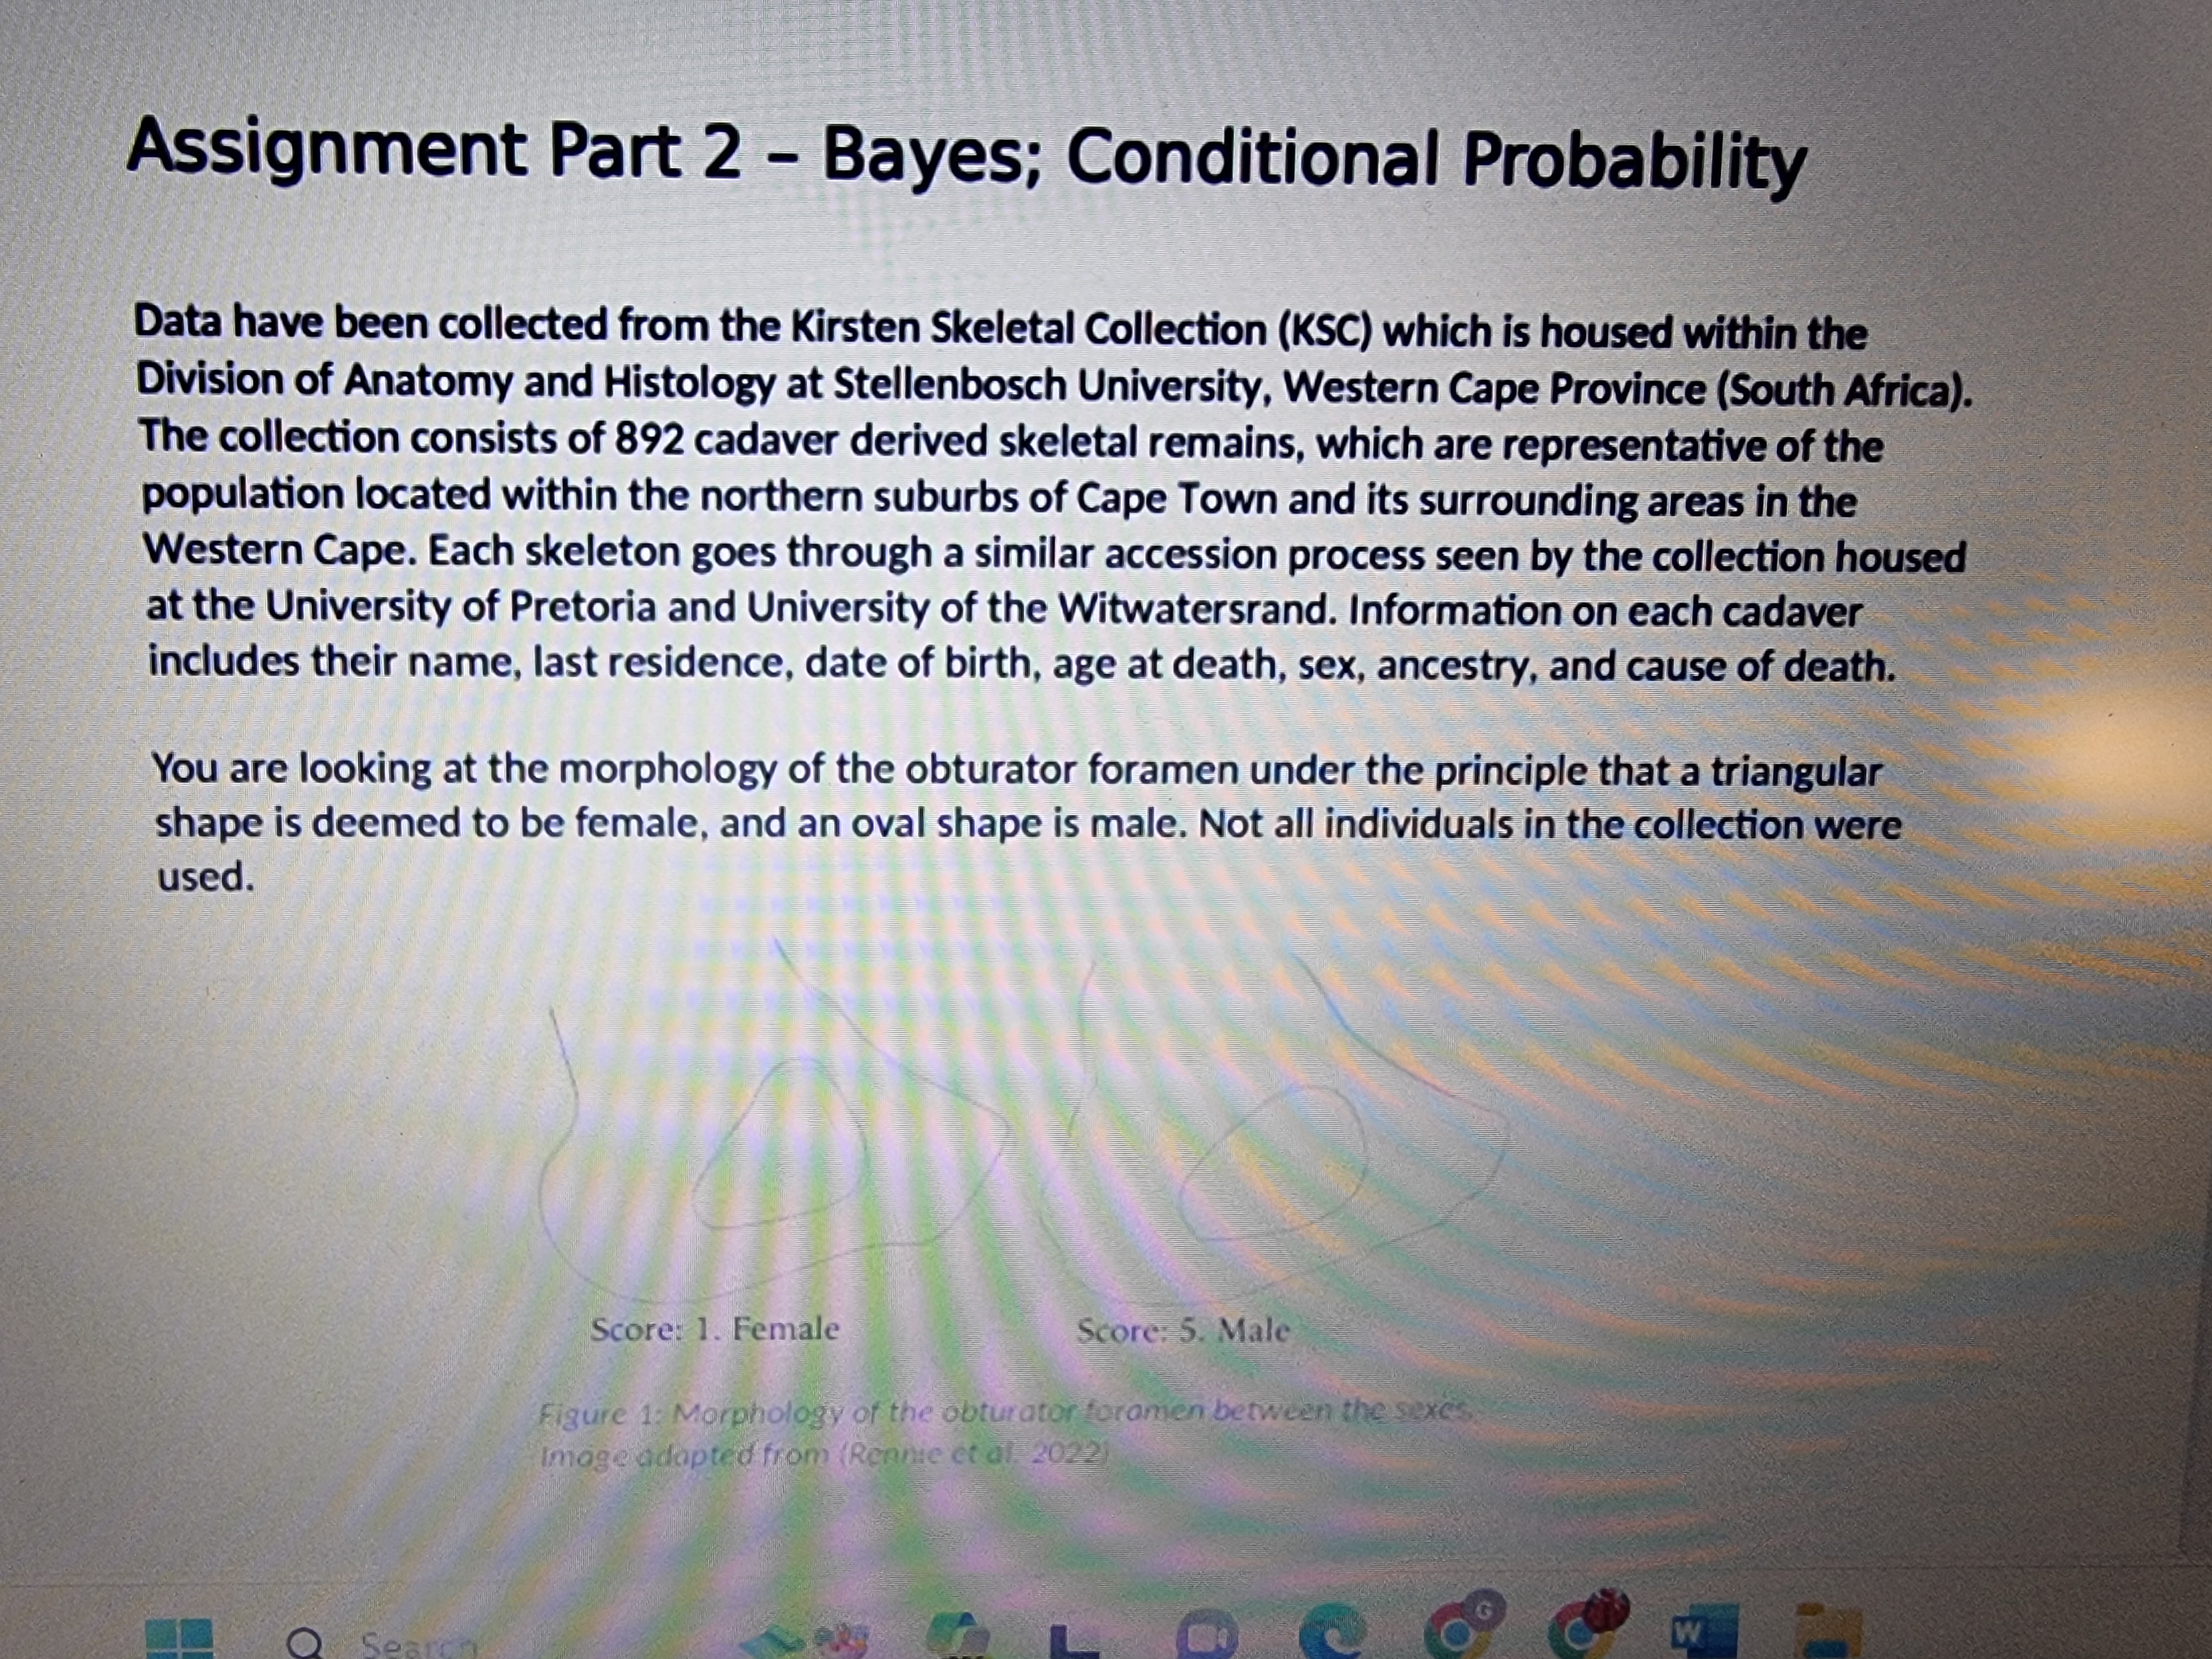
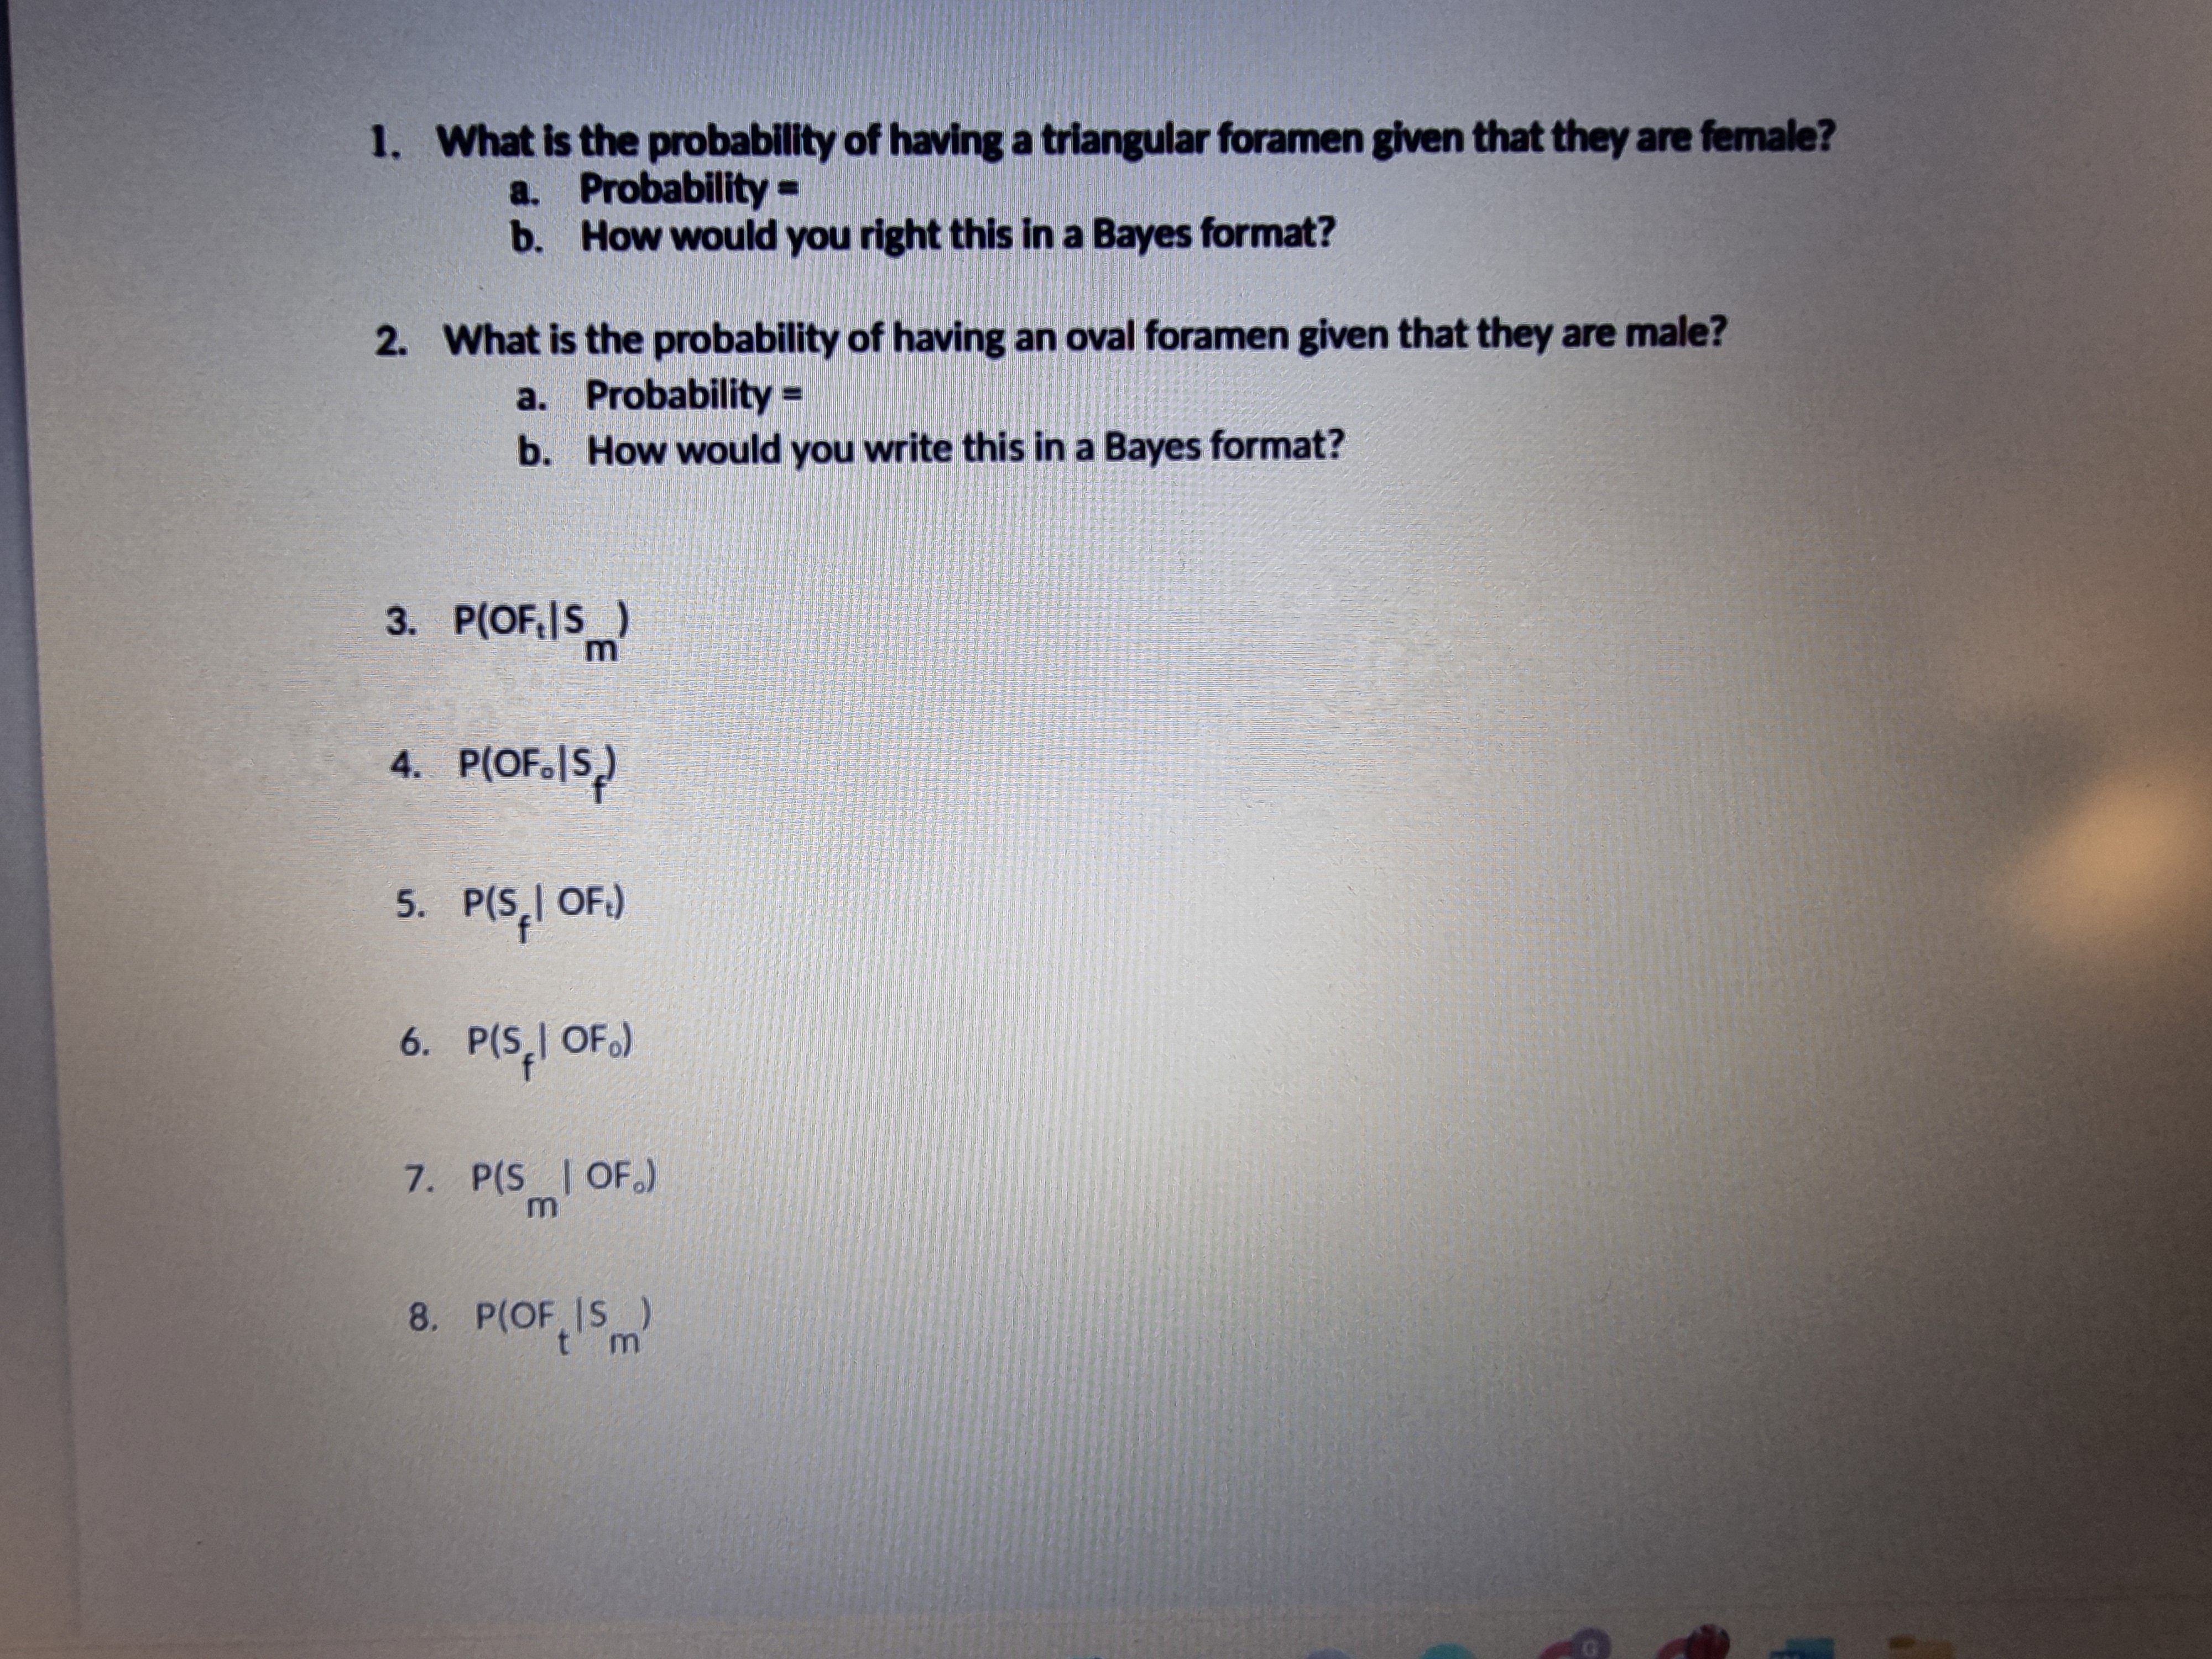
Assignment Part 2 - Bayes; Conditional Probability Data have been collected from the Kirsten Skeletal Collection (KSC) which is housed within the Division of Anatomy and Histology at Stellenbosch University, Western Cape Province (South Africa). The collection consists of 892 cadaver derived skeletal remains, which are representative of the population located within the northern suburbs of Cape Town and its surrounding areas in the Western Cape. Each skeleton goes through a similar accession process seen by the collection housed at the University of Pretoria and University of the Witwatersrand. Information on each cadaver includes their name, last residence, date of birth, age at death, sex, ancestry, and cause of death. and Ca You are looking at the morphology of the obturator foramen under the principle that a triangular shape is deemed to be female, and an oval shape is male. Not all individuals in the collection were used. Score: 1. Female Score: 5. Male Figure 1: Morphology of the obturator foramen between the sexes. Image adapted from (Rennie et al. 2022) P(Sx & OFy) Male Female Q Search PRE L acer Row Sum Ask Copilot + 2 of 2 QOD 1. What is the probability of having a triangular foramen given that they are female? a. Probability = b. How would you right this in a Bayes format? 2. What is the probability of having an oval foramen given that they are male? a. Probability = b. How would you write this in a Bayes format? 3. P(OF.|S) m 4. P(OF.IS,) 5. P(S| OF.) 6. P(S,1 OF) 7. P(S | OF) m 8. P(OF IS IS) tm References: Rennie SR Eliopoulos, C & Gonzalez, S. Evaluation of the obturator for amen as a se sex assessment trait Forensic Sci Med Pathol 19,146-153 (2023), http://dotorg/10.1007512024 022 005 14 0 11A A Aa A-E-- AaPo - x --A- 17 Font Paragraph Week 1 with Sam - Frequentist T < ||21| T Q Normal No Spacing Heading 1 Editing Styles This folder will contain small videos on how to: how to open SPSS and your data test for normality significance testing (parametric and non parametric) correlations visualise your data reporting your results Alongside these videos there will be some example data for you to try it out on (it will be the same as in the videos so you can follow along). Here is a very basic flow chart which may help Accessibility: Investigate nglish (United Kingdom) Text Predictions: On Q Search DATA PRE LO W Focus 0 Search Mailings Review View Help E Q | 41= Week 1 with Sam - Saved v Draw Design Layout References y) -11 A^ A | Aa | Po Uab x Font x | AA 19 V 171 Paragraph Here is a very basic now criart which may neup Parametric (Normal) AA AA Comments |21| T Normal No Spacing Heading 1 Editing Dictate DATA >0.05 0.05 No Significant difference Paired t-test One Sample t-test Independent Sample t-test Descriptive Statistics->Explore Place the data that has been collected (the measurement) into the dependant list. Then click on Plots -> and tick the normality plots with tests box -> continue -> OK. Q Search PRE L W 91@ To perform normality testing do the following: Analyze->Descriptive Statistics->Explore Place the data that has been collected (the measurement) into the dependant list. Then click on Plots -> and tick the normality plots with tests box -> continue -> OK. You will get A LOT of output! Do not panic. This is good. It has now calculated all of your means and medians and interquartile ranges without you having to do any of the heavy lifting. Scroll towards the bottom and you will see a box with your normality tests Q1: What are the p-values for the Kolmonogorov-Smirnov test? Q2: What are the p-values for the Shapiro-Wilks test? Q3: Looking at your sample size, which test should you follow? Q4: Is your data normally distributed or not? Step 3 - Significance Testing So now that we know if the data is normally distributed or not, we can now start answeringour question. Is there a significant difference between the biauricular breadths of the crania from the four populations? To do this we have to perform (depends on your normality) an ANOVA (ANalysis Of Variance) test. Click on Analyze, and choose General Linear Model (not Generalized Linear Models) and then Univariate. Move the column containing the data into the Dependent Variable box. Move the column containing the codes for treatment into the Fixed Factor(s) box. Post hoc tests are also useful. Click on Post Hoc and in the new box move the column containing the treatment codes into the Post Hoc Tests for box. Select Tukey (or other tests if desired). Click on Continue to return to the Univariate dialogue box. Click on O.K. to conduct the analysis. This will compute a one-way analysis of variance to determine if there are significant differences between the means of the samples. Q5: What is the p-value from the main ANOVA test? Q6: Does this mean that there is a or is no significant difference between the samples for this measurement? Q7: From the Post-hoc test, which samples showcase that there are no significant differences? Q8: Have we accepted or rejected our null hypothesis? Q Search PRE L e W > Read aloud | Ask Copilot + R 2 of 2 Q treatment codes into the Post POC Tests for DOX. Select Tukey (or other tests if desired). Click on Continue to return to the Univariate dialogue box. Click on O.K. to conduct the analysis. This will compute a one-way analysis of variance to determine if there are significant differences between the means of the samples. Q5: What is the p-value from the main ANOVA test? Q6: Does this mean that there is a or is no significant difference between the samples for this measurement? Q7: From the Post-hoc test, which samples showcase that there are no significant differences? Q8: Have we accepted or rejected our null hypothesis? Q9: Write this up in the correct format. 9 Triangular = Female Oval = Male Cad No. Age Sex 50 101 Male Shape of the Obturator Foramen Oval 71 60 Female Triangular 78 55 Male Oval 106 87 Male Triangular 110 50 Male Triangular 129 43 Male Oval 167 35 Male Oval 202 50 Male Triangular 219 39 Male Oval 220 31 Male Oval 223 55 Male Oval 224 56 Male Oval 258 21 Male Triangular 261 76 Male Oval 269 37 Male Triangular 270 71 Male Triangular 275 60 Female Oval 276 32 Female Oval 277 27 Female Triangular 280 64 Male Oval 291 78 Male Triangular 292 70 Male Oval 293 62 Male Triangular 294 71 Male Triangular 298 34 Female Triangular 299 43 Female Triangular 305 74 Male Oval 385 62 Male Triangular 389 71 Male Triangular 390 59 Male Oval 391 63 Male Triangular 394 49 Male Triangular 397 54 Male Oval 398 26 Male Oval 403 55 Male Oval 404 60 Male Oval 409 47 Male Triangular 413 84 Female Oval 414 70 Male Triangular 424 70 Male Oval 428 26 Female Triangular 432 43 Female Triangular 437 53 Male Oval 440 55 Female Triangular 442 41 Female Triangular 445 32 Male Triangular 447 44 Male Oval 448 32 Female Triangular 452 56 Male Triangular 454 45 Male Oval 457 81 Female Oval 458 59 Male Triangular 462 60 Female Triangular 463 51 Female Triangular 464 65 Male Triangular 466 30 Male Oval 470 19 Male Oval Read aloud | Ask Copilot 473 40 Male Oval 480 66 Male Triangular 483 30 Male Triangular 488 53 Male Oval 489 75 Male Triangular 490 18 Female Oval 492 28 Male Oval 502 51 503 517 50 518 33 526 529 45 531 534 536 539 548 551 563 on on on SSA A ESSA Female Triangular Male Triangular Male Oval Male Triangular Male Oval Female Triangular Male Oval 50 Male Triangular 58 Female Oval Male Oval Male Oval Male Triangular Male Triangular + 2 of 4 569 571 578 88& 45 Male Triangular 56 Male Triangular 66 Male Oval 579 49 Male Triangular 593 65 Male Triangular 685 68 Female Triangular 693 48 Female Triangular 702 38 Female Triangular 705 31 Female Oval 706 34 Female Triangular 714 65 Female Triangular 747 43 Female Triangular 751 40 Female Oval 752 43 Female Triangular 753 42 Female Triangular 754 39 779 40 783 27 815 60 859 864 865 871 872 880 884 895 937 1209 242831252682 Female Triangular Female Triangular Female Triangular Female Triangular Female Oval Female Oval Female Triangular Female Oval Female Triangular Female Triangular Female Oval Female Triangular 89 Female Triangular Female Oval Assignment Part 2 - Bayes; Conditional Probability Data have been collected from the Kirsten Skeletal Collection (KSC) which is housed within the Division of Anatomy and Histology at Stellenbosch University, Western Cape Province (South Africa). The collection consists of 892 cadaver derived skeletal remains, which are representative of the population located within the northern suburbs of Cape Town and its surrounding areas in the Western Cape. Each skeleton goes through a similar accession process seen by the collection housed at the University of Pretoria and University of the Witwatersrand. Information on each cadaver includes their name, last residence, date of birth, age at death, sex, ancestry, and cause of death. You are looking at the morphology of the obturator foramen under the principle that a triangular shape is deemed to be female, and an oval shape is male. Not all individuals in the collection were used. Search Score: 1. Female Score: 5. Male Figure 1: Morphology of the obturator foramen between the sexes. Image adapted from (Rennie et al. 2022) M W 1. What is the probability of having a triangular foramen given that they are female? a. Probability = b. How would you right this in a Bayes format? 2. What is the probability of having an oval foramen given that they are male? a. Probability= b. How would you write this in a Bayes format? 3. P(OF. S m 4. P(OF.IS) 5. P(S| OF) 6. P(S| OF) 7. P(S | OF.) m 8. P(OF IS) m G
Step by Step Solution
There are 3 Steps involved in it
Step: 1

Get Instant Access to Expert-Tailored Solutions
See step-by-step solutions with expert insights and AI powered tools for academic success
Step: 2

Step: 3
Ace Your Homework with AI
Get the answers you need in no time with our AI-driven, step-by-step assistance
Get Started
Probability and Random Processes With Applications to Signal Processing and Communications
Authors: Scott Miller, Donald Childers
2nd edition
123869811, 978-0121726515, 121726517, 978-0130200716, 978-0123869814