Assignment Question 1 UTZ Consulting Ltd. advises clients about sampling and statistical procedures that can be used to control manufacturing processes. In one case, a
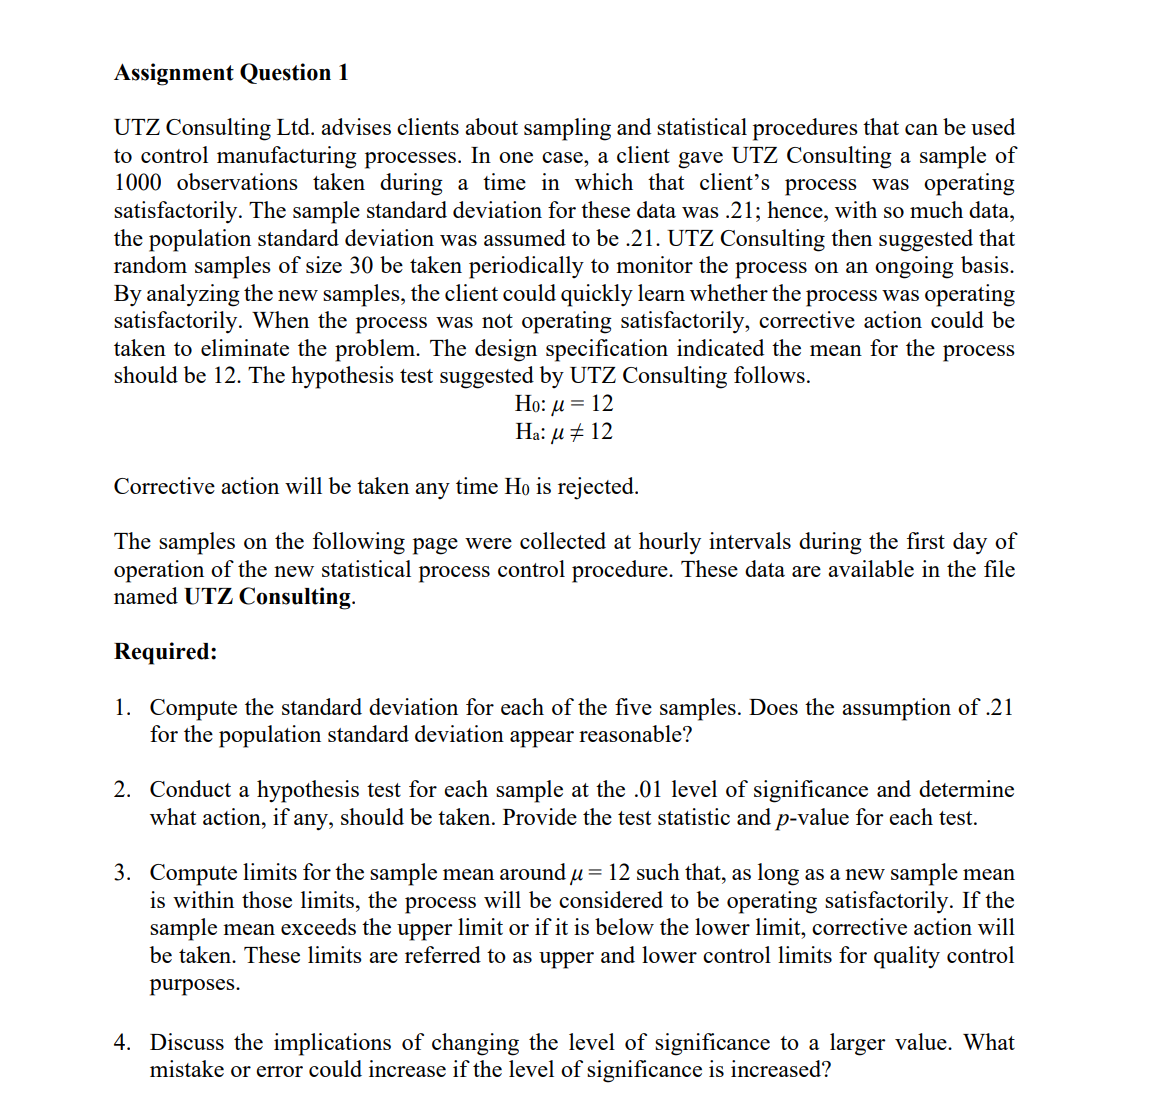
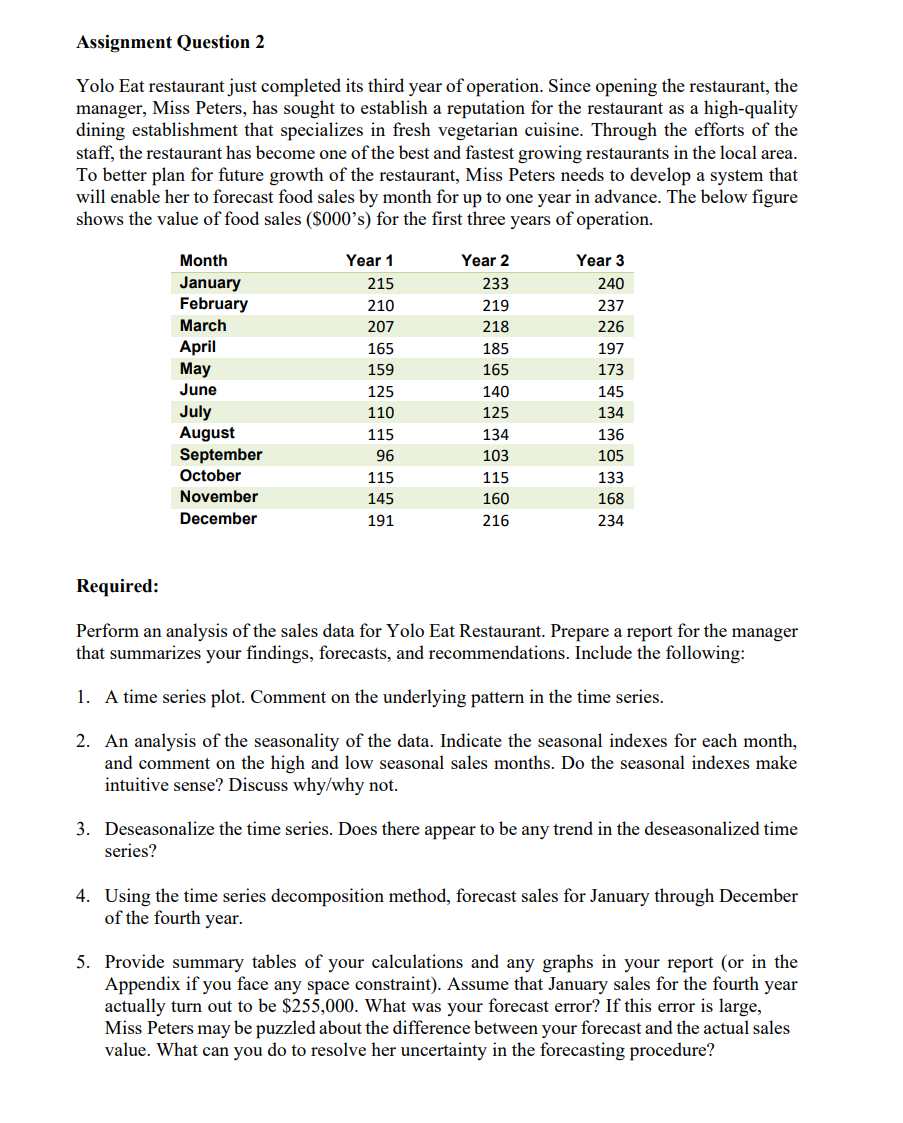
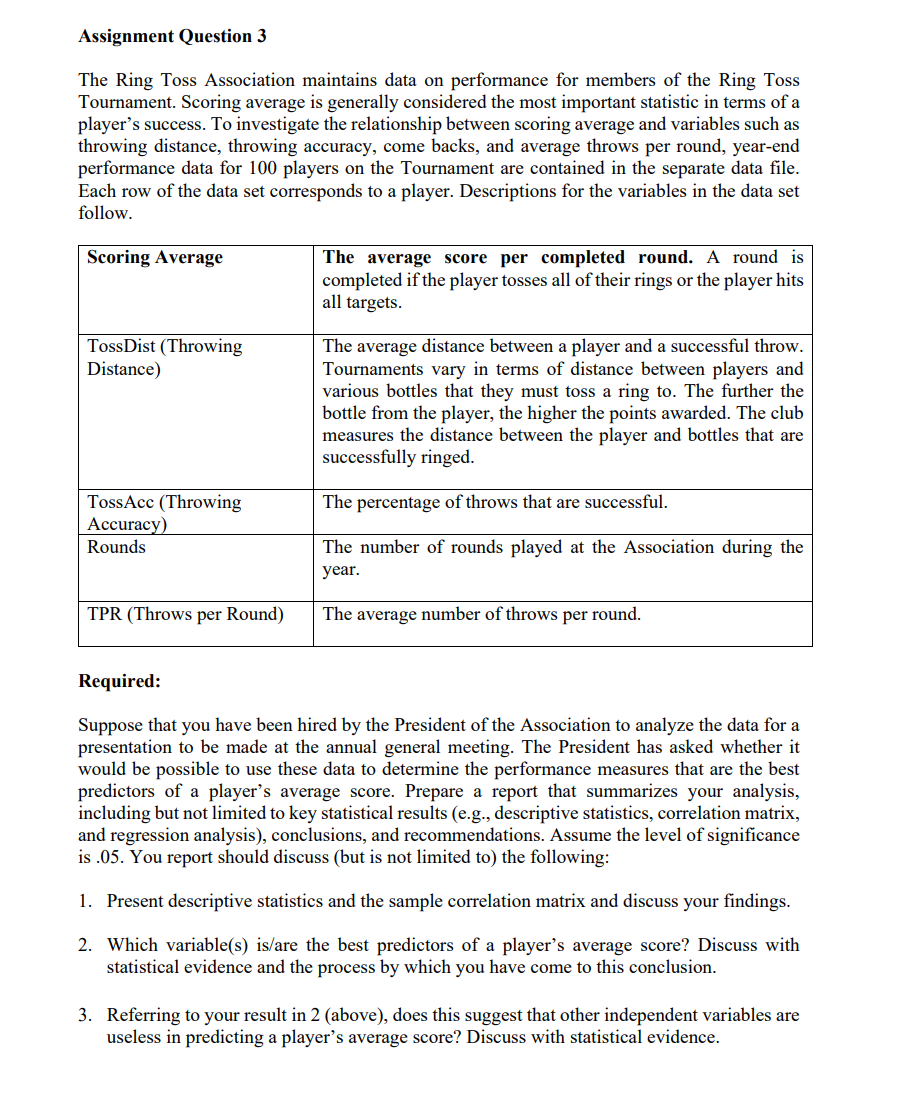
Assignment Question 1 UTZ Consulting Ltd. advises clients about sampling and statistical procedures that can be used to control manufacturing processes. In one case, a client gave UTZ Consulting a sample of 1000 observations taken during a time in which that client's process was operating satisfactorily. The sample standard deviation for these data was .21; hence, with so much data, the population standard deviation was assumed to be .21. UTZ Consulting then suggested that random samples of size 30 be taken periodically to monitor the process on an ongoing basis. By analyzing the new samples, the client could quickly learn whether the process was operating satisfactorily. When the process was not operating satisfactorily, corrective action could be taken to eliminate the problem. The design specification indicated the mean for the process should be 12. The hypothesis test suggested by UTZ Consulting follows. Ho: u=12 Ha: u # 12 Corrective action will be taken any time Ho is rejected. The samples on the following page were collected at hourly intervals during the first day of operation of the new statistical process control procedure. These data are available in the file named UTZ Consulting. Required: 1. Compute the standard deviation for each of the five samples. Does the assumption of .21 for the population standard deviation appear reasonable? 2. Conduct a hypothesis test for each sample at the .01 level of significance and determine what action, if any, should be taken. Provide the test statistic and p-value for each test. 3. Compute limits for the sample mean around g = 12 such that, as long as a new sample mean is within those limits, the process will be considered to be operating satisfactorily. If the sample mean exceeds the upper limit or if it is below the lower limit, corrective action will be taken. These limits are referred to as upper and lower control limits for quality control purposes. 4. Discuss the implications of changing the level of significance to a larger value. What mistake or error could increase if the level of significance is increased? Assignment Question 2 Yolo Eat restaurant just completed its third year of operation. Since opening the restaurant, the manager, Miss Peters, has sought to establish a reputation for the restaurant as a high-quality dining establishment that specializes in fresh vegetarian cuisine. Through the efforts of the staff, the restaurant has become one of the best and fastest growing restaurants in the local area. To better plan for future growth of the restaurant, Miss Peters needs to develop a system that will enable her to forecast food sales by month for up to one year in advance. The below figure shows the value of food sales (S000's) for the first three years of operation. Month Year 1 Year 2 Year 3 January 215 233 240 February 210 219 237 March 207 218 226 April 165 185 197 May 159 165 173 June 125 140 145 July 110 125 134 August 115 134 136 September 96 103 105 October 115 115 133 November 145 160 168 December 191 216 234 Required: Perform an analysis of the sales data for Yolo Eat Restaurant. Prepare a report for the manager that summarizes your findings, forecasts, and recommendations. Include the following: 1 & A time series plot. Comment on the underlying pattern in the time series. An analysis of the seasonality of the data. Indicate the seasonal indexes for each month, and comment on the high and low seasonal sales months. Do the seasonal indexes make intuitive sense? Discuss why/why not. Deseasonalize the time series. Does there appear to be any trend in the deseasonalized time series? Using the time series decomposition method, forecast sales for January through December of the fourth year. Provide summary tables of your calculations and any graphs in your report (or in the Appendix if you face any space constraint). Assume that January sales for the fourth year actually turn out to be $255,000. What was your forecast error? If this error is large, Miss Peters may be puzzled about the difference between your forecast and the actual sales value. What can you do to resolve her uncertainty in the forecasting procedure? Assignment Question 3 The Ring Toss Association maintains data on performance for members of the Ring Toss Tournament. Scoring average is generally considered the most important statistic in terms of a player's success. To investigate the relationship between scoring average and variables such as throwing distance, throwing accuracy, come backs, and average throws per round, year-end performance data for 100 players on the Tournament are contained in the separate data file. Each row of the data set corresponds to a player. Descriptions for the variables in the data set follow. Scoring Average The average score per completed round. A round is completed if the player tosses all of their rings or the player hits all targets. TossDist (Throwing The average distance between a player and a successful throw. Distance) Tournaments vary in terms of distance between players and various bottles that they must toss a ring to. The further the bottle from the player, the higher the points awarded. The club measures the distance between the player and bottles that are successfully ringed. TossAcc (Throwing The percentage of throws that are successful. Accuracy) Rounds The number of rounds played at the Association during the year. TPR (Throws per Round) The average number of throws per round. Required: Suppose that you have been hired by the President of the Association to analyze the data for a presentation to be made at the annual general meeting. The President has asked whether it would be possible to use these data to determine the performance measures that are the best predictors of a player's average score. Prepare a report that summarizes your analysis, including but not limited to key statistical results (e.g., descriptive statistics, correlation matrix, and regression analysis), conclusions, and recommendations. Assume the level of significance is .05. You report should discuss (but is not limited to) the following: 1. Present descriptive statistics and the sample correlation matrix and discuss your findings. 2. Which variable(s) is/are the best predictors of a player's average score? Discuss with statistical evidence and the process by which you have come to this conclusion. 3. Referring to your result in 2 (above), does this suggest that other independent variables are useless in predicting a player's average score? Discuss with statistical evidence
Step by Step Solution
There are 3 Steps involved in it
Step: 1
Get Instant Access to Expert-Tailored Solutions
See step-by-step solutions with expert insights and AI powered tools for academic success
Step: 2
Step: 3
Ace Your Homework with AI
Get the answers you need in no time with our AI-driven, step-by-step assistance