Answered step by step
Verified Expert Solution
Question
1 Approved Answer
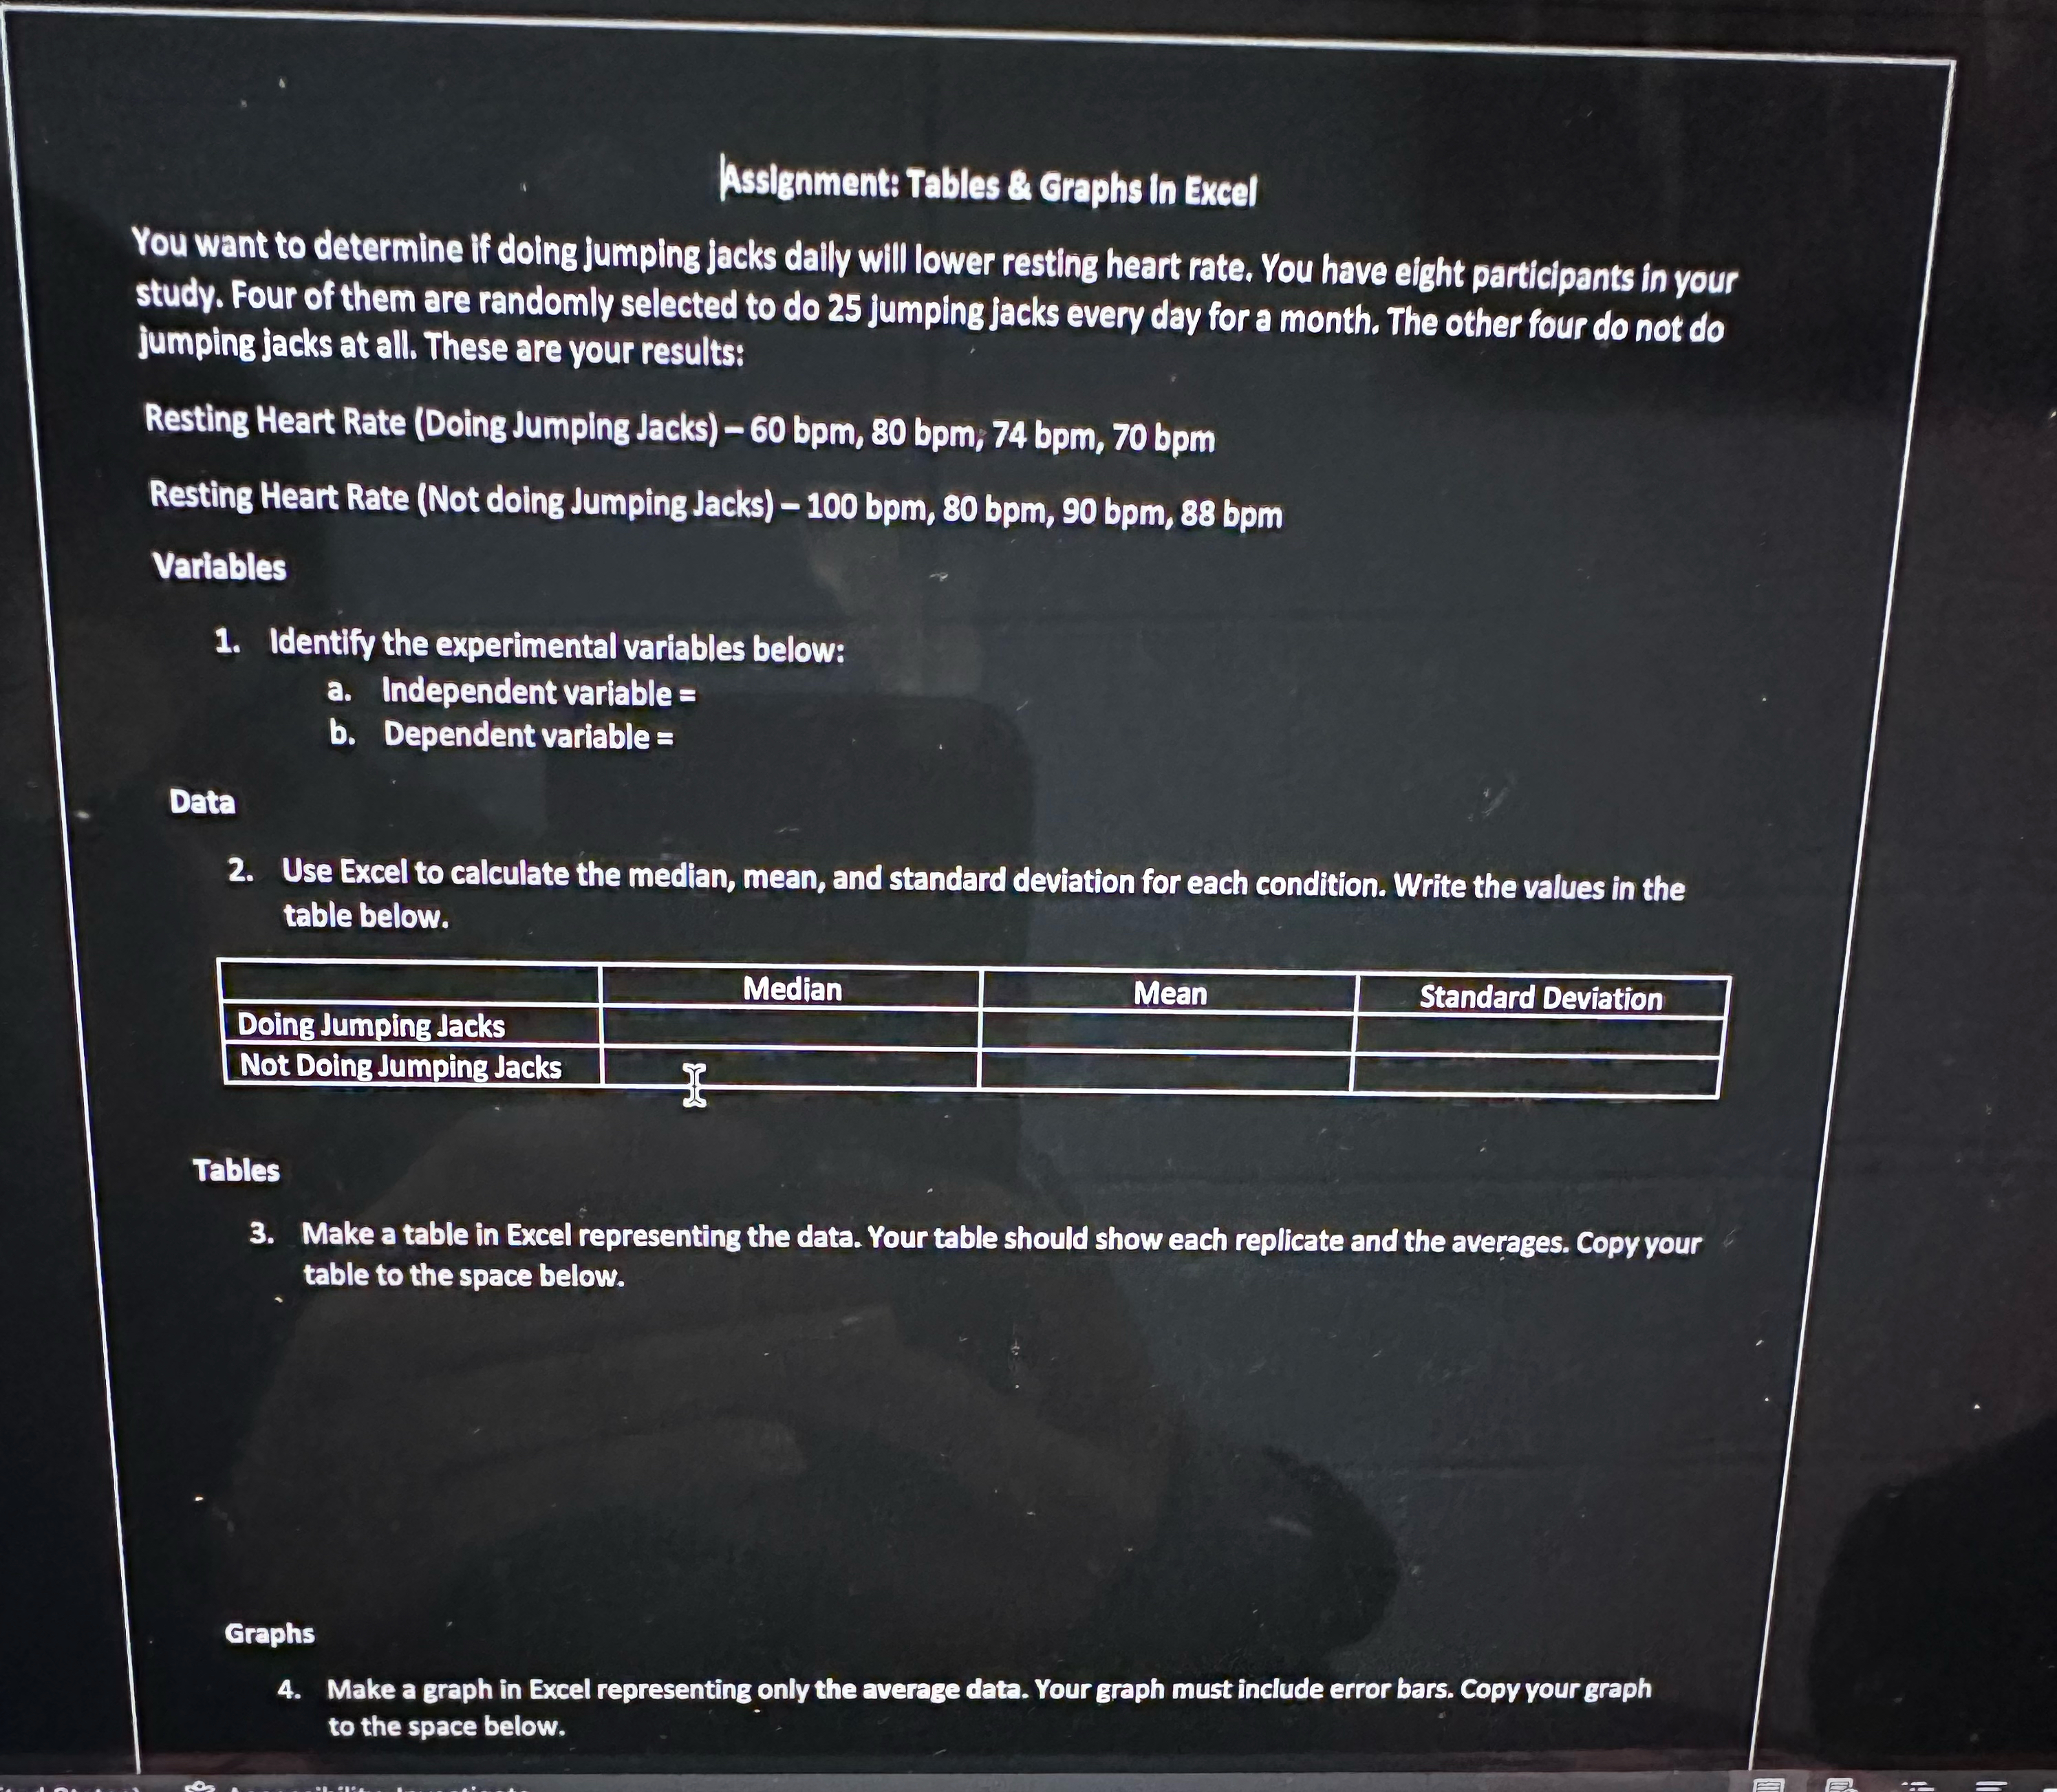
Assignment: Tables & Graphs in Excel You want to determine if doing Jumping jacks dally will lower resting heart rate. You have eight participants in
Assignment: Tables & Graphs in Excel
You want to determine if doing Jumping jacks dally will lower resting heart rate. You have eight participants in your study. Four of them are randomly selected to do Jumping jacks every day for a month. The other four do not do jumping jacks at all. These are your results:
Resting Heart Rate Doing Jumping Jacks;
Resting Heart Rate Not doing Jumping Jacks
Variables
Identify the experimental variables below:
a Independent variable
b Dependent variable
Data
Use Excel to calculate the median, mean, and standard deviation for each condition. Write the values in the table below.
tableMedian,Mean,Standard DeviationDoing Jumping Jacks,ENot Doing Jumping Jacks,F
Tables
Make a table in Excel representing the data. Your table should show each replicate and the averages. Copy your table to the space below.
Graphs
Make a graph in Excel representing only the average data. Your graph must include error bars. Copy your graph to the space below.

Step by Step Solution
There are 3 Steps involved in it
Step: 1

Get Instant Access to Expert-Tailored Solutions
See step-by-step solutions with expert insights and AI powered tools for academic success
Step: 2

Step: 3

Ace Your Homework with AI
Get the answers you need in no time with our AI-driven, step-by-step assistance
Get Started


