Assignment: Using the balance sheet and income statement data on FOLLOWING PAGES, compute Return on assets, Return on equity, Net interest margin, and the equity multiplier in each year and discuss how these variables have changed over time. What do each of these financial ratios measure and why are they important? Please do not hand in the data tables below. But I do need you to show your answers and how you computed ROA; ROE; NIM; and the equity multiplier.
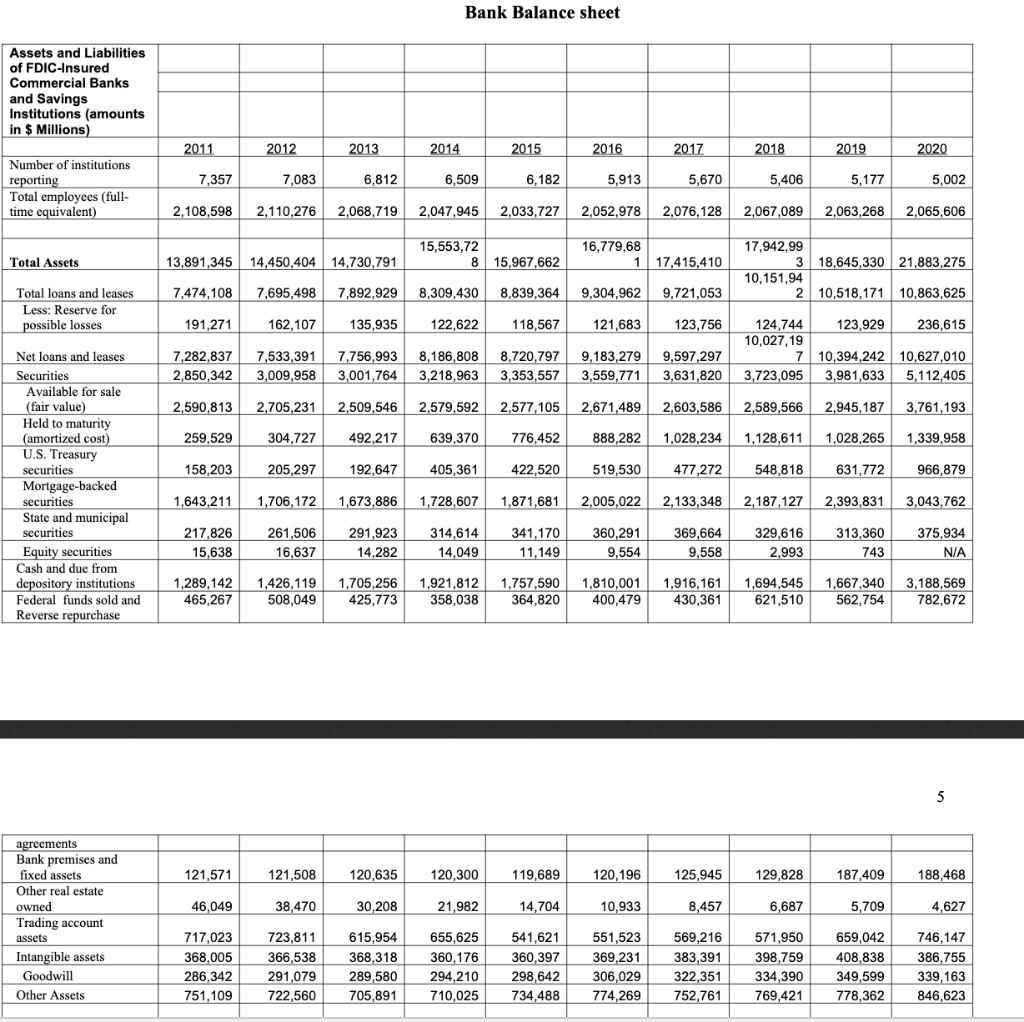
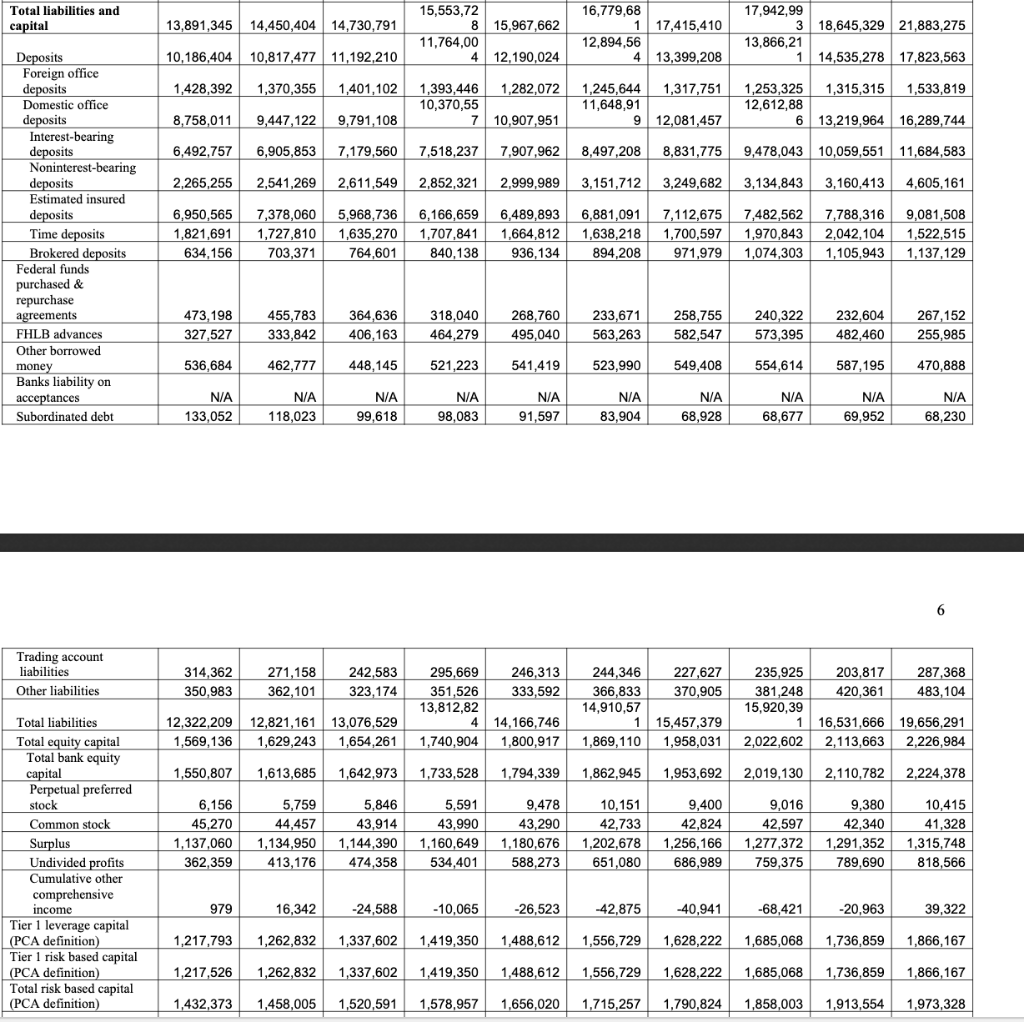
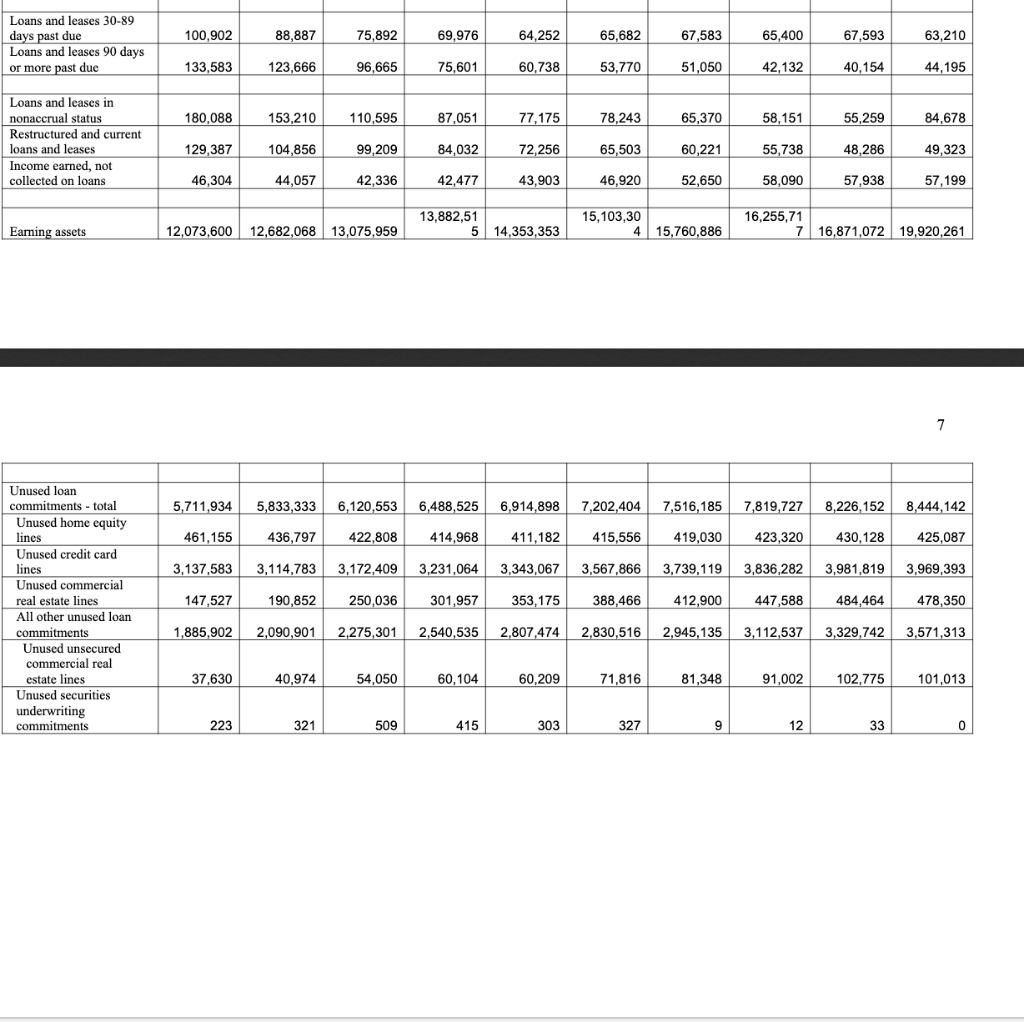
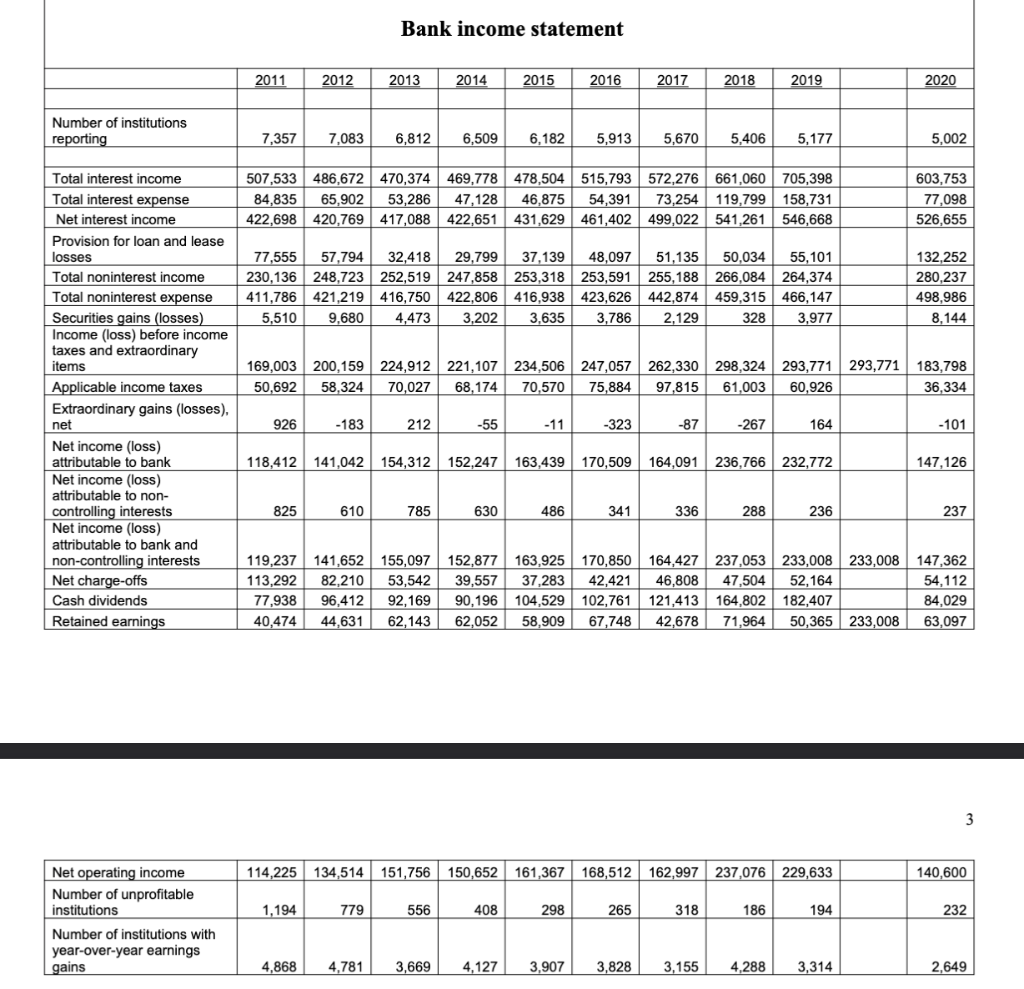
Bank Balance sheet Assets and Liabilities of FDIC-Insured Commercial Banks and Savings Institutions (amounts in $ Millions) 2011 2012 2013 2014 2015 2016 2017 2018 2019 2020 7,357 7,083 6,812 6,509 6,182 5,913 5,670 5,406 5,177 5,002 Number of institutions reporting Total employees (full- time equivalent) 2,108,598 2,110,276 2,068,719 2,047,945 2,033,727 2,052,978 2,076,128 2,067,089 2,063,268 2,065,606 15,553,72 8 15,967,662 16,779,68 117,415,410 Total Assets 14,450,404 14,730,791 13,891,345 17,942,99 3 18.645,330 21,883,275 10,151,94 2 10,518,171 10,863,625 7,474,108 7,695,498 7,892,929 8,309,430 8,839,364 9.304,962 9.721,053 Total loans and leases Less: Reserve for possible losses 191,271 162,107 135,935 122,622 118,567 121,683 123,756 123,929 236,615 Net loans and leases Securities Available for sale 7,282,837 2,850,342 7,533,391 3,009,958 7,756,993 3,001,764 8,186,808 3,218,963 8,720,797 3,353,557 9,183,279 3,559,771 9,597,297 3,631,820 124,744 10,027,19 7 3,723,095 10,394,242 10,627,010 3,981,633 5,112,405 (fair value) 2,590,813 2,705,231 2,509,546 2,579,592 2,577,105 2,671,489 2,603,586 2,589,566 2.945,187 3,761,193 259,529 304,727 492,217 639,370 776,452 888,282 1,028,234 1,128,611 1,028,265 1,339,958 158,203 205,297 192,647 405,361 422,520 519,530 477,272 548,818 631,772 966,879 1,643,211 1,706,172 1,673,886 1,728,607 1,871,681 2,005,022 2,133,348 2,187,127 2,393,831 3,043,762 Held to maturity (amortized cost) U.S. Treasury securities Mortgage-backed securities State and municipal securities Equity securities Cash and due from depository institutions Federal funds sold and Reverse repurchase 314,614 217,826 15,638 261,506 16,637 291,923 14,282 341,170 11,149 360,291 9,554 369,664 9,558 329,616 2,993 313,360 743 375,934 N/A 14,049 1,289,142 465,267 1,426,119 508,049 1,705,256 425,773 1,921,812 358,038 1,757,590 364,820 1,810,001 400,479 1,916,161 430,361 1,694,545 621,510 1,667,340 562,754 3,188,569 782,672 5 121,571 121,508 120,635 120,300 19,689 0,19 125,945 129,828 187,409 188,468 46,049 38,470 30,208 21,982 14,704 10,933 8,457 6,687 5,709 4,627 agreements Bank premises and fixed assets Other real estate owned Trading account assets Intangible assets Goodwill Other Assets 717,023 368,005 286,342 751,109 723,811 366,538 291,079 722,560 615,954 368,318 289,580 705,891 655,625 360,176 294,210 710,025 541,621 360,397 298,642 734,488 551,523 369,231 306,029 774,269 569,216 383,391 322,351 752,761 571,950 398,759 334,390 769,421 659,042 408,838 349,599 778,362 746,147 386,755 339,163 846,623 Total liabilities and capital 13,891,345 14,450,404 14,730,791 15,553,72 8 15,967,662 11,764,00 4 12,190,024 16,779,68 1 17,415,410 12,894,56 4 13,399,208 17,942,99 3 18,645,329 21,883,275 13,866,21 1 14,535,278 17,823,563 10,186,404 10,817,477 11,192,210 1,428,392 1,370,355 1,401,102 1,317,751 1,393,446 1,282,072 10,370,55 7 10,907,951 1,245,644 11,648,91 1,253,325 1,315,315 1,533,819 12,612,88 6 13,219,964 16,289,744 8,758,011 9,447,122 9,791, 108 12,081,457 6,492,757 6,905,853 7,179,560 7,518,237 7,907,962 8,497,208 8,831,775 9,478,043 10,059,551 11,684,583 Deposits Foreign office deposits Domestic office deposits Interest-bearing deposits Noninterest-bearing deposits Estimated insured deposits Time deposits Brokered deposits Federal funds purchased & repurchase agreements 2,265,255 2,541,269 2,611,549 2,852,321 2,999,989 3,151,712 3,249,682 3,134,843 3,160,413 4,605,161 6,950,565 1,821,691 634,156 7,378,060 1,727,810 703,371 5,968,736 1,635,270 764,601 6,166,659 1,707,841 840,138 6,489,893 1,664,812 936,134 6,881,091 1,638,218 894,208 7,112,675 1,700,597 971,979 7,482,562 1,970,843 1,074,303 7,788,316 2,042,104 1,105,943 9,081,508 1,522,515 1,137,129 473,198 327,527 455,783 333,842 364,636 406,163 318,040 464,279 268,760 495,040 233,671 563,263 258,755 582,547 240,322 573,395 232,604 482,460 267,152 255,985 CHLB advances 536,684 462,777 448,145 521,223 541,419 523,990 549,408 554,614 587,195 470,888 Other borrowed money Banks liability on acceptances Subordinated debt N/A 133,052 N/A 118,023 N/A 99,618 N/A 98,083 N/A 91,597 N/A 83,904 N/A 68,928 NA 68,677 NA 69,952 N/A 68,230 6 Trading account liabilities Other liabilities 314,362 350,983 271,158 362,101 242,583 323, 174 246,313 333,592 244,346 366,833 14,910,57 227,627 370,905 203,817 420,361 295,669 351,526 13,812,82 4 1,740,904 287,368 483,104 235,925 381,248 15,920,39 1 2,022,602 12,322,209 1,569,136 12,821,161 1,629,243 13,076,529 1,654,261 14,166,746 1,800,917 15,457,379 1,958,031 16,531,666 19,656,291 2,113,663 2,226,984 1,869,110 1,550,807 1,613,685 1,642,973 1,733,528 1,794,339 1,862,945 1,953,692 2,019,130 2,110,782 2,224,378 Total liabilities Total equity capital Total bank equity capital Perpetual preferred stock Common stock Surplus Undivided profits Cumulative other comprehensive income Tier 1 leverage capital (PCA definition) Tier 1 risk based capital (PCA definition) Total risk based capital (PCA definition) 6,156 45,270 1,137,060 362,359 5,759 44,457 1,134,950 413,176 5,846 43,914 1,144,390 474,358 5,591 43,990 1,160,649 534,401 9,478 43,290 1,180,676 588,273 10,151 42,733 1,202,678 651,080 9,400 42,824 1,256,166 686,989 9,016 42,597 1,277,372 759,375 9,380 42,340 1,291,352 789,690 10,415 41,328 1,315,748 818,566 979 16,342 -24,588 -10,065 -26,523 -42.875 -40.941 -68,421 -20,963 39,322 1,217,793 1,262,832 1,337,602 1,419,350 1,488,612 1,556,729 1,628,222 1,685,068 1,736,859 1,866,167 1,217,526 1,262,832 1,337,602 1,419,350 1,488,612 1,556,729 1,628,222 1,685,068 1,736,859 1,866,167 1,432,373 1,458,005 1,520,591 1,578,957 1,656,020 1,715,257 1,790,824 1,858,003 1,913,554 1,973,328 100,902 88,887 75,892 69,976 64,252 65,682 67,583 65,400 67,593 63,210 Loans and leases 30-89 days past due Loans and leases 90 days or more past due 133,583 123,666 96,665 75,601 60,738 53,770 51,050 42,132 40,154 44,195 180,088 153.210 110,595 87,051 77,175 78,243 65,370 58,151 55.259 84,678 Loans and leases in nonaccrual status Restructured and current loans and leases Income earned, not collected on loans 129,387 104,856 99,209 84,032 72,256 65,503 60,221 55,738 48,286 49,323 46,304 44,057 42,336 42,477 43,903 46,920 52,650 58.090 57,938 57,199 Earning assets 13,882,51 5 14.353.353 15,103,30 415,760,886 12,073,600 12,682,068 13,075,959 16,255,71 7 16,871,072 19,920,261 7 5,711,934 5,833,333 6,120,553 6,488,525 6,914,898 7,202,404 7,516,185 7,819,727 8,226,152 8,444,142 461,155 436.797 422,808 414,968 411,182 415,556 419,030 423,320 430,128 425,087 3,137,583 3,114,783 3,172,409 3,231,064 3,343,067 3,567,866 3,739,119 3,836,282 3,981,819 3,969,393 Unused loan commitments - total Unused home equity lines Unused credit card huse lines Unused commercial real estate lines usato All other unused loan commitments Onuso Unused unsecured commercial real 147,527 190,852 250,036 301,957 353,175 388,466 412,900 447,588 484,464 478,350 1,885,902 2,090,901 2,275,301 2,540,535 2,807,474 2,830,516 2,945,135 3,112,537 3,329,742 3,571,313 estate lines 37,630 40,974 54.050 60,104 60.209 71.816 81.348 91.002 102,775 101,013 Unused securities underwriting commitments 223 321 509 415 303 327 9 12 33 0 Bank income statement 2011 2012 2013 2014 2015 2016 2017 2018 2019 2020 Number of institutions reporting 7,357 7,083 6,812 6,509 6,182 5,913 5,670 5,406 5,177 5,002 507,533 486,672 470,374 469,778 478,504 515,793 572,276 661,060 705,398 84,835 65,902 53,286 47,128 46.875 54,391 73,254 119,799 158,731 422,698 420,769 417,088 422,651 431,629 461,402 499,022 541,261 546,668 603,753 77,098 526,655 77,555 57,794 32,418 29,799 37,139 48,097 51,135 50,034 55,101 230,136 248,723 252,519 247,858 253,318 253,591 255,188 266,084 264,374 411,786 421,219 416,750 422,806 416,938 423,626 442,874 459,315 466,147 5,510 9,680 4,473 3,202 3,635 3,786 2,129 328 3,977 132,252 280,237 498,986 8,144 169,003 200,159 224,912 221,107 234,506 247,057 50,692 58,324 70,027 68,174 70,570 75,884 262,330 298,324 293,771 293,771 97,815 61,003 60,926 183,798 36,334 Total interest income Total interest expense Net interest income Provision for loan and lease losses Total noninterest income Total noninterest expense Securities gains (losses) Income (loss) before income taxes and extraordinary items Applicable income taxes Extraordinary gains (losses), net Net income (loss) attrib Net income (loss) attributable to non- controlling interests Net income (loss) attributable to bank and non-controlling interests Net charge-offs Cash dividends Retained earnings 926 -183 212 -55 -11 -323 -87 -267 164 -101 118,412 141,042 154,312 152,247 163,439 170,509 164,091 236,766 232,772 147,12 825 610 785 630 486 341 336 288 236 237 119,237 141,652 113,292 82.210 77,938 96,412 40,474 44,631 155,097 53,542 92, 169 62,143 152,877 163,925 39,557 37,283 90,196 104,529 62,052 58,909 170,850 42,421 102,761 67,748 HE 164,427 237,053 233,008 233,008 46,808 47,504 52,164 121,413 164.802 182,407 42,678 71,964 50,365 233,008 147,362 54,112 84,029 63,097 3 114,225 134,514 151,756 150,652 161,367 168,512 162,997 237,076 229,633 140,600 1,194 779 556 408 298 265 318 186 194 232 Net operating income Number of unprofitable institutions Number of institutions with year-over-year earnings gains 4,868 4,781 3,669 4,127 3,907 3,828 3,155 4.288 3,314 2,649 Bank Balance sheet Assets and Liabilities of FDIC-Insured Commercial Banks and Savings Institutions (amounts in $ Millions) 2011 2012 2013 2014 2015 2016 2017 2018 2019 2020 7,357 7,083 6,812 6,509 6,182 5,913 5,670 5,406 5,177 5,002 Number of institutions reporting Total employees (full- time equivalent) 2,108,598 2,110,276 2,068,719 2,047,945 2,033,727 2,052,978 2,076,128 2,067,089 2,063,268 2,065,606 15,553,72 8 15,967,662 16,779,68 117,415,410 Total Assets 14,450,404 14,730,791 13,891,345 17,942,99 3 18.645,330 21,883,275 10,151,94 2 10,518,171 10,863,625 7,474,108 7,695,498 7,892,929 8,309,430 8,839,364 9.304,962 9.721,053 Total loans and leases Less: Reserve for possible losses 191,271 162,107 135,935 122,622 118,567 121,683 123,756 123,929 236,615 Net loans and leases Securities Available for sale 7,282,837 2,850,342 7,533,391 3,009,958 7,756,993 3,001,764 8,186,808 3,218,963 8,720,797 3,353,557 9,183,279 3,559,771 9,597,297 3,631,820 124,744 10,027,19 7 3,723,095 10,394,242 10,627,010 3,981,633 5,112,405 (fair value) 2,590,813 2,705,231 2,509,546 2,579,592 2,577,105 2,671,489 2,603,586 2,589,566 2.945,187 3,761,193 259,529 304,727 492,217 639,370 776,452 888,282 1,028,234 1,128,611 1,028,265 1,339,958 158,203 205,297 192,647 405,361 422,520 519,530 477,272 548,818 631,772 966,879 1,643,211 1,706,172 1,673,886 1,728,607 1,871,681 2,005,022 2,133,348 2,187,127 2,393,831 3,043,762 Held to maturity (amortized cost) U.S. Treasury securities Mortgage-backed securities State and municipal securities Equity securities Cash and due from depository institutions Federal funds sold and Reverse repurchase 314,614 217,826 15,638 261,506 16,637 291,923 14,282 341,170 11,149 360,291 9,554 369,664 9,558 329,616 2,993 313,360 743 375,934 N/A 14,049 1,289,142 465,267 1,426,119 508,049 1,705,256 425,773 1,921,812 358,038 1,757,590 364,820 1,810,001 400,479 1,916,161 430,361 1,694,545 621,510 1,667,340 562,754 3,188,569 782,672 5 121,571 121,508 120,635 120,300 19,689 0,19 125,945 129,828 187,409 188,468 46,049 38,470 30,208 21,982 14,704 10,933 8,457 6,687 5,709 4,627 agreements Bank premises and fixed assets Other real estate owned Trading account assets Intangible assets Goodwill Other Assets 717,023 368,005 286,342 751,109 723,811 366,538 291,079 722,560 615,954 368,318 289,580 705,891 655,625 360,176 294,210 710,025 541,621 360,397 298,642 734,488 551,523 369,231 306,029 774,269 569,216 383,391 322,351 752,761 571,950 398,759 334,390 769,421 659,042 408,838 349,599 778,362 746,147 386,755 339,163 846,623 Total liabilities and capital 13,891,345 14,450,404 14,730,791 15,553,72 8 15,967,662 11,764,00 4 12,190,024 16,779,68 1 17,415,410 12,894,56 4 13,399,208 17,942,99 3 18,645,329 21,883,275 13,866,21 1 14,535,278 17,823,563 10,186,404 10,817,477 11,192,210 1,428,392 1,370,355 1,401,102 1,317,751 1,393,446 1,282,072 10,370,55 7 10,907,951 1,245,644 11,648,91 1,253,325 1,315,315 1,533,819 12,612,88 6 13,219,964 16,289,744 8,758,011 9,447,122 9,791, 108 12,081,457 6,492,757 6,905,853 7,179,560 7,518,237 7,907,962 8,497,208 8,831,775 9,478,043 10,059,551 11,684,583 Deposits Foreign office deposits Domestic office deposits Interest-bearing deposits Noninterest-bearing deposits Estimated insured deposits Time deposits Brokered deposits Federal funds purchased & repurchase agreements 2,265,255 2,541,269 2,611,549 2,852,321 2,999,989 3,151,712 3,249,682 3,134,843 3,160,413 4,605,161 6,950,565 1,821,691 634,156 7,378,060 1,727,810 703,371 5,968,736 1,635,270 764,601 6,166,659 1,707,841 840,138 6,489,893 1,664,812 936,134 6,881,091 1,638,218 894,208 7,112,675 1,700,597 971,979 7,482,562 1,970,843 1,074,303 7,788,316 2,042,104 1,105,943 9,081,508 1,522,515 1,137,129 473,198 327,527 455,783 333,842 364,636 406,163 318,040 464,279 268,760 495,040 233,671 563,263 258,755 582,547 240,322 573,395 232,604 482,460 267,152 255,985 CHLB advances 536,684 462,777 448,145 521,223 541,419 523,990 549,408 554,614 587,195 470,888 Other borrowed money Banks liability on acceptances Subordinated debt N/A 133,052 N/A 118,023 N/A 99,618 N/A 98,083 N/A 91,597 N/A 83,904 N/A 68,928 NA 68,677 NA 69,952 N/A 68,230 6 Trading account liabilities Other liabilities 314,362 350,983 271,158 362,101 242,583 323, 174 246,313 333,592 244,346 366,833 14,910,57 227,627 370,905 203,817 420,361 295,669 351,526 13,812,82 4 1,740,904 287,368 483,104 235,925 381,248 15,920,39 1 2,022,602 12,322,209 1,569,136 12,821,161 1,629,243 13,076,529 1,654,261 14,166,746 1,800,917 15,457,379 1,958,031 16,531,666 19,656,291 2,113,663 2,226,984 1,869,110 1,550,807 1,613,685 1,642,973 1,733,528 1,794,339 1,862,945 1,953,692 2,019,130 2,110,782 2,224,378 Total liabilities Total equity capital Total bank equity capital Perpetual preferred stock Common stock Surplus Undivided profits Cumulative other comprehensive income Tier 1 leverage capital (PCA definition) Tier 1 risk based capital (PCA definition) Total risk based capital (PCA definition) 6,156 45,270 1,137,060 362,359 5,759 44,457 1,134,950 413,176 5,846 43,914 1,144,390 474,358 5,591 43,990 1,160,649 534,401 9,478 43,290 1,180,676 588,273 10,151 42,733 1,202,678 651,080 9,400 42,824 1,256,166 686,989 9,016 42,597 1,277,372 759,375 9,380 42,340 1,291,352 789,690 10,415 41,328 1,315,748 818,566 979 16,342 -24,588 -10,065 -26,523 -42.875 -40.941 -68,421 -20,963 39,322 1,217,793 1,262,832 1,337,602 1,419,350 1,488,612 1,556,729 1,628,222 1,685,068 1,736,859 1,866,167 1,217,526 1,262,832 1,337,602 1,419,350 1,488,612 1,556,729 1,628,222 1,685,068 1,736,859 1,866,167 1,432,373 1,458,005 1,520,591 1,578,957 1,656,020 1,715,257 1,790,824 1,858,003 1,913,554 1,973,328 100,902 88,887 75,892 69,976 64,252 65,682 67,583 65,400 67,593 63,210 Loans and leases 30-89 days past due Loans and leases 90 days or more past due 133,583 123,666 96,665 75,601 60,738 53,770 51,050 42,132 40,154 44,195 180,088 153.210 110,595 87,051 77,175 78,243 65,370 58,151 55.259 84,678 Loans and leases in nonaccrual status Restructured and current loans and leases Income earned, not collected on loans 129,387 104,856 99,209 84,032 72,256 65,503 60,221 55,738 48,286 49,323 46,304 44,057 42,336 42,477 43,903 46,920 52,650 58.090 57,938 57,199 Earning assets 13,882,51 5 14.353.353 15,103,30 415,760,886 12,073,600 12,682,068 13,075,959 16,255,71 7 16,871,072 19,920,261 7 5,711,934 5,833,333 6,120,553 6,488,525 6,914,898 7,202,404 7,516,185 7,819,727 8,226,152 8,444,142 461,155 436.797 422,808 414,968 411,182 415,556 419,030 423,320 430,128 425,087 3,137,583 3,114,783 3,172,409 3,231,064 3,343,067 3,567,866 3,739,119 3,836,282 3,981,819 3,969,393 Unused loan commitments - total Unused home equity lines Unused credit card huse lines Unused commercial real estate lines usato All other unused loan commitments Onuso Unused unsecured commercial real 147,527 190,852 250,036 301,957 353,175 388,466 412,900 447,588 484,464 478,350 1,885,902 2,090,901 2,275,301 2,540,535 2,807,474 2,830,516 2,945,135 3,112,537 3,329,742 3,571,313 estate lines 37,630 40,974 54.050 60,104 60.209 71.816 81.348 91.002 102,775 101,013 Unused securities underwriting commitments 223 321 509 415 303 327 9 12 33 0 Bank income statement 2011 2012 2013 2014 2015 2016 2017 2018 2019 2020 Number of institutions reporting 7,357 7,083 6,812 6,509 6,182 5,913 5,670 5,406 5,177 5,002 507,533 486,672 470,374 469,778 478,504 515,793 572,276 661,060 705,398 84,835 65,902 53,286 47,128 46.875 54,391 73,254 119,799 158,731 422,698 420,769 417,088 422,651 431,629 461,402 499,022 541,261 546,668 603,753 77,098 526,655 77,555 57,794 32,418 29,799 37,139 48,097 51,135 50,034 55,101 230,136 248,723 252,519 247,858 253,318 253,591 255,188 266,084 264,374 411,786 421,219 416,750 422,806 416,938 423,626 442,874 459,315 466,147 5,510 9,680 4,473 3,202 3,635 3,786 2,129 328 3,977 132,252 280,237 498,986 8,144 169,003 200,159 224,912 221,107 234,506 247,057 50,692 58,324 70,027 68,174 70,570 75,884 262,330 298,324 293,771 293,771 97,815 61,003 60,926 183,798 36,334 Total interest income Total interest expense Net interest income Provision for loan and lease losses Total noninterest income Total noninterest expense Securities gains (losses) Income (loss) before income taxes and extraordinary items Applicable income taxes Extraordinary gains (losses), net Net income (loss) attrib Net income (loss) attributable to non- controlling interests Net income (loss) attributable to bank and non-controlling interests Net charge-offs Cash dividends Retained earnings 926 -183 212 -55 -11 -323 -87 -267 164 -101 118,412 141,042 154,312 152,247 163,439 170,509 164,091 236,766 232,772 147,12 825 610 785 630 486 341 336 288 236 237 119,237 141,652 113,292 82.210 77,938 96,412 40,474 44,631 155,097 53,542 92, 169 62,143 152,877 163,925 39,557 37,283 90,196 104,529 62,052 58,909 170,850 42,421 102,761 67,748 HE 164,427 237,053 233,008 233,008 46,808 47,504 52,164 121,413 164.802 182,407 42,678 71,964 50,365 233,008 147,362 54,112 84,029 63,097 3 114,225 134,514 151,756 150,652 161,367 168,512 162,997 237,076 229,633 140,600 1,194 779 556 408 298 265 318 186 194 232 Net operating income Number of unprofitable institutions Number of institutions with year-over-year earnings gains 4,868 4,781 3,669 4,127 3,907 3,828 3,155 4.288 3,314 2,649


