Answered step by step
Verified Expert Solution
Link Copied!

Question

1 Approved Answer

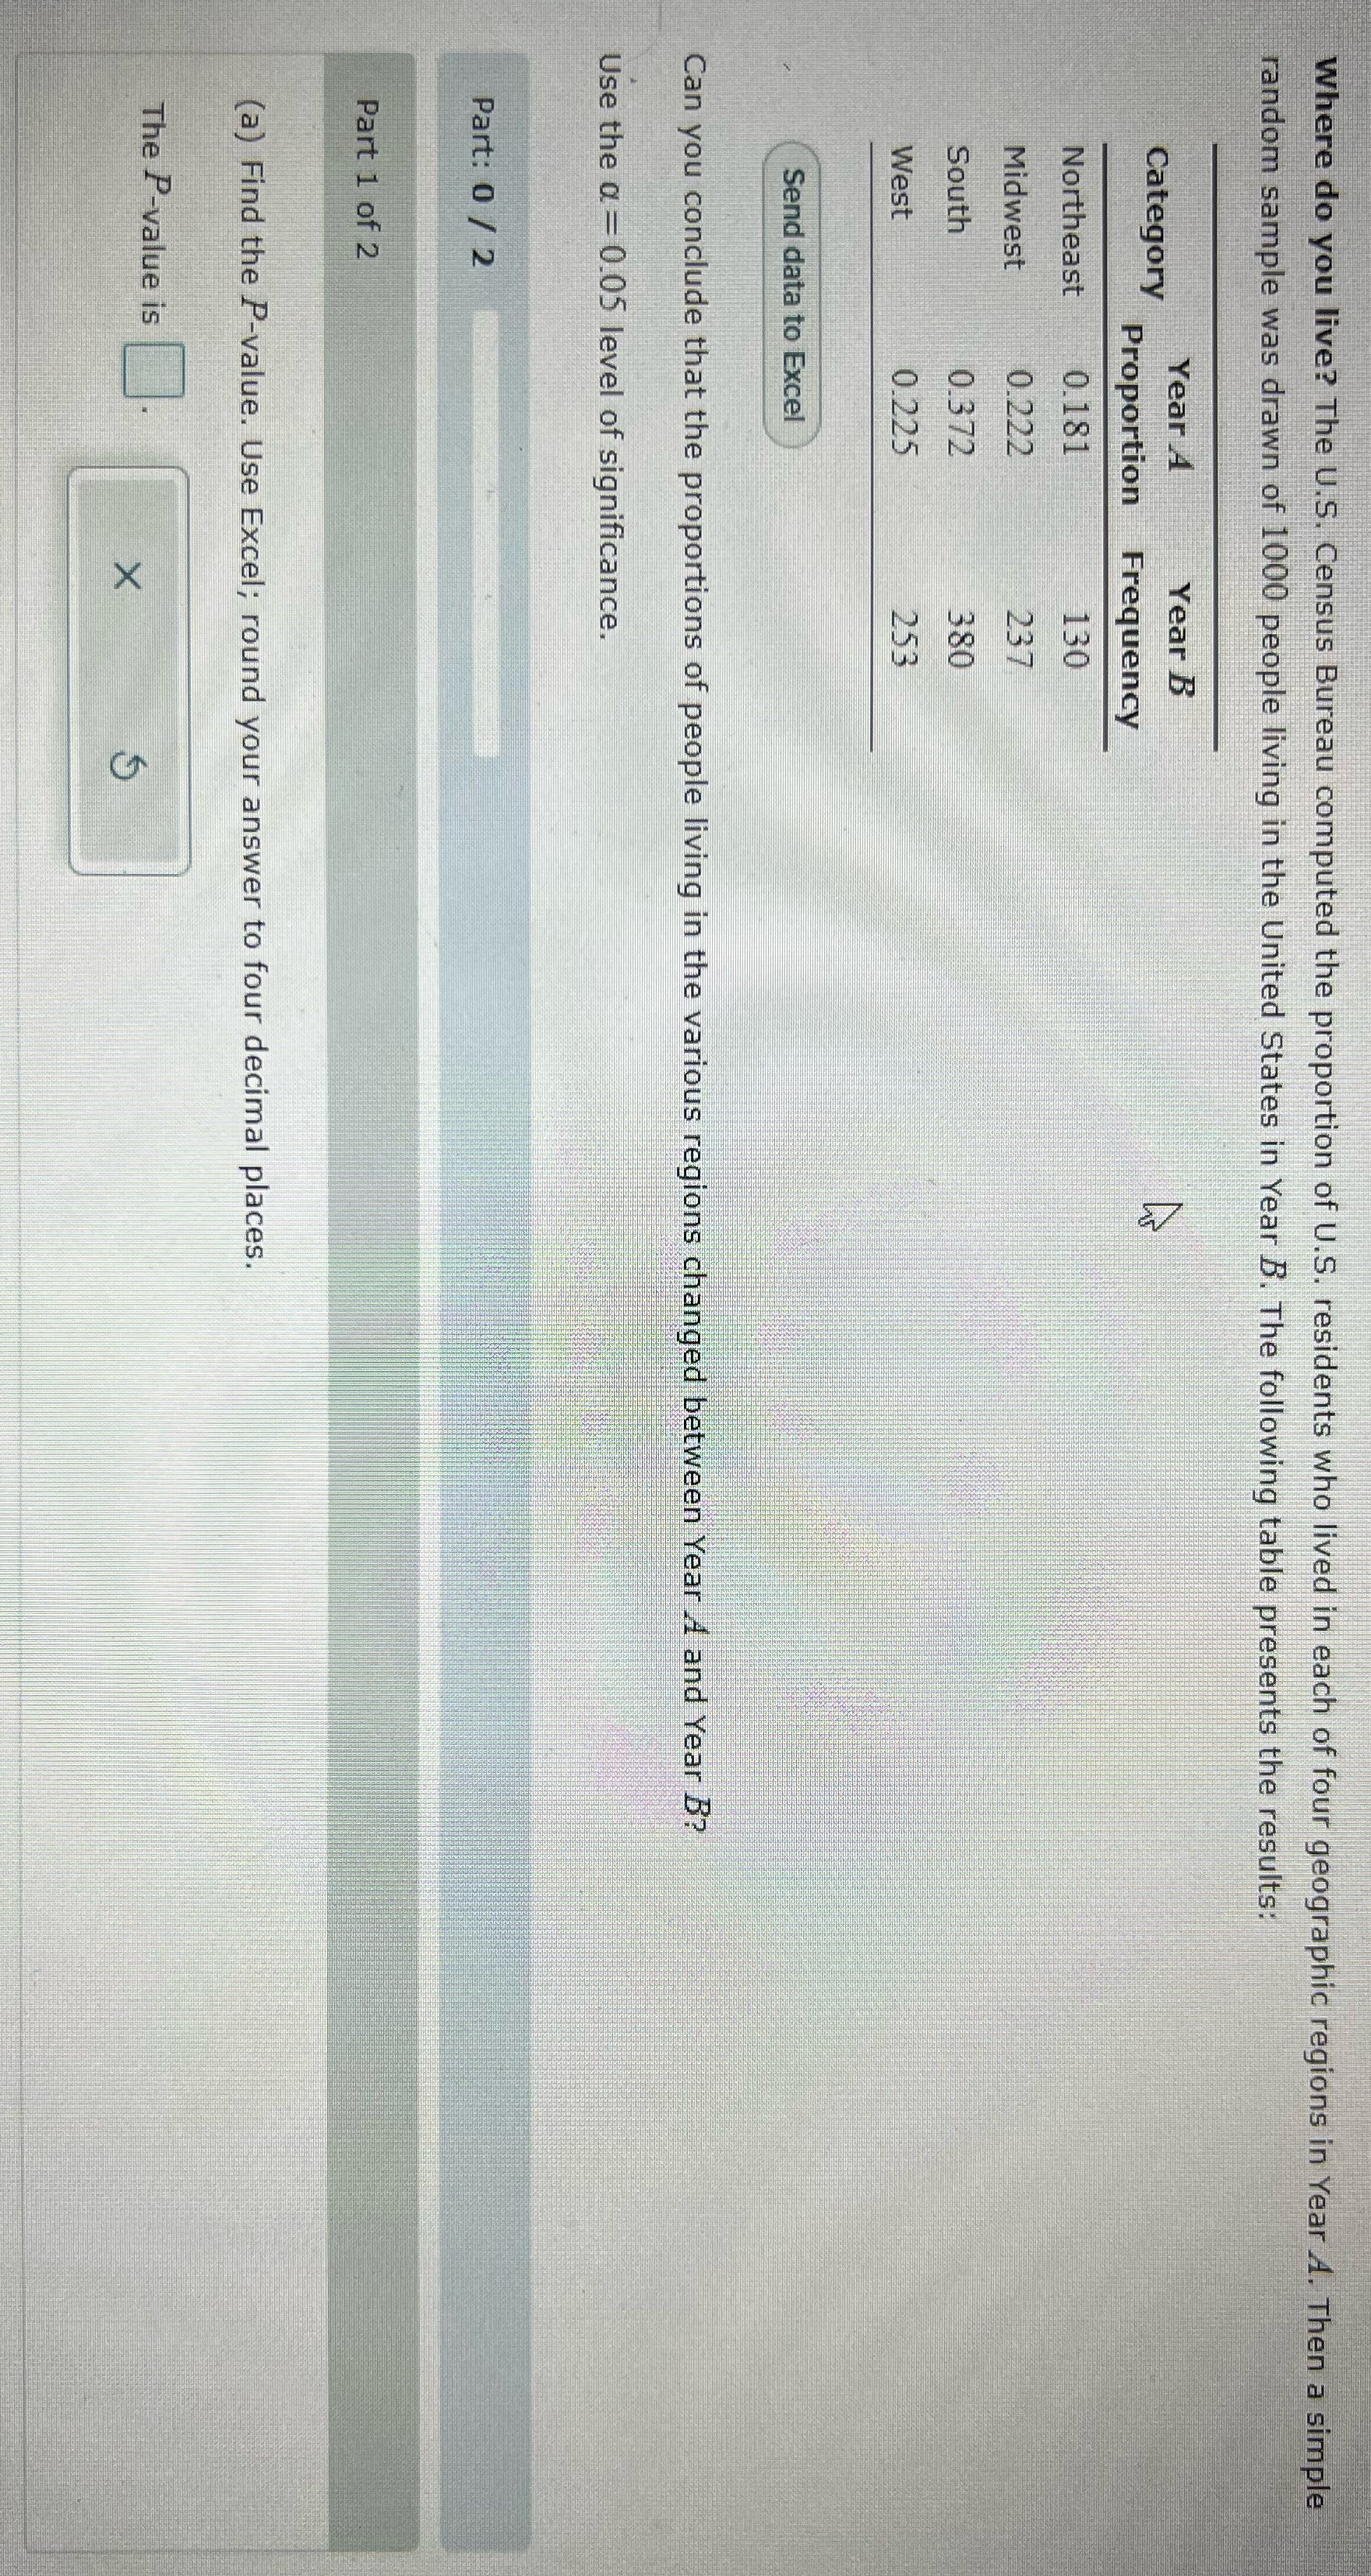
Assistance please Where do you live? The U.S. Census Bureau computed the proportion of U.S. residents who lived in each of four geographic regions in

Assistance please

image text in transcribed
Where do you live? The U.S. Census Bureau computed the proportion of U.S. residents who lived in each of four geographic regions in Year A. Then a simple random sample was drawn of 1000 people living in the United States in Year B. The following table presents the results: Year A Year B Category 4 Proportion Frequency Northeast 0.181 130 Midwest 0.222 237 South 0.372 380 West 0.225 253 Send data to Excel Can you conclude that the proportions of people living in the various regions changed between Year A and Year B? Use the a = 0.05 level of significance. Part: 0 / 2 Part 1 of 2 (a) Find the P-value. Use Excel; round your answer to four decimal places. The P-value is X

Step by Step Solution

There are 3 Steps involved in it

Step: 1

blur-text-image

Get Instant Access to Expert-Tailored Solutions

See step-by-step solutions with expert insights and AI powered tools for academic success

Step: 2

blur-text-image

Step: 3

blur-text-image

Ace Your Homework with AI

Get the answers you need in no time with our AI-driven, step-by-step assistance

Get Started

Recommended Textbook for

College Algebra Concepts Through Functions

Authors: Michael Sullivan, Michael Sullivan III

3rd Edition

0321925890, 9780321925893

More Books

Students also viewed these Mathematics questions