Question
Assume that both products are purchased from a supplier, and there is a $200 transactioncost for each order. This cost is the same for either
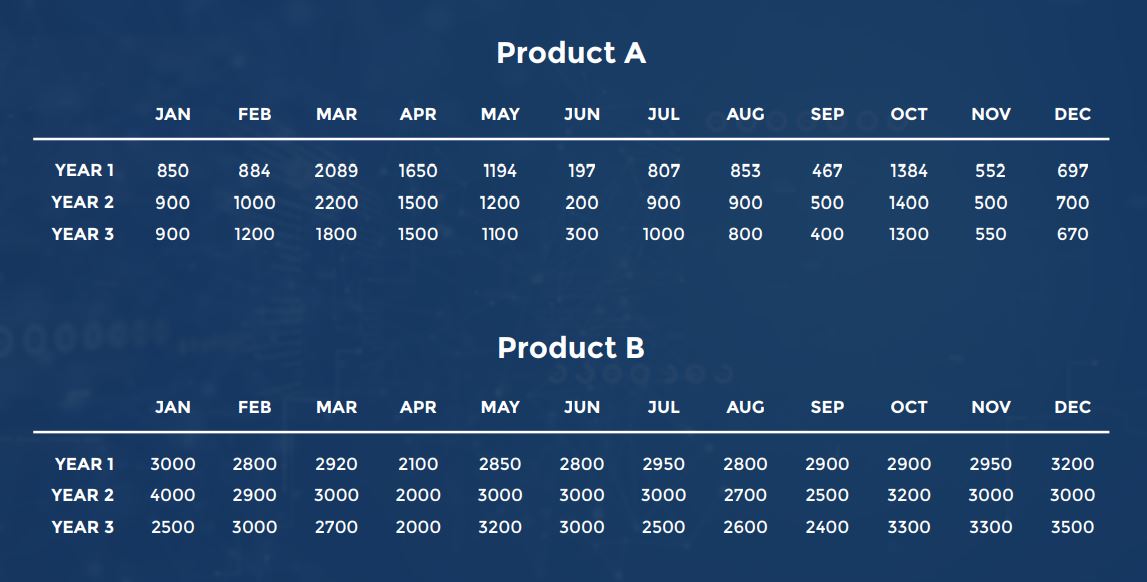
Assume that both products are purchased from a supplier, and there is a $200 transactioncost for each order. This cost is the same for either product. Holding cost for inventory ofthe item is dependent on the value of the product, and it is estimated to 5% of the unit costfor Product A and 1% of the unit cost for Product B. The full-price paid to the supplier is$53/unit for Product A and $2/unit for Product B. In other words, Product B is a muchcheaper product than Product A. Assume that demand for the products occur steadilythroughout the year but the monthly forecasts in the embedded spreadsheet show the levelof expected sales in a month. The average lead time of supply, counted as the time betweenwhen an order is placed to the supplier to the time when the company receives the order, is6 days. Assume that the lead time is the same for both products.
| Product A | ||||||||||||
| Year | Jan | Feb | Mar | Apr | May | June | July | Aug | Sept | Oct | Nov | Dec |
| 1 | 850 | 884 | 2089 | 1650 | 1194 | 197 | 807 | 853 | 467 | 1384 | 552 | 697 |
| 2 | 900 | 1000 | 2200 | 1500 | 1200 | 200 | 900 | 900 | 500 | 1400 | 500 | 700 |
| 3 | 900 | 1200 | 1800 | 1500 | 1100 | 300 | 1000 | 800 | 400 | 1300 | 550 | 670 |
| Product B | ||||||||||||
| Year | Jan | Feb | Mar | Apr | May | June | July | Aug | Sept | Oct | Nov | Dec |
| 1 | 3000 | 2800 | 2920 | 2100 | 2850 | 2800 | 2950 | 2800 | 2900 | 2900 | 2950 | 3200 |
| 2 | 4000 | 2900 | 3000 | 2000 | 3000 | 3000 | 3000 | 2700 | 2500 | 3200 | 3000 | 3000 |
| 3 | 2500 | 3000 | 2700 | 2000 | 3200 | 3000 | 2500 | 2600 | 2400 | 3300 | 3300 | 3500 |
Given:
C0=200
Carrying Cost Product A= 5%
Carrying Cost Product B= 1%
Cost of Product A= $53
Cost of Product B= $2
Part A

Product A JAN FEB MAR APR MAY JUN JUL AUG SEP OCT NOV DEC YEAR 1 850 884 2089 1650 1194 197 807 853 467 1384 552 697 YEAR 2 900 1000 2200 1500 1200 200 900 900 500 1400 500 700 YEAR 3 900 1200 1800 1500 1100 300 1000 800 400 1300 550 670 0000000 Product B JAN FEB MAR APR MAY JUN JUL AUG SEP OCT NOV DEC YEAR 1 3000 2800 2920 2100 2850 2800 2950 2800 2900 2900 2950 3200 YEAR 2 4000 2900 3000 2000 3000 3000 3000 2700 2500 3200 3000 3000 YEAR 3 2500 3000 2700 2000 3200 3000 2500 2600 2400 3300 3300 3500
Step by Step Solution
There are 3 Steps involved in it
Step: 1

Get Instant Access to Expert-Tailored Solutions
See step-by-step solutions with expert insights and AI powered tools for academic success
Step: 2

Step: 3

Ace Your Homework with AI
Get the answers you need in no time with our AI-driven, step-by-step assistance
Get Started


