Answered step by step
Verified Expert Solution
Question
1 Approved Answer
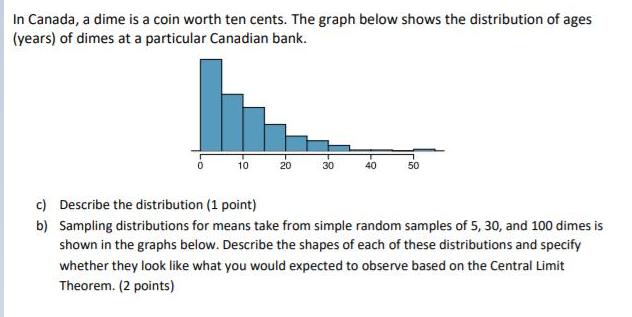
In Canada, a dime is a coin worth ten cents. The graph below shows the distribution of ages (years) of dimes at a particular


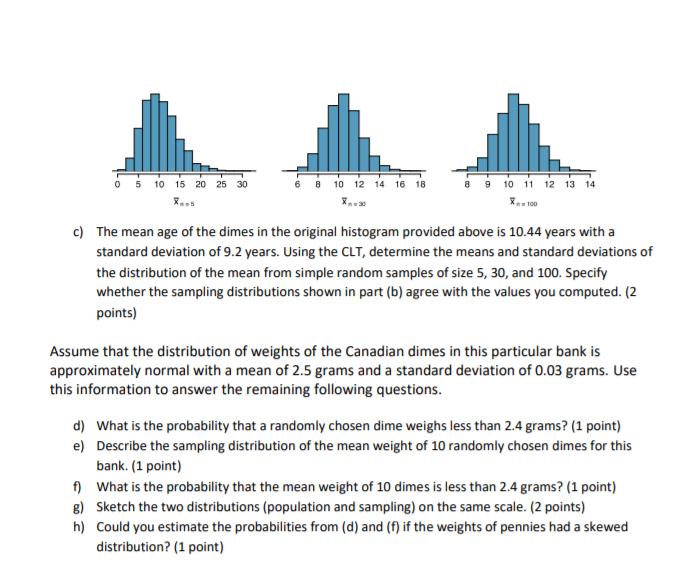
In Canada, a dime is a coin worth ten cents. The graph below shows the distribution of ages (years) of dimes at a particular Canadian bank. 10 20 30 40 50 c) Describe the distribution (1 point) b) Sampling distributions for means take from simple random samples of 5, 30, and 100 dimes is shown in the graphs below. Describe the shapes of each of these distributions and specify whether they look like what you would expected to observe based on the Central Limit Theorem. (2 points) 0 5 10 15 20 25 30 6 8 10 12 14 16 18 9 10 11 12 13 14 c) The mean age of the dimes in the original histogram provided above is 10.44 years with a standard deviation of 9.2 years. Using the CLT, determine the means and standard deviations of the distribution of the mean from simple random samples of size 5, 30, and 100. Specify whether the sampling distributions shown in part (b) agree with the values you computed. (2 points) Assume that the distribution of weights of the Canadian dimes in this particular bank is approximately normal with a mean of 2.5 grams and a standard deviation of 0.03 grams. Use this information to answer the remaining following questions. d) What is the probability that a randomly chosen dime weighs less than 2.4 grams? (1 point) e) Describe the sampling distribution of the mean weight of 10 randomly chosen dimes for this bank. (1 point) ) What is the probability that the mean weight of 10 dimes is less than 2.4 grams? (1 point) 8) Sketch the two distributions (population and sampling) on the same scale. (2 points) h) Could you estimate the probabilities from (d) and (f) if the weights of pennies had a skewed distribution? (1 point)
Step by Step Solution
★★★★★
3.48 Rating (158 Votes )
There are 3 Steps involved in it
Step: 1
Solution Backup Theory If a random variable X N 2 ie X has Normal Distribution with mean and varianc...
Get Instant Access to Expert-Tailored Solutions
See step-by-step solutions with expert insights and AI powered tools for academic success
Step: 2

Step: 3

Ace Your Homework with AI
Get the answers you need in no time with our AI-driven, step-by-step assistance
Get Started


