Question
Assume that the graphical checks of problem 3 above are satisfactory. Then for the data given in problem 3 a. Calculate the estimated variance


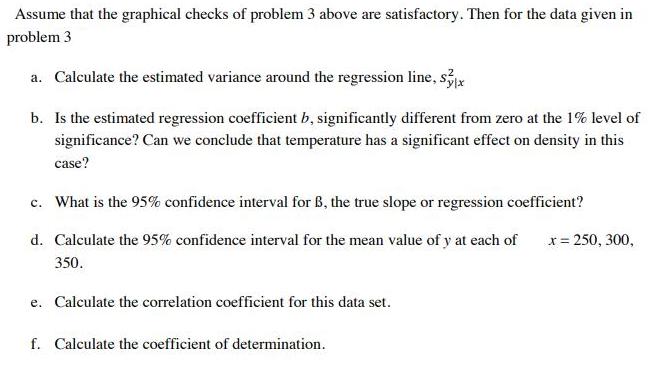
Assume that the graphical checks of problem 3 above are satisfactory. Then for the data given in problem 3 a. Calculate the estimated variance around the regression line, s3x b. Is the estimated regression coefficient b, significantly different from zero at the 1% level of significance? Can we conclude that temperature has a significant effect on density in this case? c. What is the 95% confidence interval for B, the true slope or regression coefficient? d. Calculate the 95% confidence interval for the mean value of y at each of x = 250, 300, 350. e. Calculate the correlation coefficient for this data set. f. Calculate the coefficient of determination. 3. The density of molten salt mixtures, y g/cm, was measured at various temperatures xC. The results were: y 250 1.955 270 1.935 290 1.890 310 1.920 330 1.895 350 1.865
Step by Step Solution
3.41 Rating (179 Votes )
There are 3 Steps involved in it
Step: 1

Get Instant Access to Expert-Tailored Solutions
See step-by-step solutions with expert insights and AI powered tools for academic success
Step: 2

Step: 3

Ace Your Homework with AI
Get the answers you need in no time with our AI-driven, step-by-step assistance
Get StartedRecommended Textbook for
Probability And Statistical Inference
Authors: Robert V. Hogg, Elliot Tanis, Dale Zimmerman
9th Edition
321923278, 978-0321923271
Students also viewed these Mathematics questions
Question
Answered: 1 week ago
Question
Answered: 1 week ago
Question
Answered: 1 week ago
Question
Answered: 1 week ago
Question
Answered: 1 week ago
Question
Answered: 1 week ago
Question
Answered: 1 week ago
Question
Answered: 1 week ago
Question
Answered: 1 week ago
Question
Answered: 1 week ago
Question
Answered: 1 week ago
Question
Answered: 1 week ago
Question
Answered: 1 week ago
Question
Answered: 1 week ago
Question
Answered: 1 week ago
Question
Answered: 1 week ago
Question
Answered: 1 week ago
Question
Answered: 1 week ago
Question
Answered: 1 week ago
Question
Answered: 1 week ago
Question
Answered: 1 week ago
View Answer in SolutionInn App


