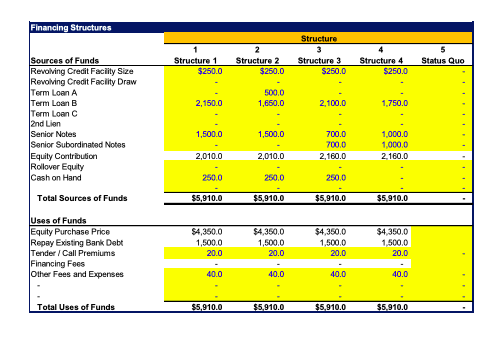
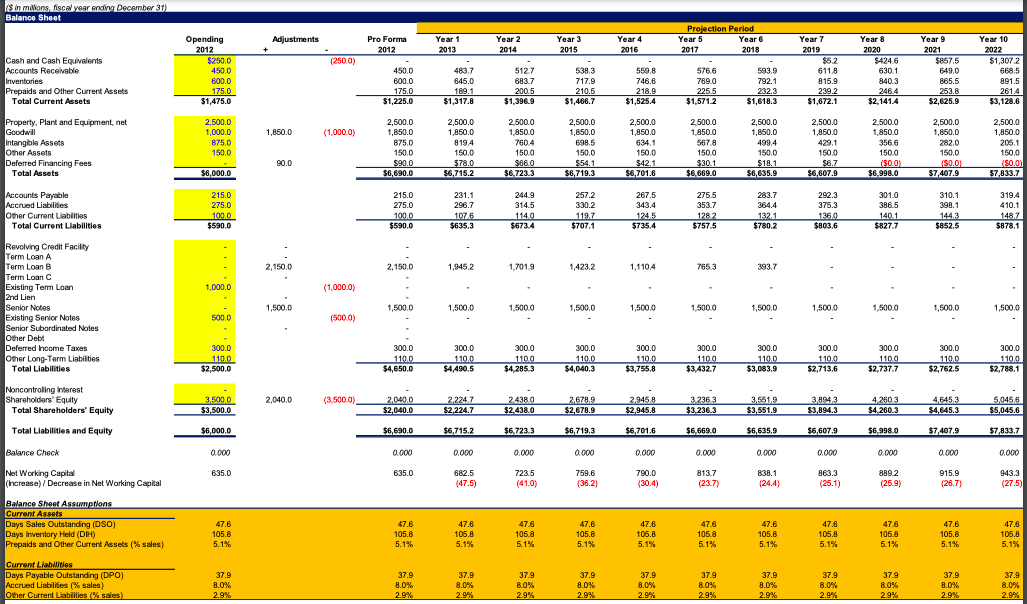
Assume that the investor was only able to obtain $1.5 billion in term loan B and $1 billion in senior notes. Keeping all other assumptions equal, assume that the investor expects to be able to increase the exitEV/EBITDA multiple by 1.5x, (for example, from 8.0x to 9.5x)if the exit is delayed by 2 years. What is the change in the IRR of the LBO investment in ValueCo?


Financing Structures Structure 2 Structure 2 $250.0 Structure 1 $250.0 Structure 3 $250.0 Structure 4 $250.0 Status Quo 500,0 1,650.0 2,150.0 2,100.0 1,750.0 Sources of Funds Revolving Credit Faclity Size Revolving Credit Facility Draw Term Loan A Term Loan B Term Loan C 2nd Lien Senior Notes Senior Subordinated Notes Equity Contribution Rollover Equity Cash on Hand 1,500.0 1,500.0 700.0 700.0 2,160.0 1,000.0 1,000,0 2,160.0 2,010.0 2010.0 250.0 250.0 250.0 Total Sources of Funds $5,910.0 $5,910.0 $5,910.0 $5.910.0 Uses of Funds Equity Purchase Price Repay Existing Bank Debt Tender / Call Premiums Financing Fees Other Fees and Expenses $4,350.0 1,500.0 20.0 $4,350.0 1,500.0 20.0 $4,350.0 1,500.0 20.0 $4,350.0 1,500,0 20.0 40.0 40.0 40.0 40.0 Total Uses of Funds $5,910.0 $5,910.0 $5.910.0 $5.910.0 Adjustments Pro Forma Year 3 Projection Period Year ear 483 593.9 611 5121 200.5 538 2105 550.8 218.9 576.6 225.5 189 2,500.0 2,500.0 2,500.0 2.500.0 2,500.0 2,500.0 2.500.0 1,850. 2.500.0 090. 150,0 2,500.0 so 150.0 $18.9 2.500 ser 150.0 $86 150.0 $54.1 150.0 3042 150.0 150,0 $6,635.9 $5,607.9 215.0 3194 231.1 $6353 204.9 Samoa 2572 1127 3238 134,5 2755 1382 3021 1321 3758 135.0 100.0 SAYA 2,150,0 2,150.0 1,945.2 1,701,9 1,423.2 1,110,4 7653 393.7 (1,000.0) 1,500,0 1,500.0 15000 1.500 1,500.0 1.5000 1,500.0 1.500.0 1,500 1.5000 1,500,0 1,500.0 (5000) 300.0 110 300 54.490 300 S425 a 300. 300.0 40403 $3,7553 300.0 $3,4327 300.0 $3,083.9 1102 1100 1100 2.224 2.4380 2.6789 $6,000.0 $6.715.2 $6,7233 $6,635.9 $6,607.3 6,998.0 $7,407.9 $7,833.7 $6,690.0 0.000 635.0 $6,719.3 0.000 $6,701,6 0.000 0.000 0.001 0.000 $6,669.0 0.000 8137 0.000 Not Working Capital in Net Working Capital 0.000 863.3 635.0 682,5 7238 7589 7800 8581 996.9 943.3 Balance Sheet Assumptions Days Sales Outstanding (DSO) 1058 Day de sud Other Current Assets (5 sales) Financing Structures Structure 2 Structure 2 $250.0 Structure 1 $250.0 Structure 3 $250.0 Structure 4 $250.0 Status Quo 500,0 1,650.0 2,150.0 2,100.0 1,750.0 Sources of Funds Revolving Credit Faclity Size Revolving Credit Facility Draw Term Loan A Term Loan B Term Loan C 2nd Lien Senior Notes Senior Subordinated Notes Equity Contribution Rollover Equity Cash on Hand 1,500.0 1,500.0 700.0 700.0 2,160.0 1,000.0 1,000,0 2,160.0 2,010.0 2010.0 250.0 250.0 250.0 Total Sources of Funds $5,910.0 $5,910.0 $5,910.0 $5.910.0 Uses of Funds Equity Purchase Price Repay Existing Bank Debt Tender / Call Premiums Financing Fees Other Fees and Expenses $4,350.0 1,500.0 20.0 $4,350.0 1,500.0 20.0 $4,350.0 1,500.0 20.0 $4,350.0 1,500,0 20.0 40.0 40.0 40.0 40.0 Total Uses of Funds $5,910.0 $5,910.0 $5.910.0 $5.910.0 Adjustments Pro Forma Year 3 Projection Period Year ear 483 593.9 611 5121 200.5 538 2105 550.8 218.9 576.6 225.5 189 2,500.0 2,500.0 2,500.0 2.500.0 2,500.0 2,500.0 2.500.0 1,850. 2.500.0 090. 150,0 2,500.0 so 150.0 $18.9 2.500 ser 150.0 $86 150.0 $54.1 150.0 3042 150.0 150,0 $6,635.9 $5,607.9 215.0 3194 231.1 $6353 204.9 Samoa 2572 1127 3238 134,5 2755 1382 3021 1321 3758 135.0 100.0 SAYA 2,150,0 2,150.0 1,945.2 1,701,9 1,423.2 1,110,4 7653 393.7 (1,000.0) 1,500,0 1,500.0 15000 1.500 1,500.0 1.5000 1,500.0 1.500.0 1,500 1.5000 1,500,0 1,500.0 (5000) 300.0 110 300 54.490 300 S425 a 300. 300.0 40403 $3,7553 300.0 $3,4327 300.0 $3,083.9 1102 1100 1100 2.224 2.4380 2.6789 $6,000.0 $6.715.2 $6,7233 $6,635.9 $6,607.3 6,998.0 $7,407.9 $7,833.7 $6,690.0 0.000 635.0 $6,719.3 0.000 $6,701,6 0.000 0.000 0.001 0.000 $6,669.0 0.000 8137 0.000 Not Working Capital in Net Working Capital 0.000 863.3 635.0 682,5 7238 7589 7800 8581 996.9 943.3 Balance Sheet Assumptions Days Sales Outstanding (DSO) 1058 Day de sud Other Current Assets (5 sales)


