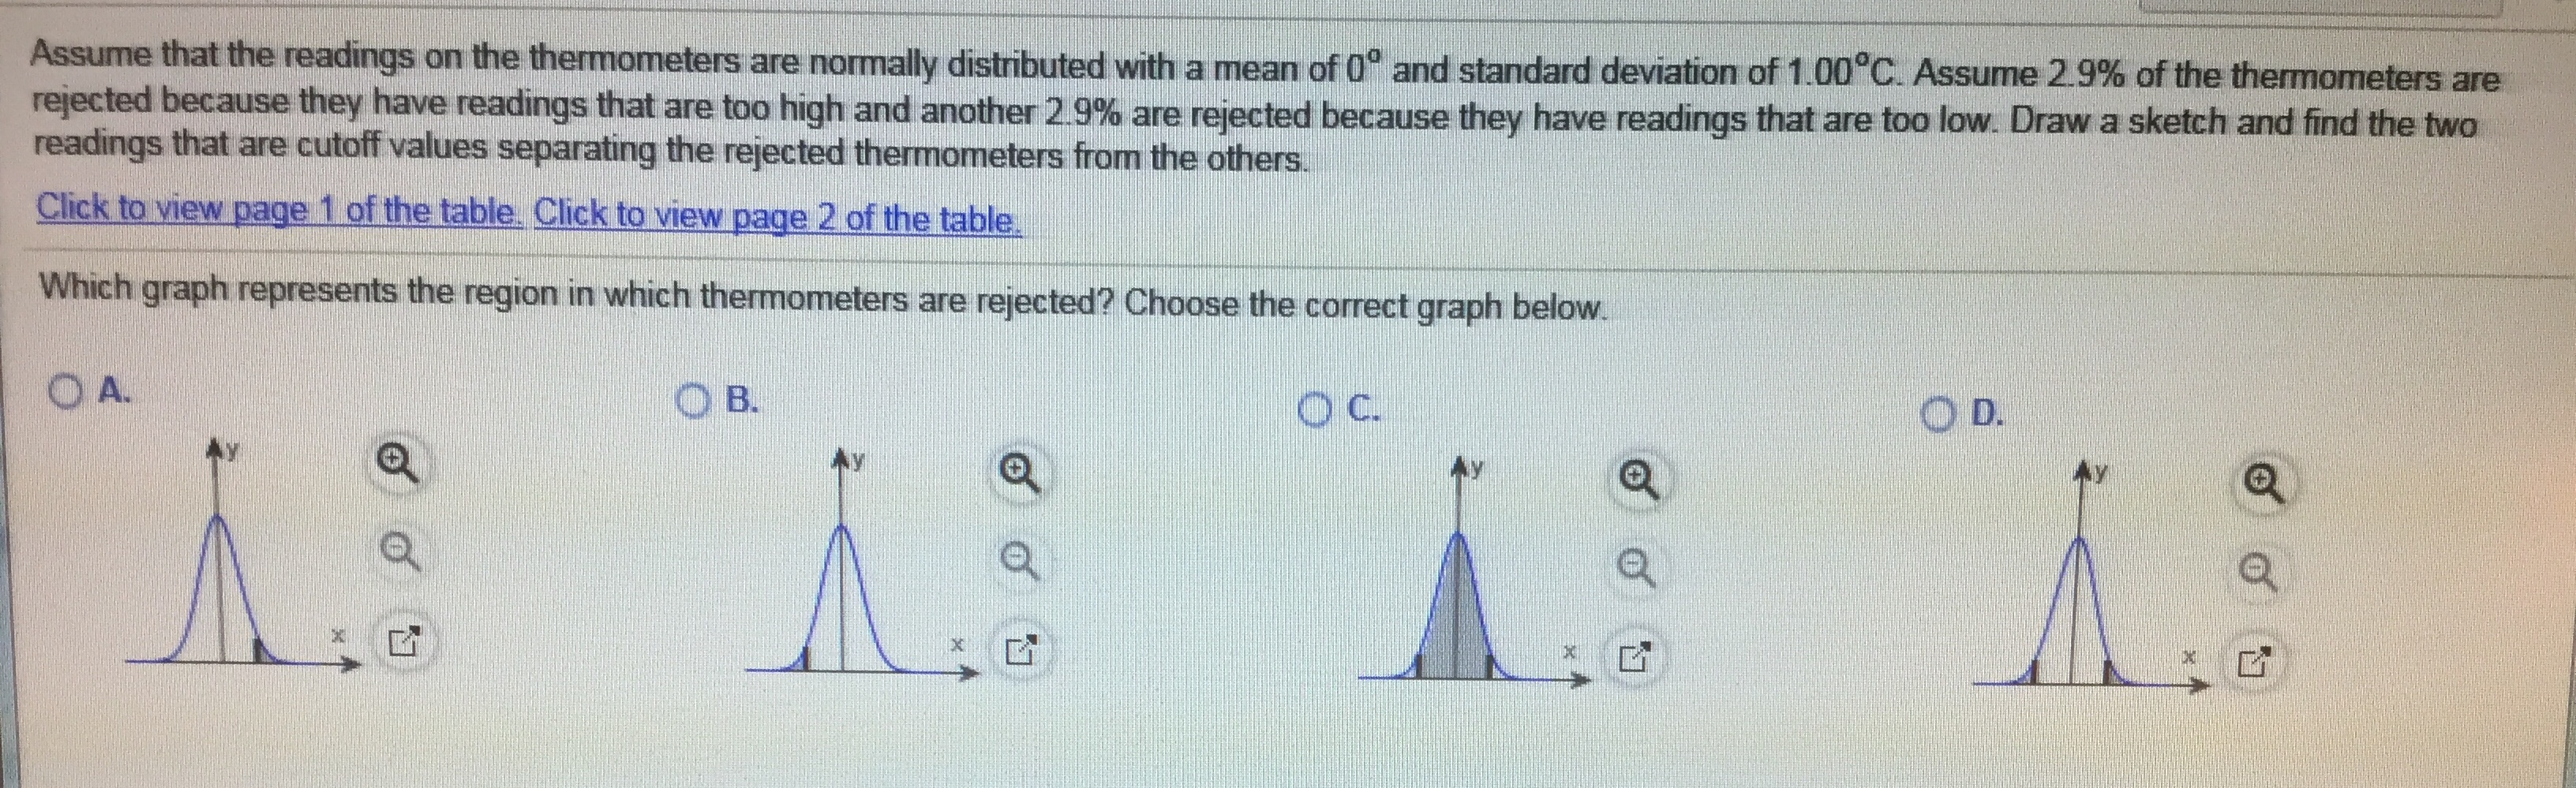
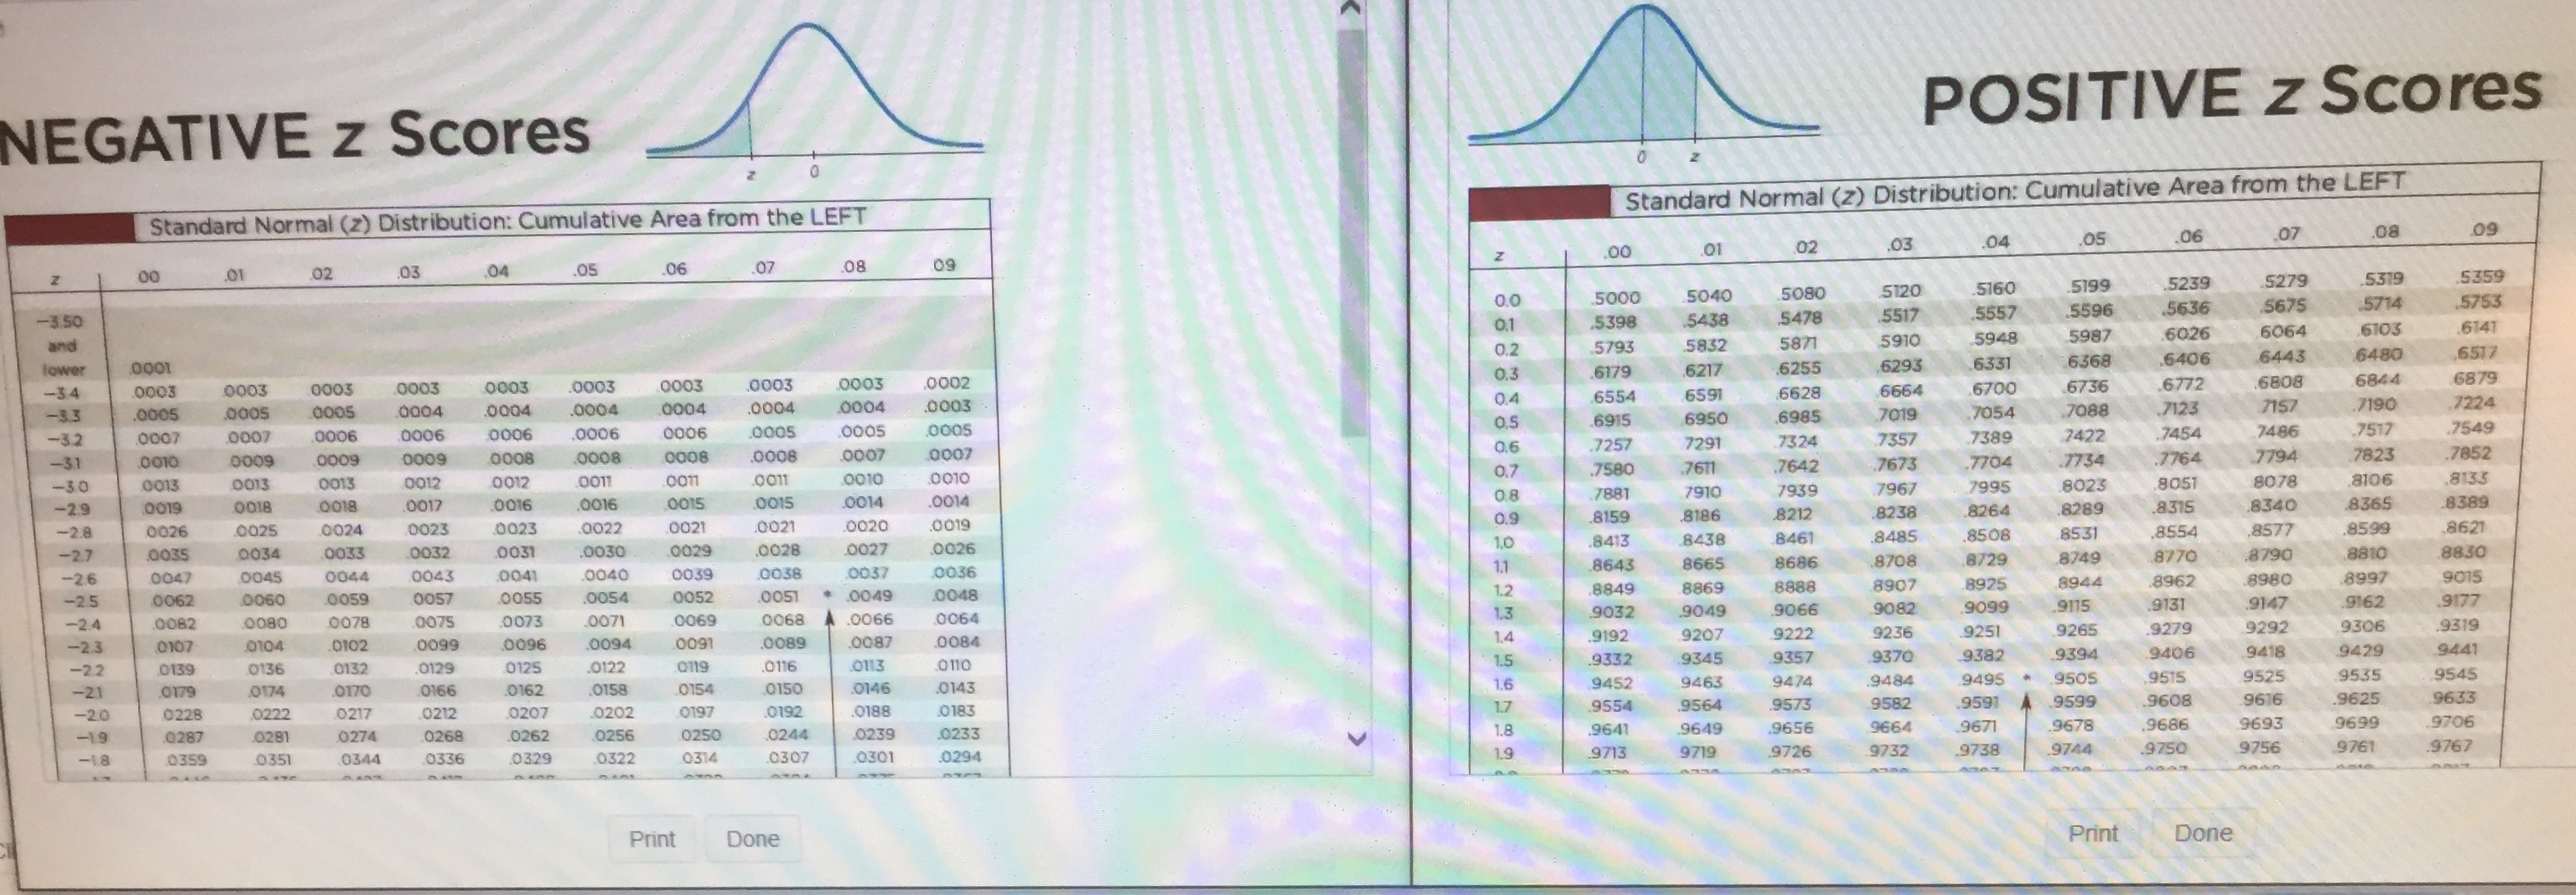
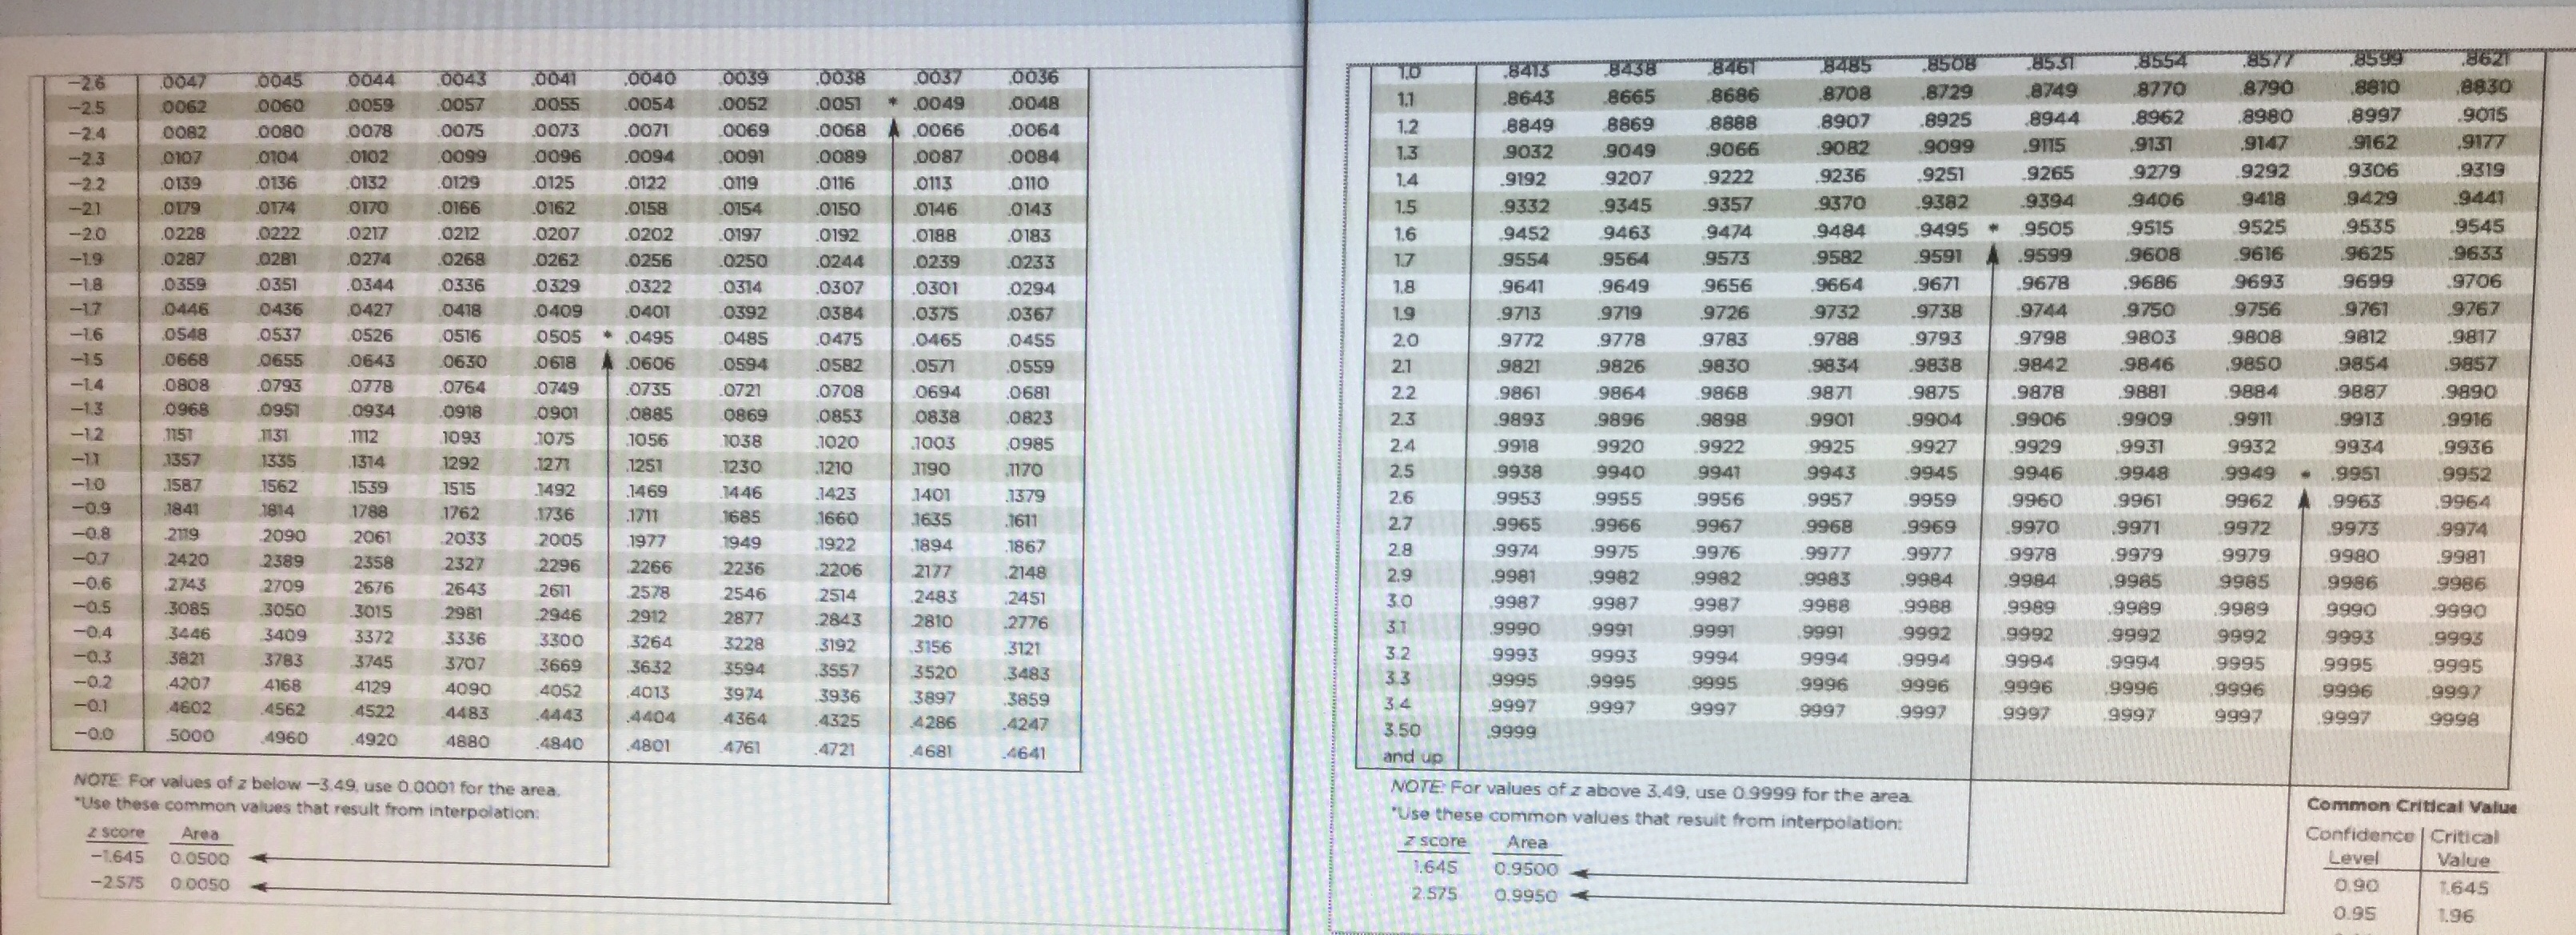
Assume that the readings on the thermometers are normally distributed with a mean of 0" and standard deviation of 1.00"C. Assume 2.9% of the thermometers are rejected because they have readings that are too high and another 2.9% are rejected because they have readings that are too low. Draw a sketch and find the two readings that are cutoff values separating the rejected thermometers from the others. Click to view page 1 of the table. Click to view page 2 of the table. Which graph represents the region in which thermometers are rejected? Choose the correct graph below. OA. OB. OC OD. X XPOSITIVE z Scores NEGATIVE z Scores Standard Normal (z) Distribution: Cumulative Area from the LEFT Standard Normal (z) Distribution: Cumulative Area from the LEFT .06 02 03 05 _07 OO .07 .08 09 5199 5319 OO .01 02 .03 .04 .05 _06 5120 0.0 5000 5160 567 0.1 5398 5438 5478 5517 5557 5987 6064 6103 6141 0.2 5793 5832 5871 6293 6331 6406 6480 6517 0.3 6179 6217 6591 6700 6736 6772 6808 0003 6628 1224 DO03 000 0003 0003 0003 0003 0.4 6554 6985 7019 7123 7157 DOOS 0005 0004 000 0.5 .6915 6950 7454 7486 751 7549 0007 0006 DO05 0005 0005 2007 0007 0007 0.6 .7257 729 7324 7357 7794 7852 0009 0009 0008 0008 0.7 7671 7995 805 8106 8135 0013 0013 0012 001 DO17 9010 0010 0013 0.8 7881 7910 7939 7967 -30 8340 8389 -29 0018 0018 DO1 0016 0015 0014 0.9 815 8186 8212 8238 8315 8508 8531 .8554 8577 8621 0019 -2.8 0026 0025 0024 002 0023 0022 0021 0021 DO20 1.0 .8413 8461 8790 8830 -27 0034 003 0030 002 0027 0026 8643 8686 8749 9015 004 004 0040 0039 0038 1.1 0041 1.2 8849 8869 8907 8944 8997 9115 .9131 9147 -25 0062 005S 0055 0049 0048 9032 9319 -2.4 0080 0078 0071 0069 0068 0066 1.4 919 9207 9222 9236 9251 9265 9279 9292 9306 -2.3 0104 0099 0096 0094 0091 0089 0084 1.5 9345 9357 9370 9382 9394 9418 139 0129 0125 0122 Q119 0113 0110 0136 013 0116 9463 9474 9484 9495 0174 0170 0166 .0162 0158 0154 0150 0146 0143 1.7 9573 9582 959 0222 0217 0212 0207 0202 0197 0192 .0188 0183 9656 9664 9693 9699 9649 0281 0274 0268 0262 0256 .0244 0239 964 9713 9719 9726 9732 9738 974 9750 9756 9761 .9767 0359 0351 0344 0336 0329 0322 0314 0307 0301 Print Done Print Done8485 8708 8749 8770 8830 1.1 8944 8962 8997 6045 004 0057 0055 0051 .0049 1.2 8849 8907 3059 9099 9131 1073 1.3 9082 9715 -2.5 0066 0078 0075 .0071 9236 9279 9292 9306 0080 0084 9441 -2.3 0107 1099 2094 1.4 9192 9370 9382 9394 9406 .0110 -2.2 0139 0136 0132 D129 0125 0119 .0116 0113 0150 0143 1.5 9474 9484 9495 9505 9515 9525 9545 -21 0179 0174 0170 0183 1.6 9706 0228 0217 0207 0192 -2.0 .0212 1.7 9678 9686 -19 0294 1.8 9641 9649 9656 9664 0351 0344 0336 0329 2314 1.9 9713 9726 9738 9744 9812 -1.8 0359 9793 9803 -1.7 0427 D418 0409 040 0392 0384 0455 2.0 9772 9783 9830 9838 9842 -1.6 0548 0526 0516 .0495 0485 0475 2.1 -15 0630 0618 0594 0582 0571 0721 068 2.2 986 9871 0808 0793 0764 0749 9901 3869 0853 082 2.3 3925 9927 9931 9936 -1.3 095 2.4 9918 7131 1712 1093 1075 1056 1038 1003 2.5 9940 9941 9945 9946 .1210 170 2.6 3961 1335 1314 1292 1251 1190 9953 9955 9959 9960 3971 -10 1587 1562 1515 1492 1469 1446 .1423 1401 1375 9965 9966 1711 9979 3981 -0.9 1762 1635 27 9976 997 -0.8 7090 2061 2033 1977 1922 1867 2.9 9984 9985 -0.7 2420 2358 2327 2266 2236 2177 2148 9987 9989 9989 9990 -0.6 2676 2578 2546 2514 2483 2451 30 -0.5 3085 3050 3015 2981 2843 3.1 9992 9993 9994 9995 9995 3409 3372 3336 3300 3156 3121 3.2 3.3 9996 9996 9997 -0.3 3745 3707 3669 3632 3594 3483 9997 9997 9997 9998 -0.2 4207 4168 4052 4013 3974 3936 3897 34 9997 452 4404 4364 4325 4286 3.50 5000 4920 1840 4801 4761 4721 4681 and up Common Critical Value NOTE For values of z below -3.49, use 0.0001 for the area. Confidence | Critical Level z score Area 0.9500 0.90 0.9950 0.95