Question
Assume that the statistical output below was all the information that you were given. Account status N Mean Std. Deviation Std. Error Mean Annual

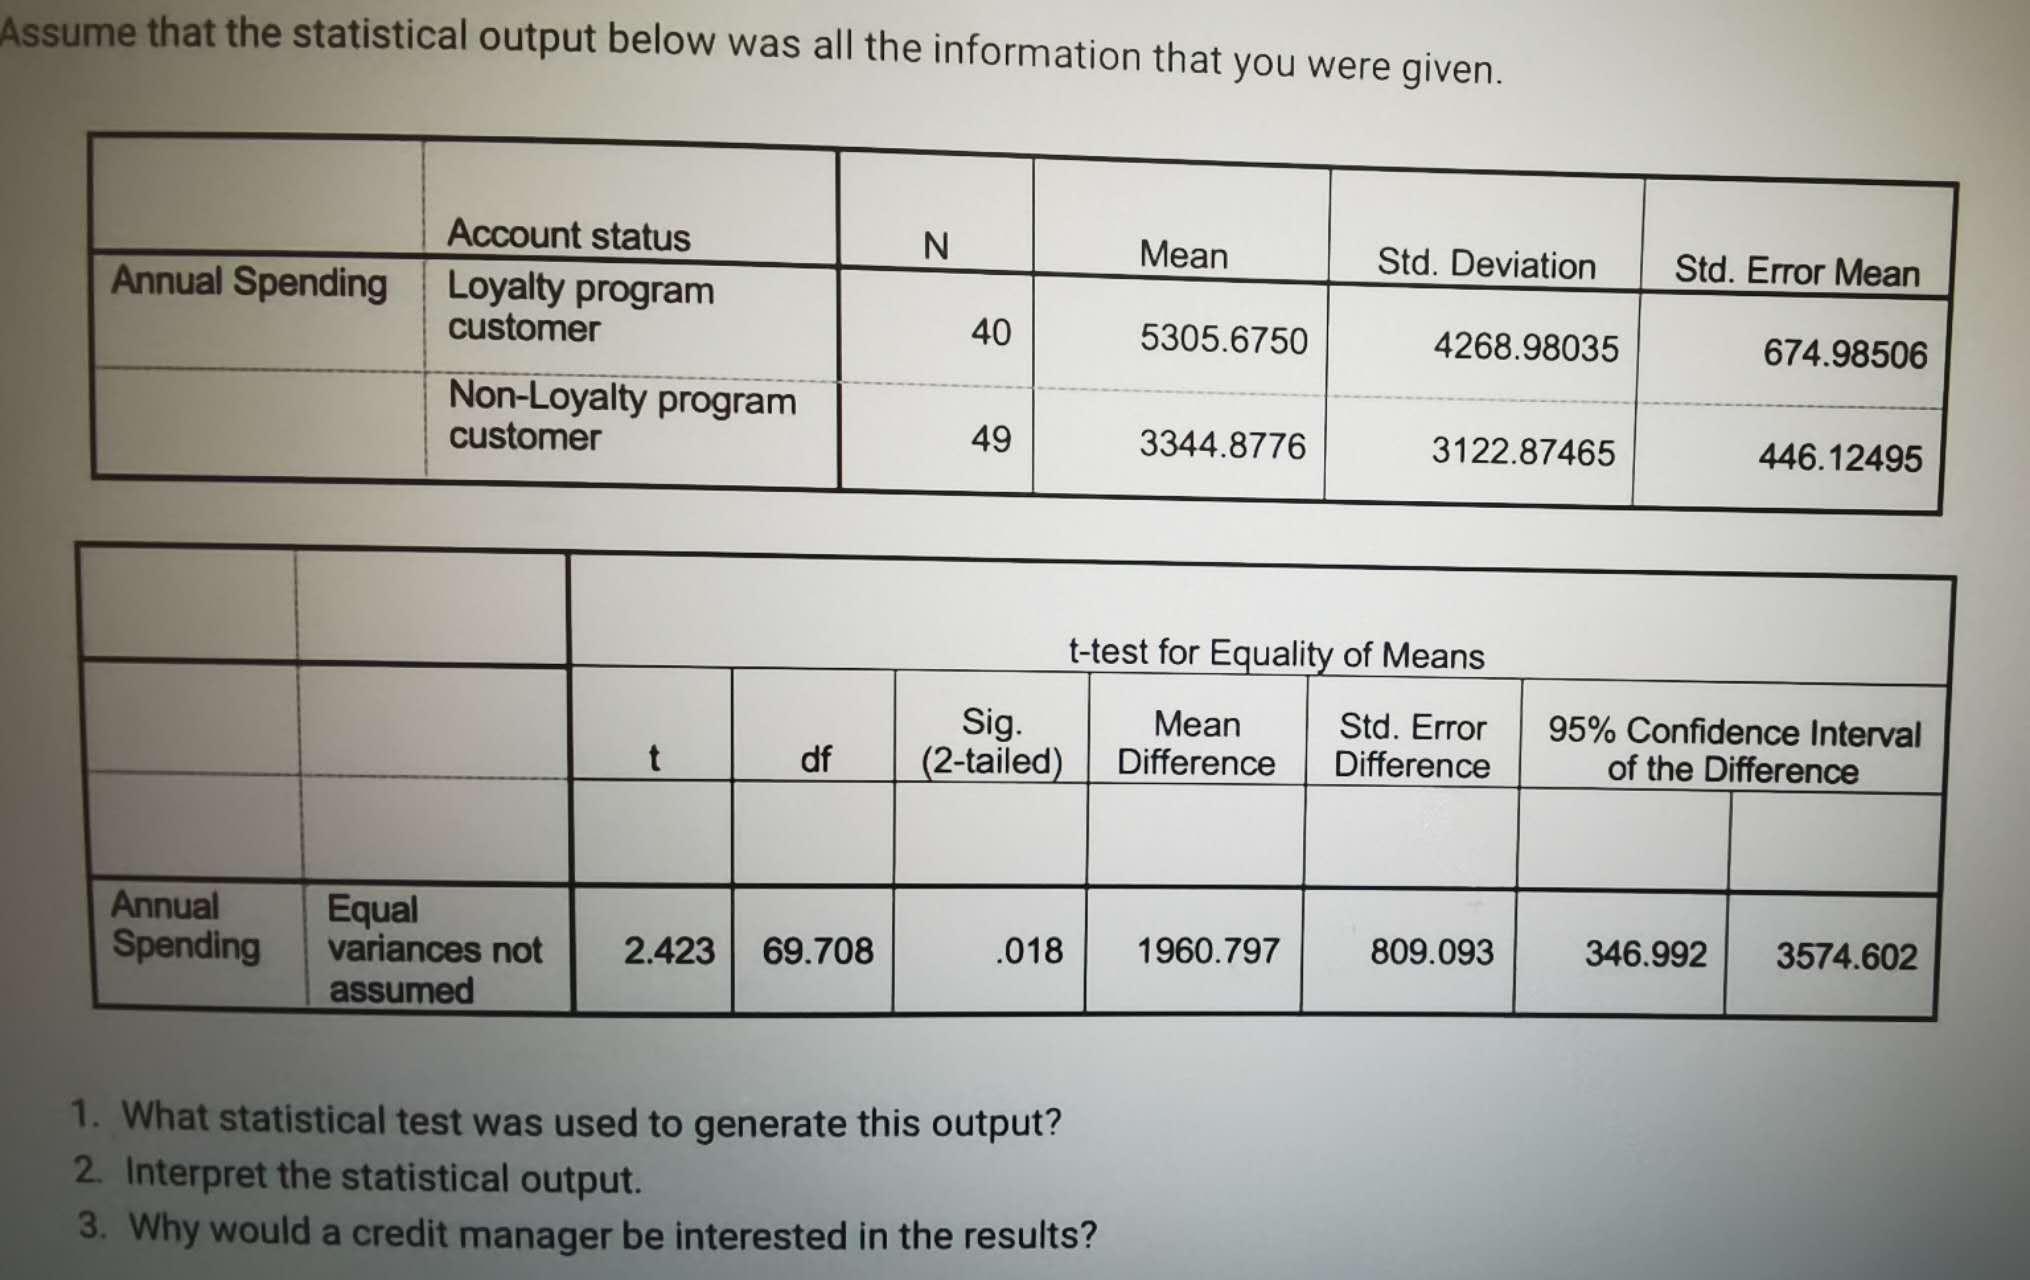
Assume that the statistical output below was all the information that you were given. Account status N Mean Std. Deviation Std. Error Mean Annual Spending Loyalty program customer 40 5305.6750 4268.98035 674.98506 Non-Loyalty program customer 49 3344.8776 3122.87465 446.12495 t-test for Equality of Means t df Sig. (2-tailed) Mean Difference Std. Error Difference 95% Confidence Interval of the Difference Annual Spending Equal variances not assumed 2.423 69.708 .018 1960.797 809.093 346.992 3574.602 1. What statistical test was used to generate this output? 2. Interpret the statistical output. 3. Why would a credit manager be interested in the results?
Step by Step Solution
There are 3 Steps involved in it
Step: 1

Get Instant Access to Expert-Tailored Solutions
See step-by-step solutions with expert insights and AI powered tools for academic success
Step: 2

Step: 3

Ace Your Homework with AI
Get the answers you need in no time with our AI-driven, step-by-step assistance
Get StartedRecommended Textbook for
Income Tax Fundamentals 2013
Authors: Gerald E. Whittenburg, Martha Altus Buller, Steven L Gill
31st Edition
1111972516, 978-1285586618, 1285586611, 978-1285613109, 978-1111972516
Students also viewed these Marketing questions
Question
Answered: 1 week ago
Question
Answered: 1 week ago
Question
Answered: 1 week ago
Question
Answered: 1 week ago
Question
Answered: 1 week ago
Question
Answered: 1 week ago
Question
Answered: 1 week ago
Question
Answered: 1 week ago
Question
Answered: 1 week ago
Question
Answered: 1 week ago
Question
Answered: 1 week ago
Question
Answered: 1 week ago
Question
Answered: 1 week ago
Question
Answered: 1 week ago
Question
Answered: 1 week ago
Question
Answered: 1 week ago
Question
Answered: 1 week ago
Question
Answered: 1 week ago
Question
Answered: 1 week ago
Question
Answered: 1 week ago
Question
Answered: 1 week ago
Question
Answered: 1 week ago
View Answer in SolutionInn App


