

Question
Assume that you are part of the accounting team for Logan Manufacturing. The company currently expects to sell 533 units for total revenue of $16,900
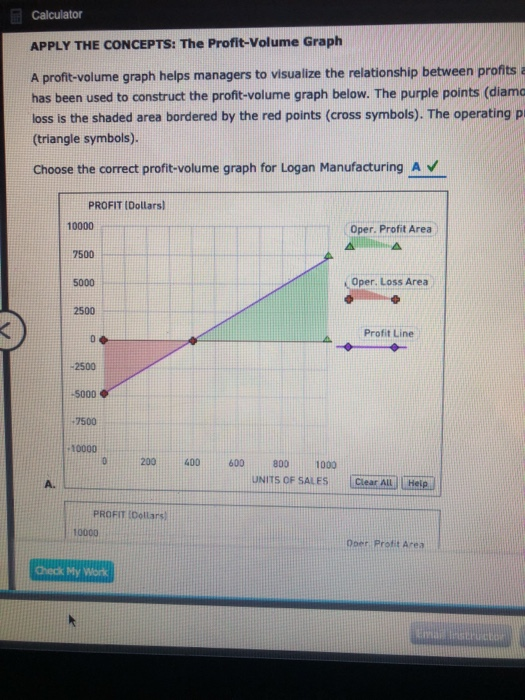
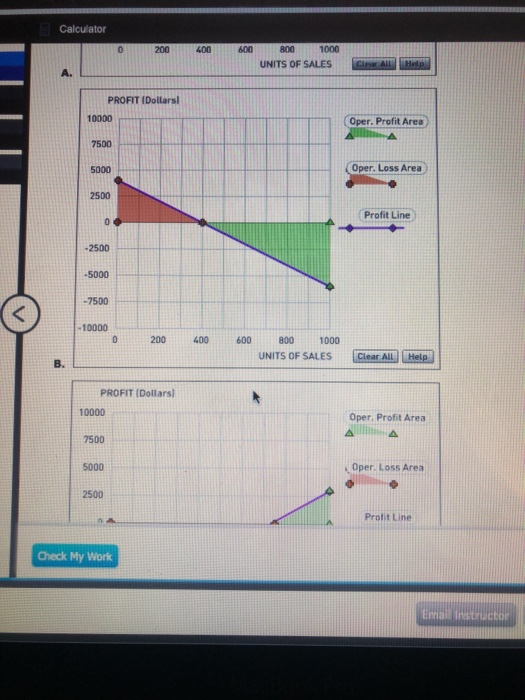
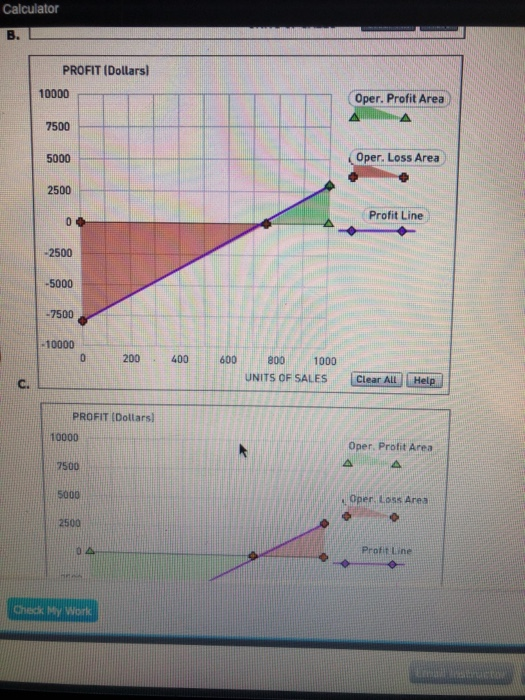
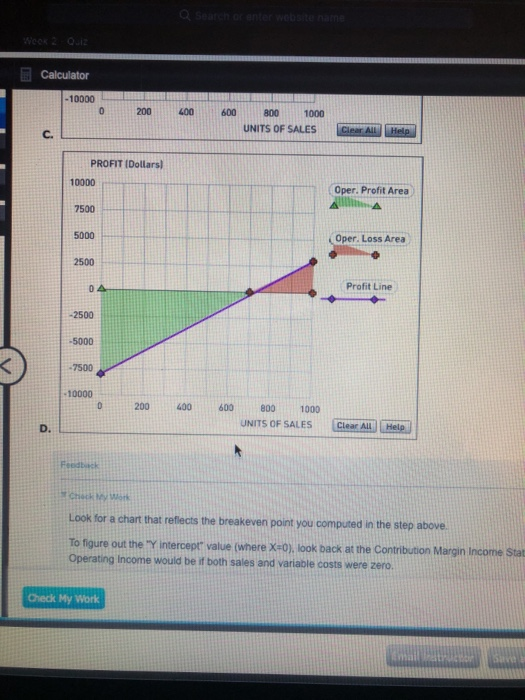
Assume that you are part of the accounting team for Logan Manufacturing. The company currently expects to sell 533 units for total revenue of $16,900 each month. Logan Manufacturing estimates direct materials costs of $3,150, direct labor costs of $4,200, variable overhead costs of $2,100, and variable selling and administrative costs of $1,050. Fixed costs of $4,800 are also expected, which includes fixed overhead and selling and administrative costs. Using this information, complete the contribution margin income statement shown below. Logan Manufacturing Contribution Margin Income Statement Sales $ Less: Variable costs Contribution margin $ Less: Fixed costs Operating income $ Feedback Review the formula and structure of this statement from the first two steps above, and apply these values. Recall that direct labor and direct materials are included with variable costs. Logan Manufacturing is examining cost behavior patterns. Your recommendation is to first determine the break-even point in units. First, calculate the contribution margin (CM) per unit (rounded to the nearest dollar). $ Next, complete the formula below to determine the break-even units. Total Fixed Costs / Contribution Margin per Unit = Units $/ $ = units Feedback Use the information from the prior step to calculate these values. The contribution margin per unit is simply the contribution margin from the statement above divided by the number of units sold. APPLY THE CONCEPTS: The Profit-Volume Graph A profit-volume graph helps managers to visualize the relationship between profits and units sold. The data for Logan Manufacturing has been used to construct the profit-volume graph below. The purple points (diamond symbols) plot the profit line. The operating loss is the shaded area bordered by the red points (cross symbols). The operating profit is the area bounded by the green points (triangle symbols). Choose the correct profit-volume graph for Logan Manufacturing A A. B. C. D. Feedback Look for a chart that reflects the breakeven point you computed in the step above. To figure out the "Y intercept" value (where X=0), look back at the Contribution Margin Income Statement in the prior step and figure out what Operating Income would be if both sales and variable costs were zero. APPLY THE CONCEPTS: Effect of Changes to Sales Price, Variable Costs and Fixed Costs Now consider each of the following scenarios for Logan Manufacturing. Calculate the contribution margin (CM) per unit, rounded to nearest dollar, and the new break-even point in units, rounded to the nearest whole unit, for each scenario separately. Scenario 1 Scenario 2 Scenario 3 Logan has been experiencing quality problems with a materials supplier. Changing suppliers will improve the quality of the product but will cause direct materials costs to increase by $1 per unit. Logan will dispose of a machine in the factory. The depreciation on that equipment is $500 per month. After some extensive market research, Logan has determined that a sales price increase of $2 per unit will not affect the sales volume and will be effective immediately. CM per unit: $ CM per unit: $ CM per unit: $ Break-even units: units Break-even units: units Break-even units: units
Step by Step Solution
There are 3 Steps involved in it
Step: 1

Get Instant Access to Expert-Tailored Solutions
See step-by-step solutions with expert insights and AI powered tools for academic success
Step: 2

Step: 3
Ace Your Homework with AI
Get the answers you need in no time with our AI-driven, step-by-step assistance
Get Started
Learning Sage 50 Accounting 2016 A Modular Approach
Authors: Harvey Freedman
17th Edition
0176768092, 9780176768096