

Answered step by step
Verified Expert Solution
Question
1 Approved Answer
Assume that you are purchasing an investment and have decided to invest in a company in the digital phone business You have narrowed the choice
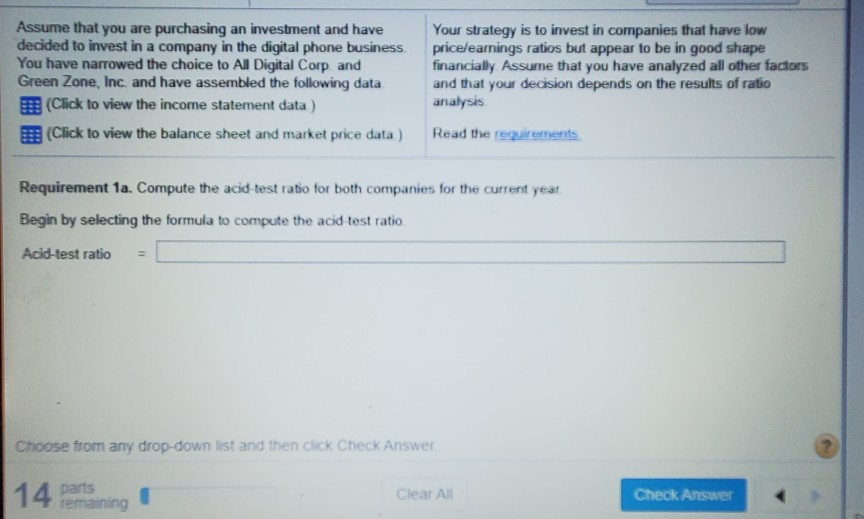
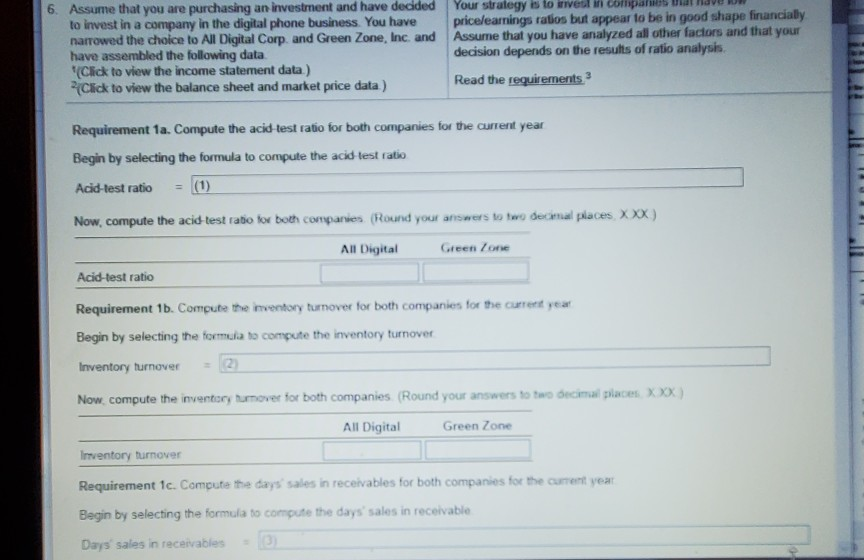
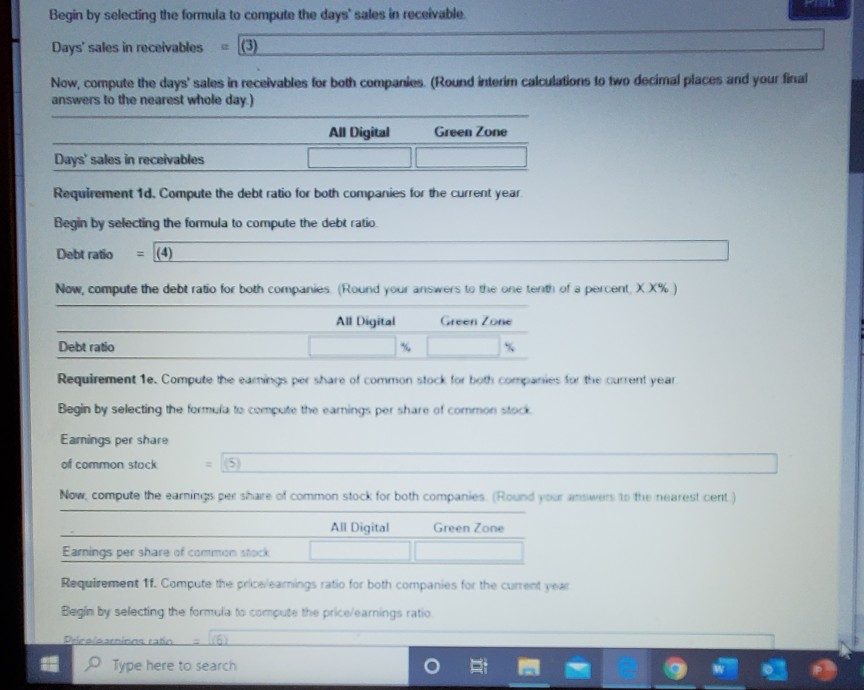
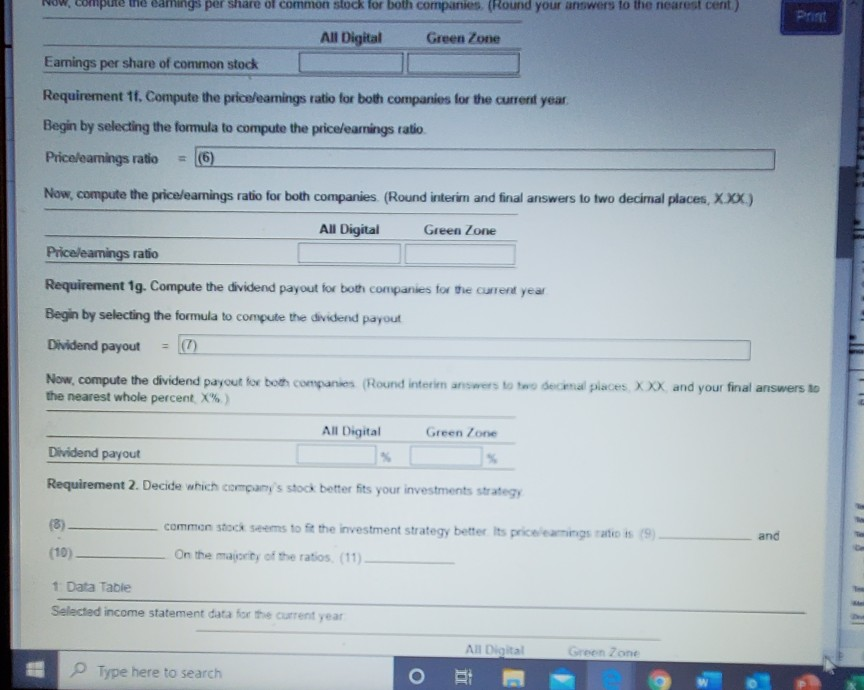
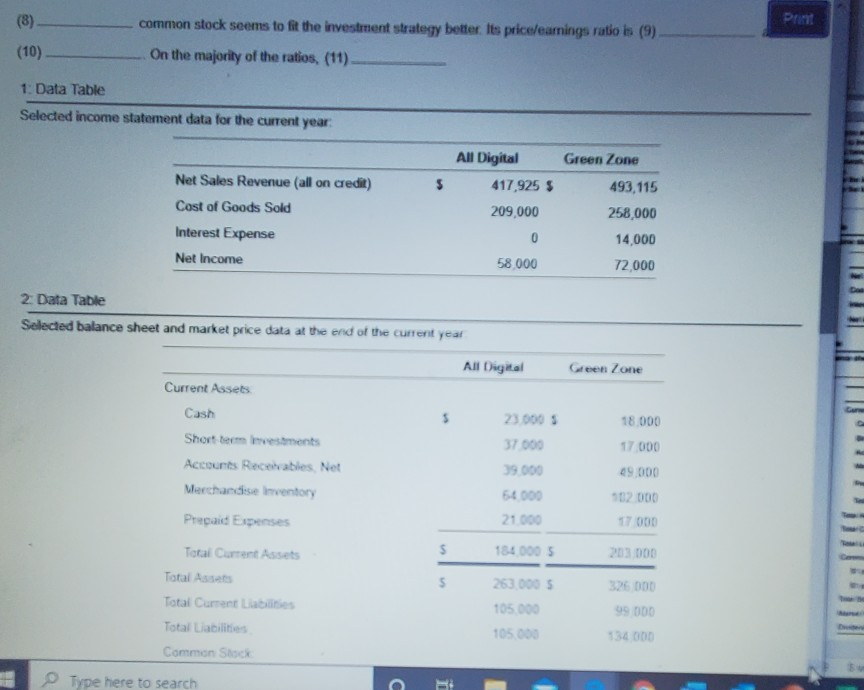
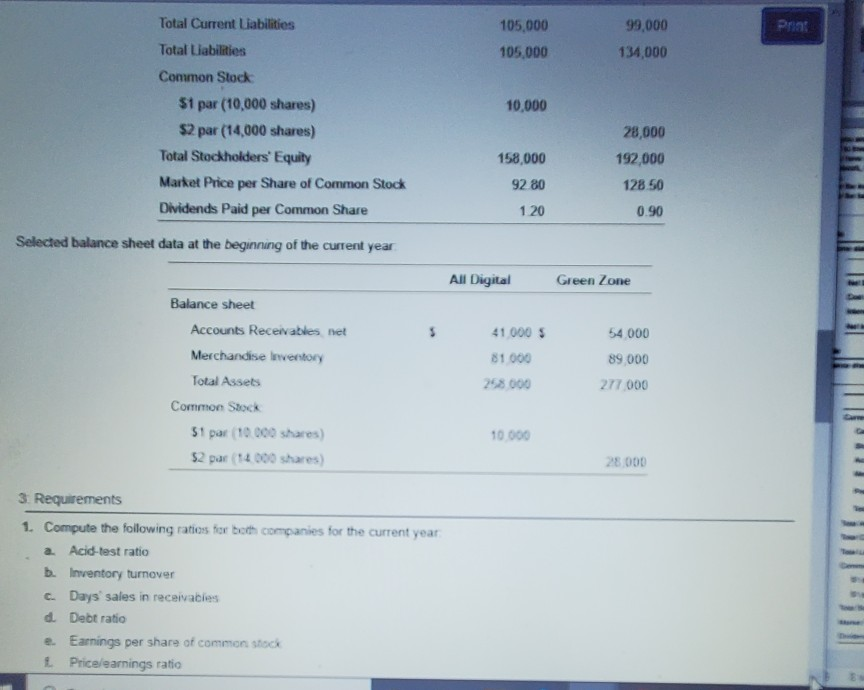
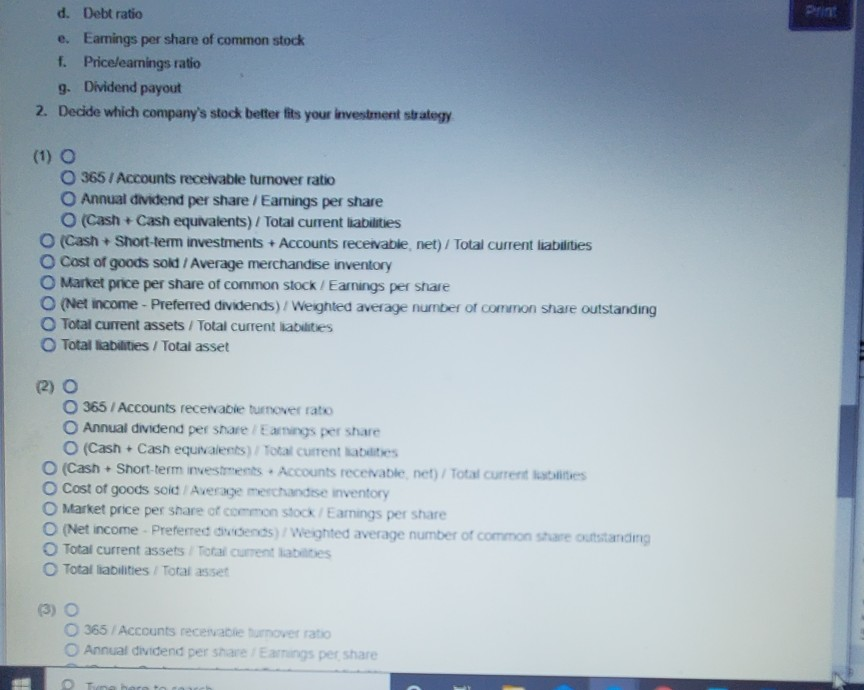
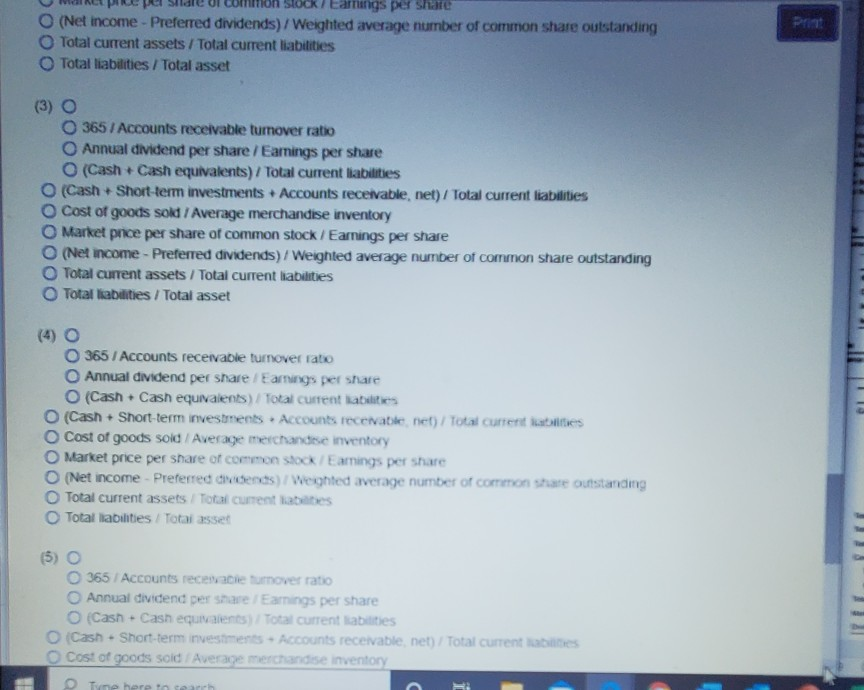
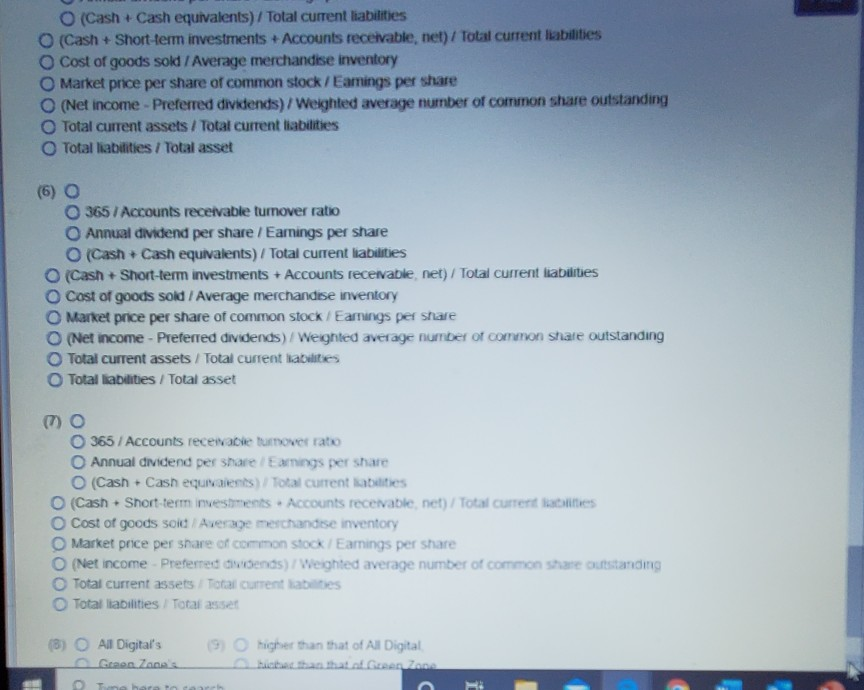
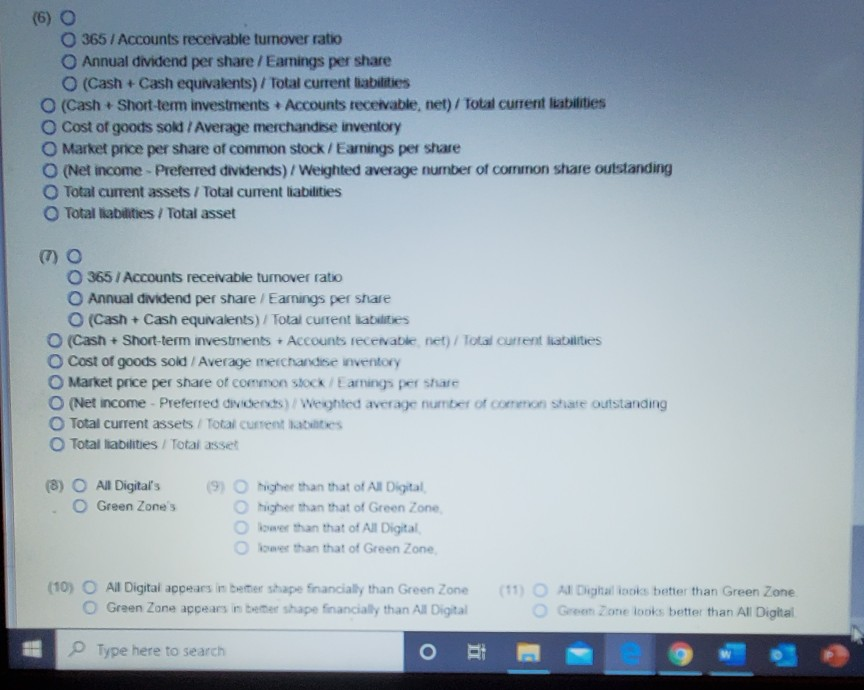
Assume that you are purchasing an investment and have decided to invest in a company in the digital phone business You have narrowed the choice to All Digital Corp and Green Zone, Inc. and have assembled the following data E (Click to view the income statement data) (Click to view the balance sheet and market price data) Your strategy is to invest in companies that have low price/earnings ratios but appear to be in good shape financially Assume that you have analyzed all other factors and that your decision depends on the results of ratio analysis Read the requirements Requirement 1a. Compute the acid test ratio for both companies for the current year Begin by selecting the formula to compute the acid test ratio Acid-test ratio Choose from any drop-down list and then click Check Answer 14 parts Clear All Check Answer remaining 6. Assume that you are purchasing an investment and have decided to invest in a company in the digital phone business. You have narrowed the choice to All Digital Corp. and Green Zone, Inc. and have assembled the following data Click to view the income statement data) Click to view the balance sheet and market price data) Your strategy is to invest i com pricelearnings ratios but appear to be in good shape financially Assume that you have analyzed all other factors and that your decision depends on the results of ratio analysis Read the requirements ? Requirement 1a. Compute the acid-test ratio for both companies for the current year Begin by selecting the formula to compute the acid test ratio Acid-test ratio = (1) Now, compute the acid-test ratio for both companies (Round your answers to two decimal places XXX) All Digital Green Zone Acid-test ratio Requirement 1b. Compute the inventory turnover for both companies for the current year Begin by selecting the formula to compute the inventory turnover Inventory turnover = 20 Now.compute the inventory turnover for both companies (Round your answers to two decimal places XXX) All Digital Green Zone Inventory turnover Requirement 1c. Compute the days sales in receivables for both companies for the current year Begin by selecting the formula to compute the days' sales in receivable Days' sales in receivables Begin by selecting the formula to compute the days' sales in receivable. Days' sales in receivables Now, compute the days' sales in receivables for both companies (Round interim calculations to two decimal places and your final answers to the nearest whole day) All Digital Green Zone Days' sales in receivables Requirement 1d. Compute the debt ratio for both companies for the current year Begin by selecting the formula to compute the debt ratio Debt ratio Now.compute the debt ratio for both companies (Round your answers to the one tenth of a percent XX%) All Digital Green Zone Debt ratio Requirement 1e. Compute the earnings por share of common stock for both companies for the current year Begin by selecting the formula to compute the earnings por share of common stock Earnings per share of common stock Now compute the earnings per share of common stock for both companies (Round your answers to the nearest cent) All Digital Green Zone Earnings per share of common stock Requirement 11. Compute the price earnings ratio for both companies for the current yeme Begin by selecting the formula to compute the price/earnings ratio Decelearnings at Type here to search pute me eamings per share of common stock for both companies (Round your answers to the nearest cent) Print All Digital Green Zone Earnings per share of common stock Requirement 11. Compute the price/earnings ratio for both companies for the current year Begin by selecting the formula to compute the pricelearnings ratio Pricelearnings ratio Now.compute the price/earnings ratio for both companies (Round interim and final answers to two decimal places, XXX) All Digital Green Zone Price/eamings ratio Requirement 19. Compute the dividend payout for both companies for the current year Begin by selecting the formula to compute the dividend payout Dividend payout = Now.compute the dividend payout for both companies (Round interim answers to two decimal places XXX and your final answers to the nearest whole percent X%) All Digital Green Zone Dividend payout Requirement 2. Decide which company's stock better fits your investments strategy common stock seems to fit the investment strategy better its price camnings ratio is (9) On the majority of the ratios (11) and (10) 1 Data Table Selected income statement data for the current year All Digital Green Zone Type here to search (8) Print common stock seems to fit the investment strategy better. Its pricelearnings ratio is (9) On the majority of the ratios, (11) (10) 1: Data Table Selected income statement data for the current year Green Zone 5 Net Sales Revenue (all on credit) Cost of Goods Sold Interest Expense Net Income All Digital 417,925 5 209,000 493,115 258,000 14,000 72,000 0 58 000 2. Data Table Selected balance sheet and market price data at the end of the current year All Digital Green Zone 18.000 17 000 Current Assets Cash Short term investments Accounts Recehabies Net Merchandise Inventory Prepaid Expenses 23 000 5 37 000 39.000 54000 21 000 49.000 02 000 $ 1340005 5 Total Current Assets Total Assets Total Current Liabilities Total Liabilities Common Shack 253 000 $ 10500 105 000 326 000 99 000 134000 Type here to search C 105,000 105.000 99,000 134,000 10,000 Total Current Liabilities Total Liabilities Common Stock $1 par (10,000 shares) $2 par (14,000 shares) Total Stockholders' Equity Market Price per Share of Common Stock Dividends Paid per Common Share 158,000 92 80 28,000 192,000 128 50 120 0.90 Selected balance sheet data at the beginning of the current year All Digital Green Zone 41 000 $ 81 000 Balance sheet Accounts Receivables net Merchandise Inventory Total Assets Common Stock 51 par 10.000 shares) 52 par 14 000 shares) 54 000 89 000 277.000 258 000 10 000 28.000 3. Requirements 1. Compute the following ratios for both companies for the current year a Acid-test ratio b. Inventory turnover c. Days' sales in receivables d Debt ratio e. Earnings per share of common stock Price/earnings ratio d. Debt ratio e. Earnings per share of common stock 1. Pricelearnings ratio 9. Dividend payout 2. Decide which company's stock better fits your investment strategy (1) O 0 365 /Accounts receivable turnover ratio O Annual dividend per share / Earnings per share O (Cash Cash equivalents) / Total current liabilities O (CashShort-term investments + Accounts receivable net) / Total current liabilities O Cost of goods sold / Average merchandise inventory O Market price per share of common stock / Earnings per share (Net income - Preferred dividends)/Weighted average number of common share outstanding Total current assets/Total current liabilities Total liabilities / Total asset (2) 365 / Accounts receivable turnover ratio Annual dividend per Share Earnings per share O (Cash Cash equivalents) Total current abaties O (CashShort-term investments Accounts receivable net) / Total currenties Cost of goods sold / Average merchandise inventory Market price per share of common stock Earnings per share (Net income - Preferred dividends) /Weighted average number of common share outstanding Total current assets Total current labates Total liabilities/ Total asset (3) O 0 365 Accounts recente Turnover ratio Annual dividend per share 'Earrings per share Stock / Earrings per shite (Net income - Preferred dividends) / Weighted average number of common share outstanding Total current assets / Total current liabilities Total liabilities / Total asset (3) O 0 365 / Accounts receivable turnover ratio Annual dividend per share / Earnings per share (Cash Cash equivalents) / Total current liabilities O (Cash + Short-term investments Accounts receivable net) / Total current liabilities O Cost of goods sold / Average merchandise inventory O Market price per share of common stock / Earnings per share (Net income - Preferred dividends) / Weighted average number of common share outstanding Total current assets/Total current liabilities Total liabilities / Total asset 365 / Accounts receivable tumover ratio O Annual dividend per share Earnings per share (Cash Cash equivalents) Total current Katies O (Cash + Short-term investments Accounts receivable net) / Total current staties O Cost of goods sold / Average merchandise inventory Market price per share of common stock/Earings per share (Net income - Preferred dividends) / Weighted average number of common share outstanding Total current assets/Total current abates Total liabilities/Total asset JIS (5) O 365 Accounts receivable fomover ratio Annual dividend per share Earnings per share O (Cash Cash equivalents) Total current abilities (Cash - Short-term investments - Accounts receivable net) / Total current les Cost of goods sold Average merchandise inventory Tune O (Cash + Cash equivalents) / Total current liabilities O (Cash + Short-term investments Accounts receivable, net) / Total current liabilities Cost of goods sold / Average merchandise inventory Market price per share of common stock/Eamings per share (Net income - Preferred dividends)/Weighted average number of common share outstanding Total current assets/Total current liabilities Total liabilities / Total asset (6) O 365 / Accounts receivable turnover ratio Annual dividend per share / Earnings per share O (Cash Cash equivalents) / Total current liabilities (Cash + Short-term investments Accounts receivable net) / Total current liabilities O Cost of goods sold / Average merchandise inventory O Market price per share of common stock / Earnings per share (Net income - Preferred dividends) Weighted average number of common share outstanding Total current assets / Total current habilities Total liabilities / Total asset (7) O 365 / Accounts receivable turnover ratio Annual dividend per share Earnings per share (Cash + Cash equivalents) / Total current abilities O (Cash - Short-term investments Accounts receivable net) / Total current les O Cost of goods sold Average merchandise inventory Market price per share of common stock/Earings per share O (Net income - Preferred dividends) / Weighted average number of common share outstanding Total current assets Total current abaties Total liabilities/ Total asset (8) O All Digital's Gran Zana higher than that of Al Digital (6) O 365 / Accounts receivable turnover ratio Annual dividend per share/Earings per share O (Cash Cash equivalents) / Total current liabilities O (Cash Short-term investments Accounts receivable, net) / Total current liabilities Cost of goods sold / Average merchandise inventory Market price per share of common stock/Earnings per share (Net income - Preferred dividends) / Weighted average number of common share outstanding Total current assets / Total current liabilities Total liabilities/ Total asset (7) O O 365 / Accounts receivable turnover ratio Annual dividend per share / Eamings per share O (Cash + Cash equivalents) Total current abilities O Cash + Short-term investments + Accounts receivable net) / Total current liabilities Cost of goods sold / Average merchandise inventory O Market price per share of common stock/Earnings per share (Net income - Preferred dividends) Weighted average number of common share outstanding Total current assets / Total current states Total liabilities / Total asset All Digital's Green Zone's O higher than that of Al Digital higher than that of Green Zone, kower than that of Al Digital lower than that of Green Zone (10) O All Digital appears in better shape financially than Green Zone Green Zone appears in better shape financially than All Digital (11) Al Digital ooks better than Green Zone Green Zone looks better than All Digital Type here to search o
Step by Step Solution
There are 3 Steps involved in it
Step: 1

Get Instant Access to Expert-Tailored Solutions
See step-by-step solutions with expert insights and AI powered tools for academic success
Step: 2

Step: 3
Ace Your Homework with AI
Get the answers you need in no time with our AI-driven, step-by-step assistance
Get Started
Horngrens Financial And Managerial Accounting The Managerial Chapters And The Financial Chapters Plus Pearson Mylab Accounting With Pearson Global Edition
Authors: Tracie L. Miller Nobles, Brenda L. Mattison, Ella Mae Matsumura
6th Global Edition
1292270756, 978-1292270753