Assume the valuation date for the subject company is 12/31/2019. Use the discounted stream of benefits method to the income approach. Assume end-of-year discounting and compute the total value of the present value of the Terminal Value Perpetuity as at 12/31/2019. Present your answer to the second decimal place and do not round until the end.
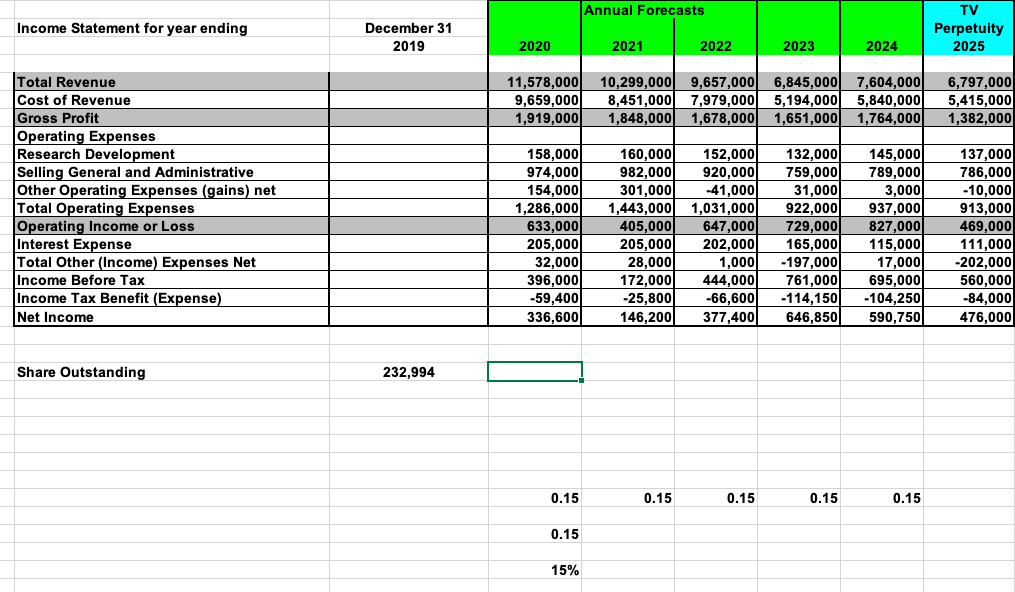
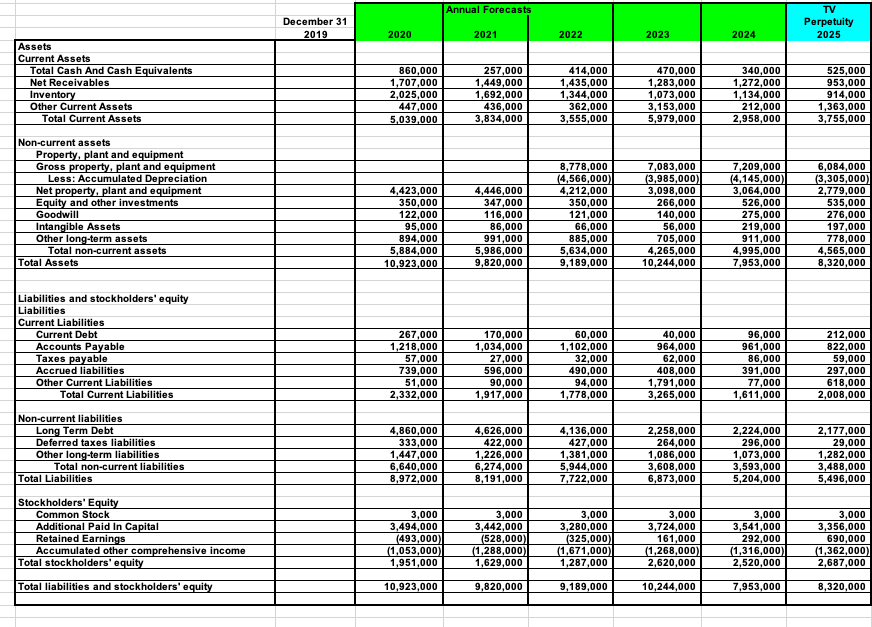
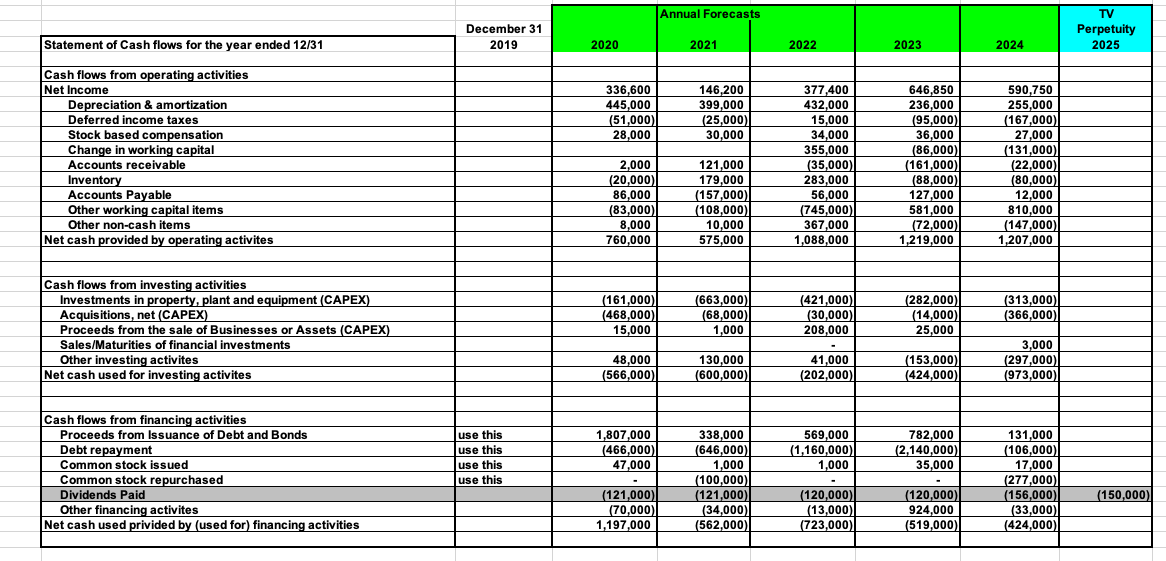
Annual Forecasts Income Statement for year ending December 31 2019 TV Perpetuity 2025 2020 2021 2022 2023 2024 11,578,000 9,659,000 1,919,000 10,299,000 8,451,000 1,848,000 9,657,000 7,979,000 1,678,000 6,845,000 7,604,000 5,194,000 5,840,000 1,651,000) 1,764,000 6,797,000 5,415,000 1,382,000 Total Revenue Cost of Revenue Gross Profit Operating Expenses Research Development Selling General and Administrative Other Operating Expenses (gains) net Total Operating Expenses Operating Income or Loss Interest Expense Total Other (Income) Expenses Net Income Before Tax Income Tax Benefit (Expense) Net Income 158,000 974,000 154,000 1,286,000 633,000 205,000 32,000 396,000 -59,400 336,600 160,000 982,000 301,000 1,443,000 405,000 205,000 28,000 172,000 -25,800 146,200 152,000 920,000 -41,000 1,031,000 647,000 202,000 1,000 444,000 -66,600 377,400 132,000 759,000 31,000 922,000 729,000 165,000 -197,000 761,000 -114,150 646,850 145,000 789,000 3,000 937,000 827,000 115,000 17,000 695,000 -104,2501 590,750 137,000 786,000 -10,000 913,000 469,000 111,000 -202,000 560,000 -84,000 476,000 Share Outstanding 232,994 0.15 0.15 0.15 0.15 0.15 0.15 15% Annual Forecasts December 31 2019 TV Perpetuity 2025 2020 2021 2022 2023 2024 Assets Current Assets Total Cash And Cash Equivalents Net Receivables Inventory Other Current Assets Total Current Assets 860,000 1,707,000 2,025,000 447,000 5,039,000 257,000 1,449,000 1,692,000 436,000 3,834,000 414,000 1,435,000 1,344,000 362,000 3,555,000 470,000 1,283,000 1,073,000 3,153,000 5,979,000 340,000 1,272,000 1,134,000 212,000 2,958,000 525,000 953,000 914,000 1,363,000 3,755,000 Non-current assets Property, plant and equipment Gross property, plant and equipment Less: Accumulated Depreciation Net property, plant and equipment Equity and other investments Goodwill Intangible Assets Other long-term assets Total non-current assets Total Assets 4,423,000 350,000 122,000 95,000 894,000 5,884,000 10,923,000 4,446,000 347,000 116,000 86,000 991,000 5,986,000 9,820,000 8,778,000 (4,566,000) 4,212,000 350,000 121,000 66,000 885,000 5,634,000 9,189,000 7,083,000 (3,985,000) 3,098,000 266,000 140,000 56,000 705,000 4,265,000 10,244,000 7,209,000 (4,145,000) 3,064,000 526,000 275,000 219,000 911,000 4,995,000 7,953,000 6,084,000 (3,305,000) 2,779,000 535,000 276,000 197,000 778,000 4,565,000 8,320,000 Liabilities and stockholders' equity Liabilities Current Liabilities Current Debt Accounts Payable Taxes payable Accrued liabilities Other Current Liabilities Total Current Liabilities 267,000 1,218,000 57,000 739,000 51,000 2,332,000 170,000 1,034,000 27,000 596,000 90,000 1,917,000 60,000 1,102,000 32,000 490,000 94,000 1,778,000 40,000 964,000 62,000 408,000 1,791,000 3,265,000 96,000 961,000 86,000 391,000 77,000 1,611,000 212,000 822,000 59,000 297,000 618,000 2,008,000 Non-current liabilities Long Term Debt Deferred taxes liabilities Other long-term liabilities Total non-current liabilities Total Liabilities 4,860,000 333,000 1,447,000 6,640,000 8,972,000 4,626,000 422,000 1,226,000 6,274,000 8,191,000 4,136,000 427,000 1,381,000 5,944,000 7,722,000 2,258,000 264,000 1,086,000 3,608,000 6,873,000 2,224,000 296,000 1,073,000 3,593,000 5,204,000 2,177,000 29,000 1,282,000 3,488,000 5,496,000 Stockholders' Equity Common Stock Additional Paid In Capital Retained Earnings Accumulated other comprehensive income Total stockholders' equity 3,000 3,494,000 (493,000) (1,053,000) 1,951,000 3,000 3,442,000 (528,000) (1,288,000) 1,629,000 3,000 3,280,000 (325,000) (1,671,000) 1,287,000 3,000 3,724,000 161,000 (1.268,000) 2,620,000 3,000 3,541,000 292,000 (1,316,000) 2,520,000 3,000 3,356,000 690,000 (1,362,000) 2,687,000 Total liabilities and stockholders' equity 10,923,000 9,820,000 9,189,000 10,244,000 7,953,000 8,320,000 Annual Forecasts December 31 2019 TV Perpetuity 2025 Statement of Cash flows for the year ended 12/31 2020 2021 2022 2023 2024 336,600 445,000 (51,000)| 28,000 146,200 399,000 (25,000) 30,000 Cash flows from operating activities Net Income Depreciation & amortization Deferred income taxes Stock based compensation Change in working capital Accounts receivable Inventory Accounts Payable Other working capital items Other non-cash items Net cash provided by operating activites 2,000 (20,000)| 86,000 (83,000) 8,000 760,000 121,000 179,000 (157,000) (108,000 10,000 575,000 377,400 432,000 15,000 34,000 355,000 (35,000) 283,000 56,000 (745,000) 367,000 1,088,000 646,850 236,000 (95,000) 36,000 (86,000 (161,000) (88,000) 127,000 581,000 (72,000) 1,219,000 590,750 255,000 (167,000) 27,000 (131,000 (22,000) (80,000) 12,000 810,000 (147,000) 1,207,000 Cash flows from investing activities Investments in property, plant and equipment (CAPEX) Acquisitions, net (CAPEX) Proceeds from the sale of Businesses or Assets (CAPEX) Sales/Maturities of financial investments Other investing activites Net cash used for investing activites (161,000) (468,000) 15,000 (663,000)| (68,000) 1,000 (421,000) (30,000) 208,000 (282,000) (14,000) 25,000 (313,000) (366,000) 48,000 (566,000) 130,000 (600,000) 41,000 (202,000)| (153,000) (424,000) 3,000 (297,000) (973,000) use this use this use this use this 1,807,000 (466,000) 47,000 569,000 (1,160,000) 1,000 Cash flows from financing activities Proceeds from Issuance of Debt and Bonds Debt repayment Common stock issued Common stock repurchased Dividends Paid Other financing activites Net cash used privided by (used for) financing activities 782,000 (2,140,000) 35,000 338,000 (646,000) 1,000 (100,000) (121,000) (34,000) (562,000) 131,000 (106,000)| 17,000 (277,000) (156,000) (33,000) (424,000) (150,000) (121,000) (70,000)| 1,197,000 (120,000) (13,000) (723,000) (120,000) 924,000 (519,000 Annual Forecasts Income Statement for year ending December 31 2019 TV Perpetuity 2025 2020 2021 2022 2023 2024 11,578,000 9,659,000 1,919,000 10,299,000 8,451,000 1,848,000 9,657,000 7,979,000 1,678,000 6,845,000 7,604,000 5,194,000 5,840,000 1,651,000) 1,764,000 6,797,000 5,415,000 1,382,000 Total Revenue Cost of Revenue Gross Profit Operating Expenses Research Development Selling General and Administrative Other Operating Expenses (gains) net Total Operating Expenses Operating Income or Loss Interest Expense Total Other (Income) Expenses Net Income Before Tax Income Tax Benefit (Expense) Net Income 158,000 974,000 154,000 1,286,000 633,000 205,000 32,000 396,000 -59,400 336,600 160,000 982,000 301,000 1,443,000 405,000 205,000 28,000 172,000 -25,800 146,200 152,000 920,000 -41,000 1,031,000 647,000 202,000 1,000 444,000 -66,600 377,400 132,000 759,000 31,000 922,000 729,000 165,000 -197,000 761,000 -114,150 646,850 145,000 789,000 3,000 937,000 827,000 115,000 17,000 695,000 -104,2501 590,750 137,000 786,000 -10,000 913,000 469,000 111,000 -202,000 560,000 -84,000 476,000 Share Outstanding 232,994 0.15 0.15 0.15 0.15 0.15 0.15 15% Annual Forecasts December 31 2019 TV Perpetuity 2025 2020 2021 2022 2023 2024 Assets Current Assets Total Cash And Cash Equivalents Net Receivables Inventory Other Current Assets Total Current Assets 860,000 1,707,000 2,025,000 447,000 5,039,000 257,000 1,449,000 1,692,000 436,000 3,834,000 414,000 1,435,000 1,344,000 362,000 3,555,000 470,000 1,283,000 1,073,000 3,153,000 5,979,000 340,000 1,272,000 1,134,000 212,000 2,958,000 525,000 953,000 914,000 1,363,000 3,755,000 Non-current assets Property, plant and equipment Gross property, plant and equipment Less: Accumulated Depreciation Net property, plant and equipment Equity and other investments Goodwill Intangible Assets Other long-term assets Total non-current assets Total Assets 4,423,000 350,000 122,000 95,000 894,000 5,884,000 10,923,000 4,446,000 347,000 116,000 86,000 991,000 5,986,000 9,820,000 8,778,000 (4,566,000) 4,212,000 350,000 121,000 66,000 885,000 5,634,000 9,189,000 7,083,000 (3,985,000) 3,098,000 266,000 140,000 56,000 705,000 4,265,000 10,244,000 7,209,000 (4,145,000) 3,064,000 526,000 275,000 219,000 911,000 4,995,000 7,953,000 6,084,000 (3,305,000) 2,779,000 535,000 276,000 197,000 778,000 4,565,000 8,320,000 Liabilities and stockholders' equity Liabilities Current Liabilities Current Debt Accounts Payable Taxes payable Accrued liabilities Other Current Liabilities Total Current Liabilities 267,000 1,218,000 57,000 739,000 51,000 2,332,000 170,000 1,034,000 27,000 596,000 90,000 1,917,000 60,000 1,102,000 32,000 490,000 94,000 1,778,000 40,000 964,000 62,000 408,000 1,791,000 3,265,000 96,000 961,000 86,000 391,000 77,000 1,611,000 212,000 822,000 59,000 297,000 618,000 2,008,000 Non-current liabilities Long Term Debt Deferred taxes liabilities Other long-term liabilities Total non-current liabilities Total Liabilities 4,860,000 333,000 1,447,000 6,640,000 8,972,000 4,626,000 422,000 1,226,000 6,274,000 8,191,000 4,136,000 427,000 1,381,000 5,944,000 7,722,000 2,258,000 264,000 1,086,000 3,608,000 6,873,000 2,224,000 296,000 1,073,000 3,593,000 5,204,000 2,177,000 29,000 1,282,000 3,488,000 5,496,000 Stockholders' Equity Common Stock Additional Paid In Capital Retained Earnings Accumulated other comprehensive income Total stockholders' equity 3,000 3,494,000 (493,000) (1,053,000) 1,951,000 3,000 3,442,000 (528,000) (1,288,000) 1,629,000 3,000 3,280,000 (325,000) (1,671,000) 1,287,000 3,000 3,724,000 161,000 (1.268,000) 2,620,000 3,000 3,541,000 292,000 (1,316,000) 2,520,000 3,000 3,356,000 690,000 (1,362,000) 2,687,000 Total liabilities and stockholders' equity 10,923,000 9,820,000 9,189,000 10,244,000 7,953,000 8,320,000 Annual Forecasts December 31 2019 TV Perpetuity 2025 Statement of Cash flows for the year ended 12/31 2020 2021 2022 2023 2024 336,600 445,000 (51,000)| 28,000 146,200 399,000 (25,000) 30,000 Cash flows from operating activities Net Income Depreciation & amortization Deferred income taxes Stock based compensation Change in working capital Accounts receivable Inventory Accounts Payable Other working capital items Other non-cash items Net cash provided by operating activites 2,000 (20,000)| 86,000 (83,000) 8,000 760,000 121,000 179,000 (157,000) (108,000 10,000 575,000 377,400 432,000 15,000 34,000 355,000 (35,000) 283,000 56,000 (745,000) 367,000 1,088,000 646,850 236,000 (95,000) 36,000 (86,000 (161,000) (88,000) 127,000 581,000 (72,000) 1,219,000 590,750 255,000 (167,000) 27,000 (131,000 (22,000) (80,000) 12,000 810,000 (147,000) 1,207,000 Cash flows from investing activities Investments in property, plant and equipment (CAPEX) Acquisitions, net (CAPEX) Proceeds from the sale of Businesses or Assets (CAPEX) Sales/Maturities of financial investments Other investing activites Net cash used for investing activites (161,000) (468,000) 15,000 (663,000)| (68,000) 1,000 (421,000) (30,000) 208,000 (282,000) (14,000) 25,000 (313,000) (366,000) 48,000 (566,000) 130,000 (600,000) 41,000 (202,000)| (153,000) (424,000) 3,000 (297,000) (973,000) use this use this use this use this 1,807,000 (466,000) 47,000 569,000 (1,160,000) 1,000 Cash flows from financing activities Proceeds from Issuance of Debt and Bonds Debt repayment Common stock issued Common stock repurchased Dividends Paid Other financing activites Net cash used privided by (used for) financing activities 782,000 (2,140,000) 35,000 338,000 (646,000) 1,000 (100,000) (121,000) (34,000) (562,000) 131,000 (106,000)| 17,000 (277,000) (156,000) (33,000) (424,000) (150,000) (121,000) (70,000)| 1,197,000 (120,000) (13,000) (723,000) (120,000) 924,000 (519,000