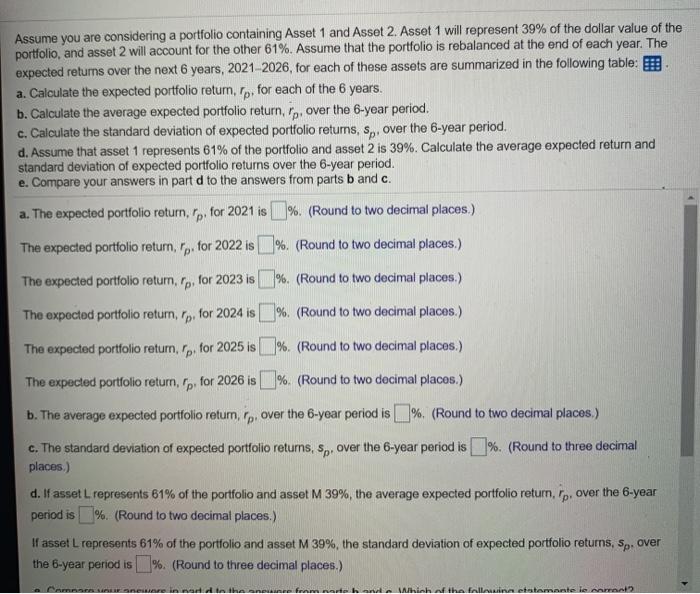
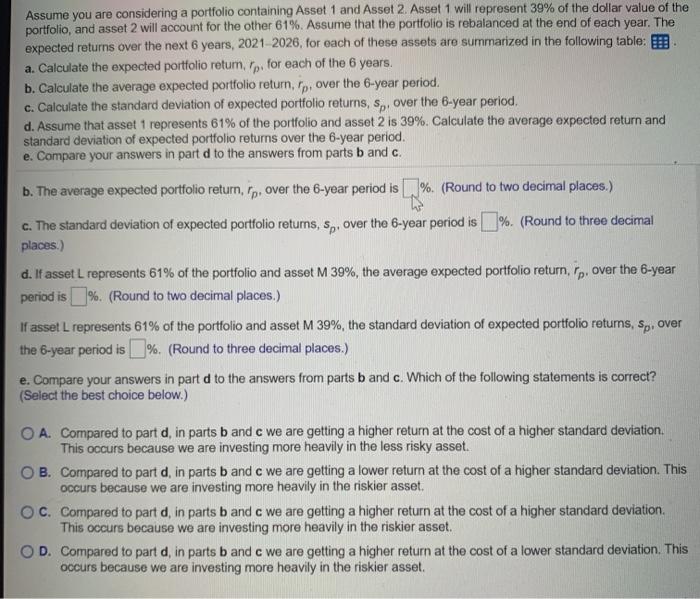
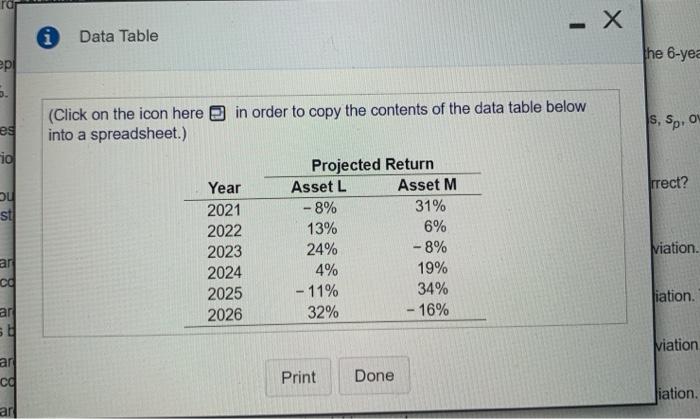
Assume you are considering a portfolio containing Asset 1 and Asset 2. Asset 1 will represent 39% of the dollar value of the portfolio, and asset 2 will account for the other 61%. Assume that the portfolio is rebalanced at the end of each year. The expected returns over the next 6 years, 2021-2026, for each of these assets are summarized in the following table: a. Calculate the expected portfolio retum, fp, for each of the 6 years. b. Calculate the average expected portfolio return, ip, over the 6-year period. c. Calculate the standard deviation of expected portfolio returns, sp, over the 6-year period. d. Assume that asset 1 represents 61% of the portfolio and asset 2 is 39%. Calculate the average expected return and standard deviation of expected portfolio returns over the 6-year period. e. Compare your answers in part d to the answers from parts b and c. a. The expected portfolio return, rp. for 2021 is _ %(Round to two decimal places.) The expected portfolio return, rp. for 2022 is %. (Round to two decimal places.) The expected portfolio return, fp, for 2023 is %. (Round to two decimal places.) The expected portfolio return, rp, for 2024 is % (Round to two decimal places.) The expected portfolio return, rp. for 2025 is % (Round to two decimal places.) The expected portfolio return, Tp, for 2026 is % (Round to two decimal places.) b. The average expected portfolio return, ip, over the 6-year period is %, (Round to two decimal places.) c. The standard deviation of expected portfolio returns, sp, over the 6-year period is %. (Round to three decimal places.) d. If asset L represents 61% of the portfolio and asset M 39%, the average expected portfolio return, Tp, over the 6-year period is %. (Round to two decimal places.) If asset L represents 61% of the portfolio and asset M 39%, the standard deviation of expected portfolio returns, Sp. over the 6-year period is % (Round to three decimal places.) NOnesuare in and the one from north anhinh of the follana estamante le 2 Assume you are considering a portfolio containing Asset 1 and Asset 2. Asset 1 will represent 39% of the dollar value of the portfolio, and asset 2 will account for the other 61%. Assume that the portfolio is rebalanced at the end of each year. The expected returns over the next 6 years, 2021 2026, for each of these assets are summarized in the following table: a. Calculate the expected portfolio return, Tp. for each of the 6 years. b. Calculate the average expected portfolio return, tp, over the 6-year period. c. Calculate the standard deviation of expected portfolio returns, sp, over the B-year period. d. Assume that asset 1 represents 61% of the portfolio and asset 2 is 39%. Calculate the average expected return and standard deviation of expected portfolio returns over the 6-year period. e. Compare your answers in part d to the answers from parts b and c. b. The average expected portfolio return, rp, over the 6-year period is %. (Round to two decimal places.) c. The standard deviation of expected portfolio returns, sp, over the 6-year period is %. (Round to three decimal places.) d. If asset L represents 61% of the portfolio and asset M 39%, the average expected portfolio return, fp, over the 6-year period is % (Round to two decimal places.) If asset L represents 61% of the portfolio and asset M 39%, the standard deviation of expected portfolio retums, Sp, over the 6-year period is % (Round to three decimal places.) e. Compare your answers in part d to the answers from parts b and c. Which of the following statements is correct? (Select the best choice below.) O A. Compared to part d, in parts b and c we are getting a higher return at the cost of a higher standard deviation. This occurs because we are investing more heavily in the less risky asset. O B. Compared to part d, in parts b and c we are getting a lower return at the cost of a higher standard deviation. This occurs because we are investing more heavily in the riskier asset. OC. Compared to part d, in parts b and c we are getting a higher return at the cost of a higher standard deviation This occurs because we are investing more heavily in the riskier asset. D. Compared to part d, in parts b and c we are getting a higher return at the cost of a lower standard deviation. This occurs because we are investing more heavily in the riskier asset. 0 Data Table the 6-yea ep S. in order to copy the contents of the data table below (Click on the icon here into a spreadsheet.) Is, sp. ou eg io rrect? bu st Year 2021 2022 2023 2024 2025 2026 Projected Return Asset L Asset M -8% 31% 13% 6% 24% -8% 4% 19% - 11% 34% 32% -16% viation. ar ca iation. ar Niation ar ca Print Done iation ar


