

Answered step by step
Verified Expert Solution
Question
1 Approved Answer
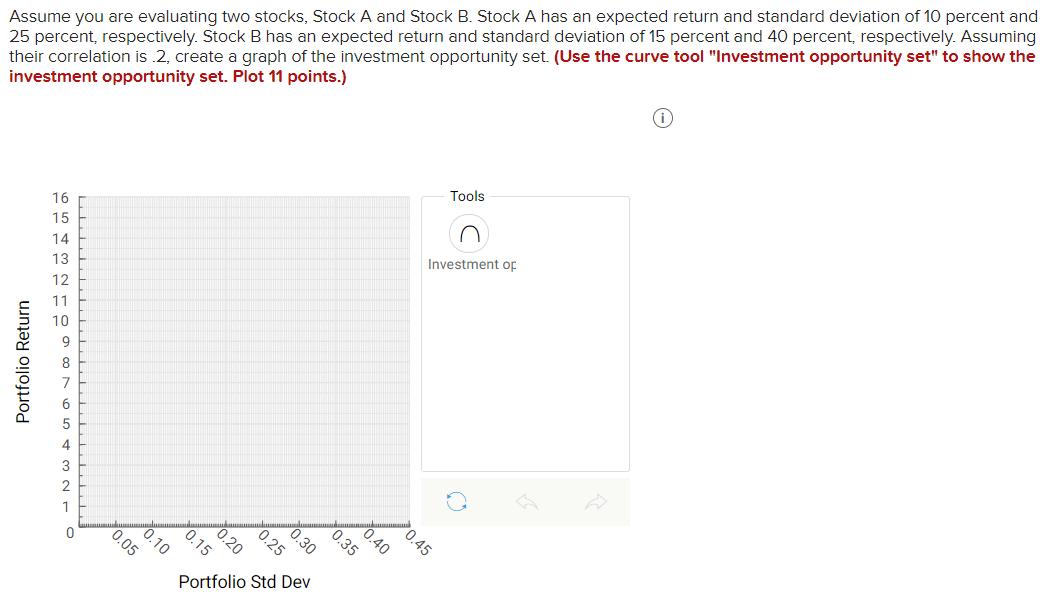
Assume you are evaluating two stocks, Stock A and Stock B. Stock A has an expected return and standard deviation of 10 percent and 25
Step by Step Solution
There are 3 Steps involved in it
Step: 1

Get Instant Access to Expert-Tailored Solutions
See step-by-step solutions with expert insights and AI powered tools for academic success
Step: 2

Step: 3
Ace Your Homework with AI
Get the answers you need in no time with our AI-driven, step-by-step assistance
Get Started
Portfolio Performance Measurement And Benchmarking
Authors: Jon Christopherson, David Carino, Wayne Ferson
1st Edition
0071496653, 978-0071496650