

Answered step by step
Verified Expert Solution
Question
1 Approved Answer
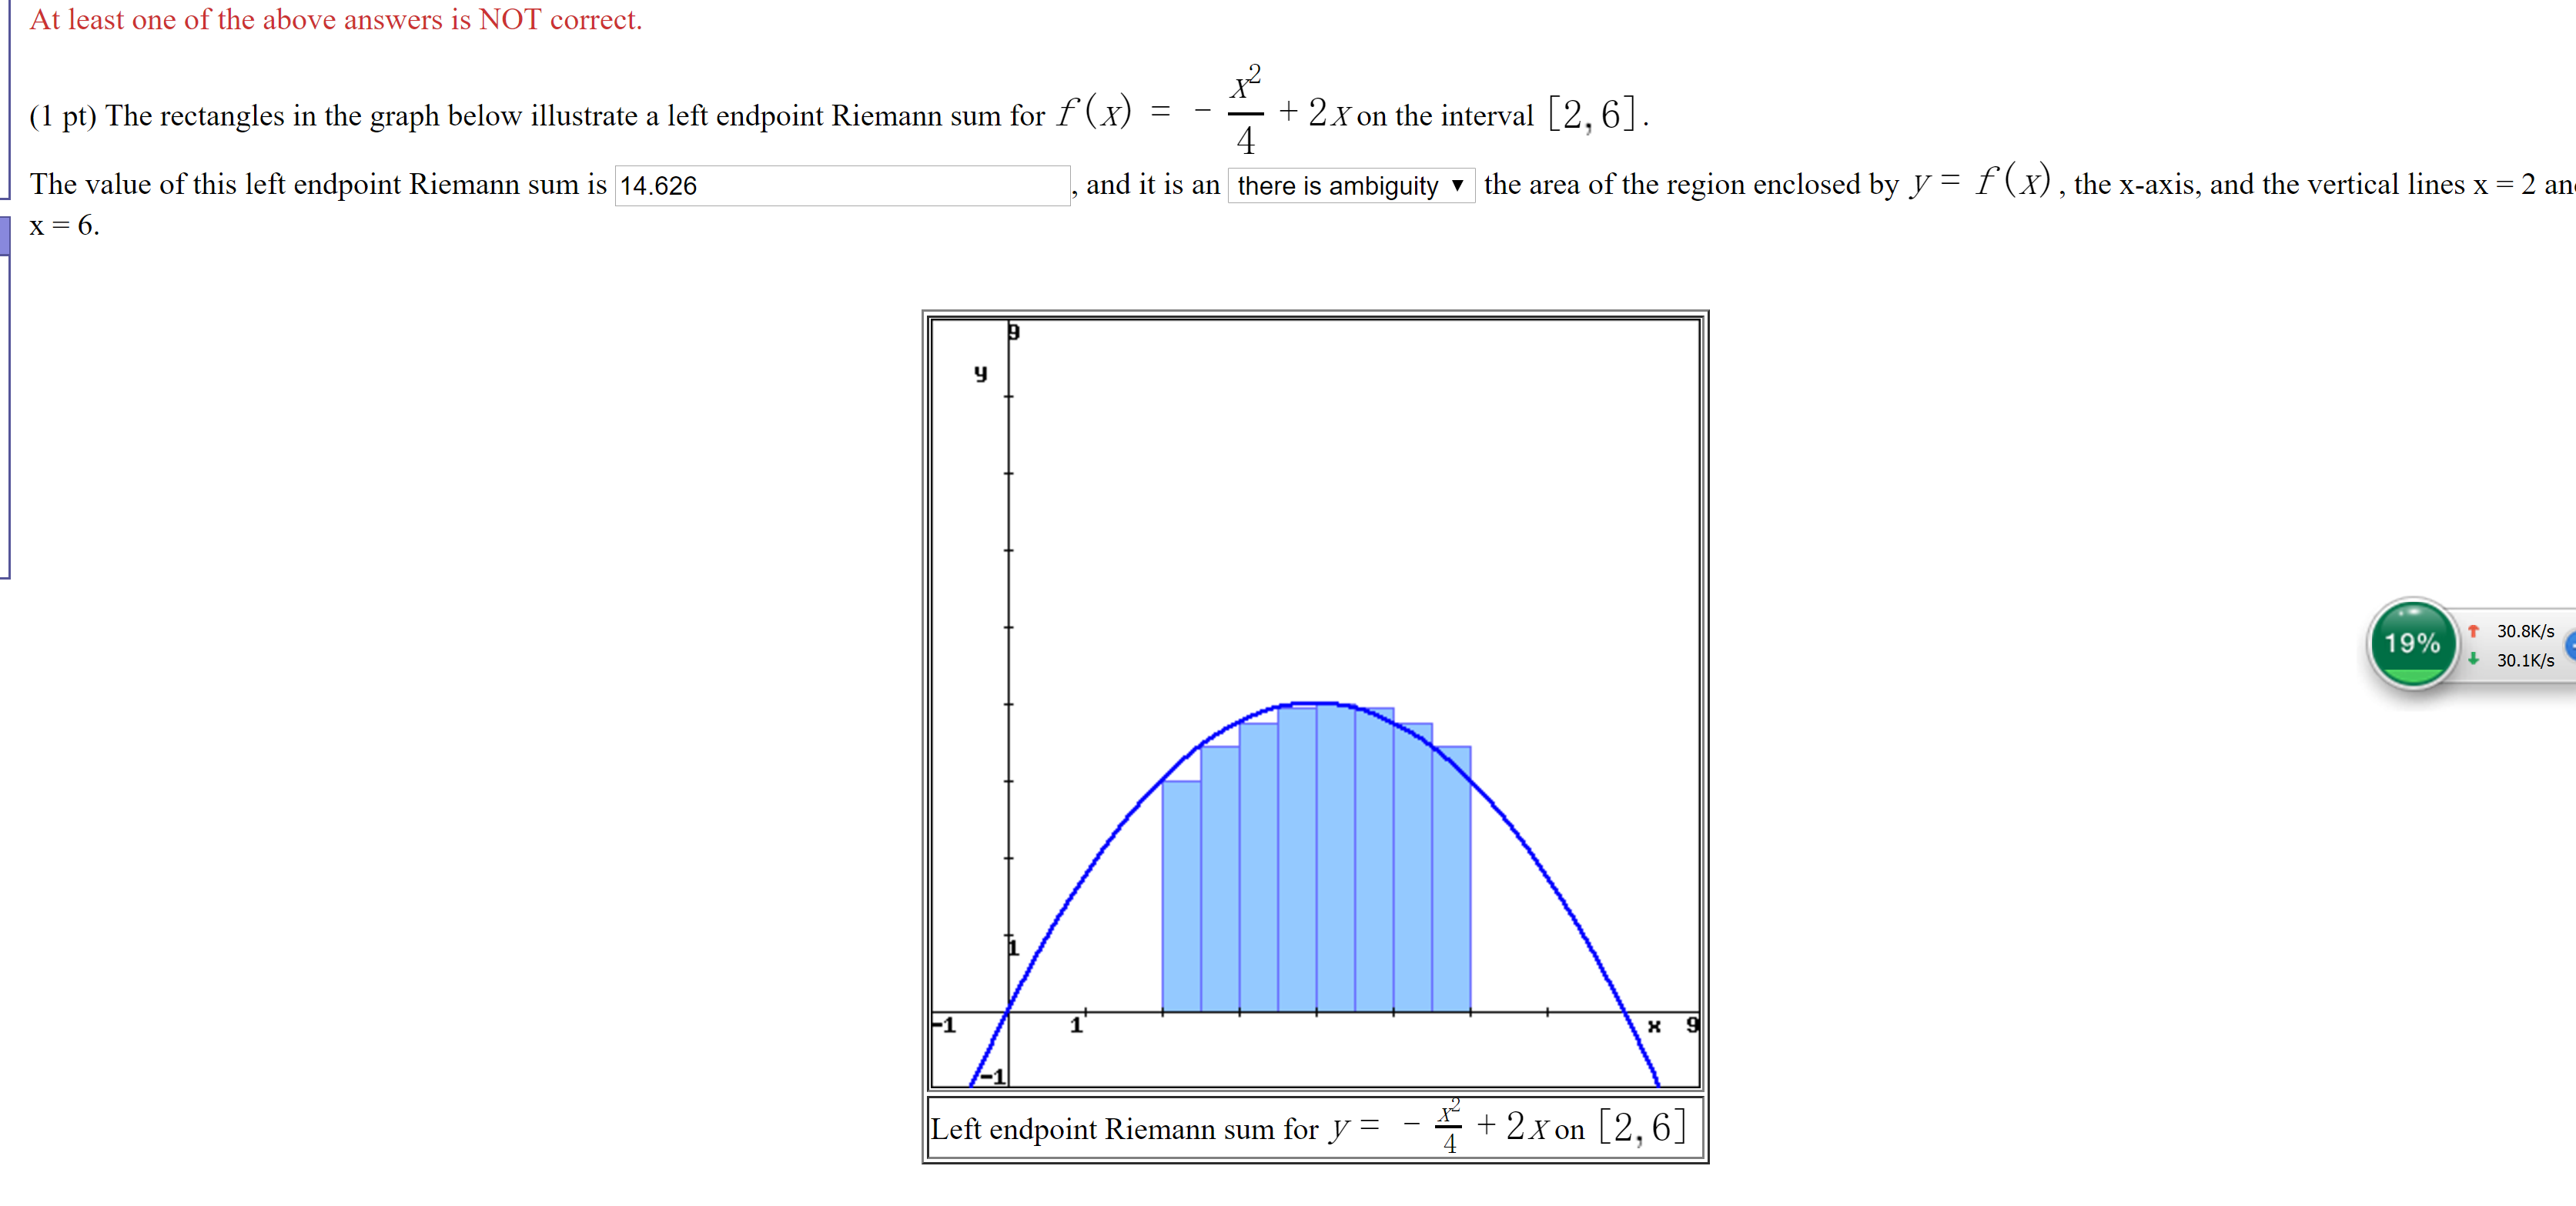
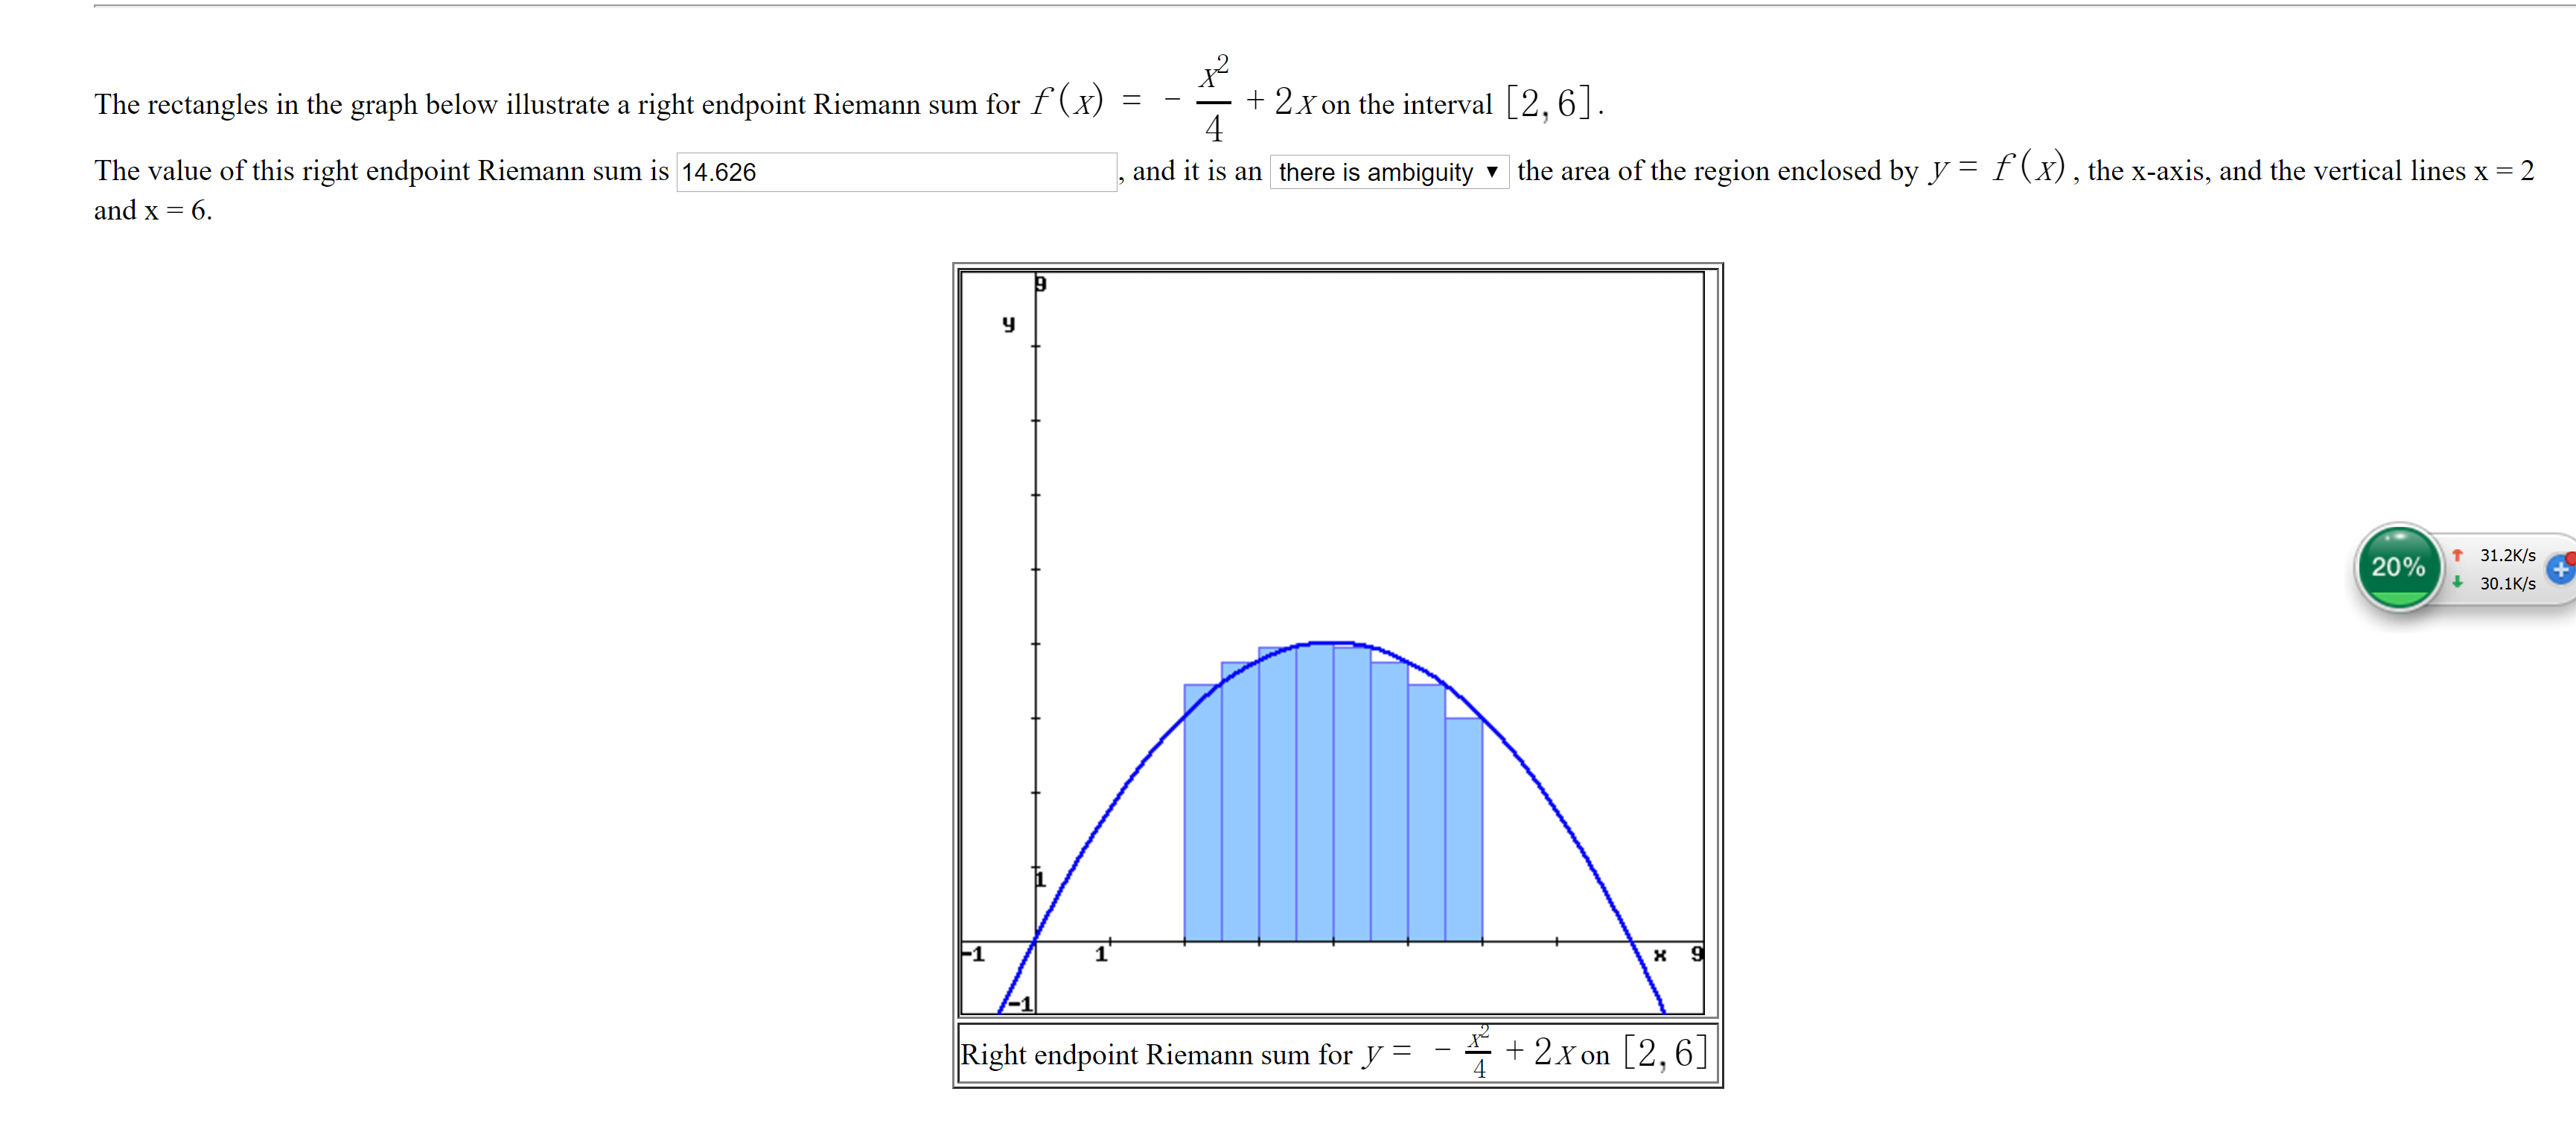
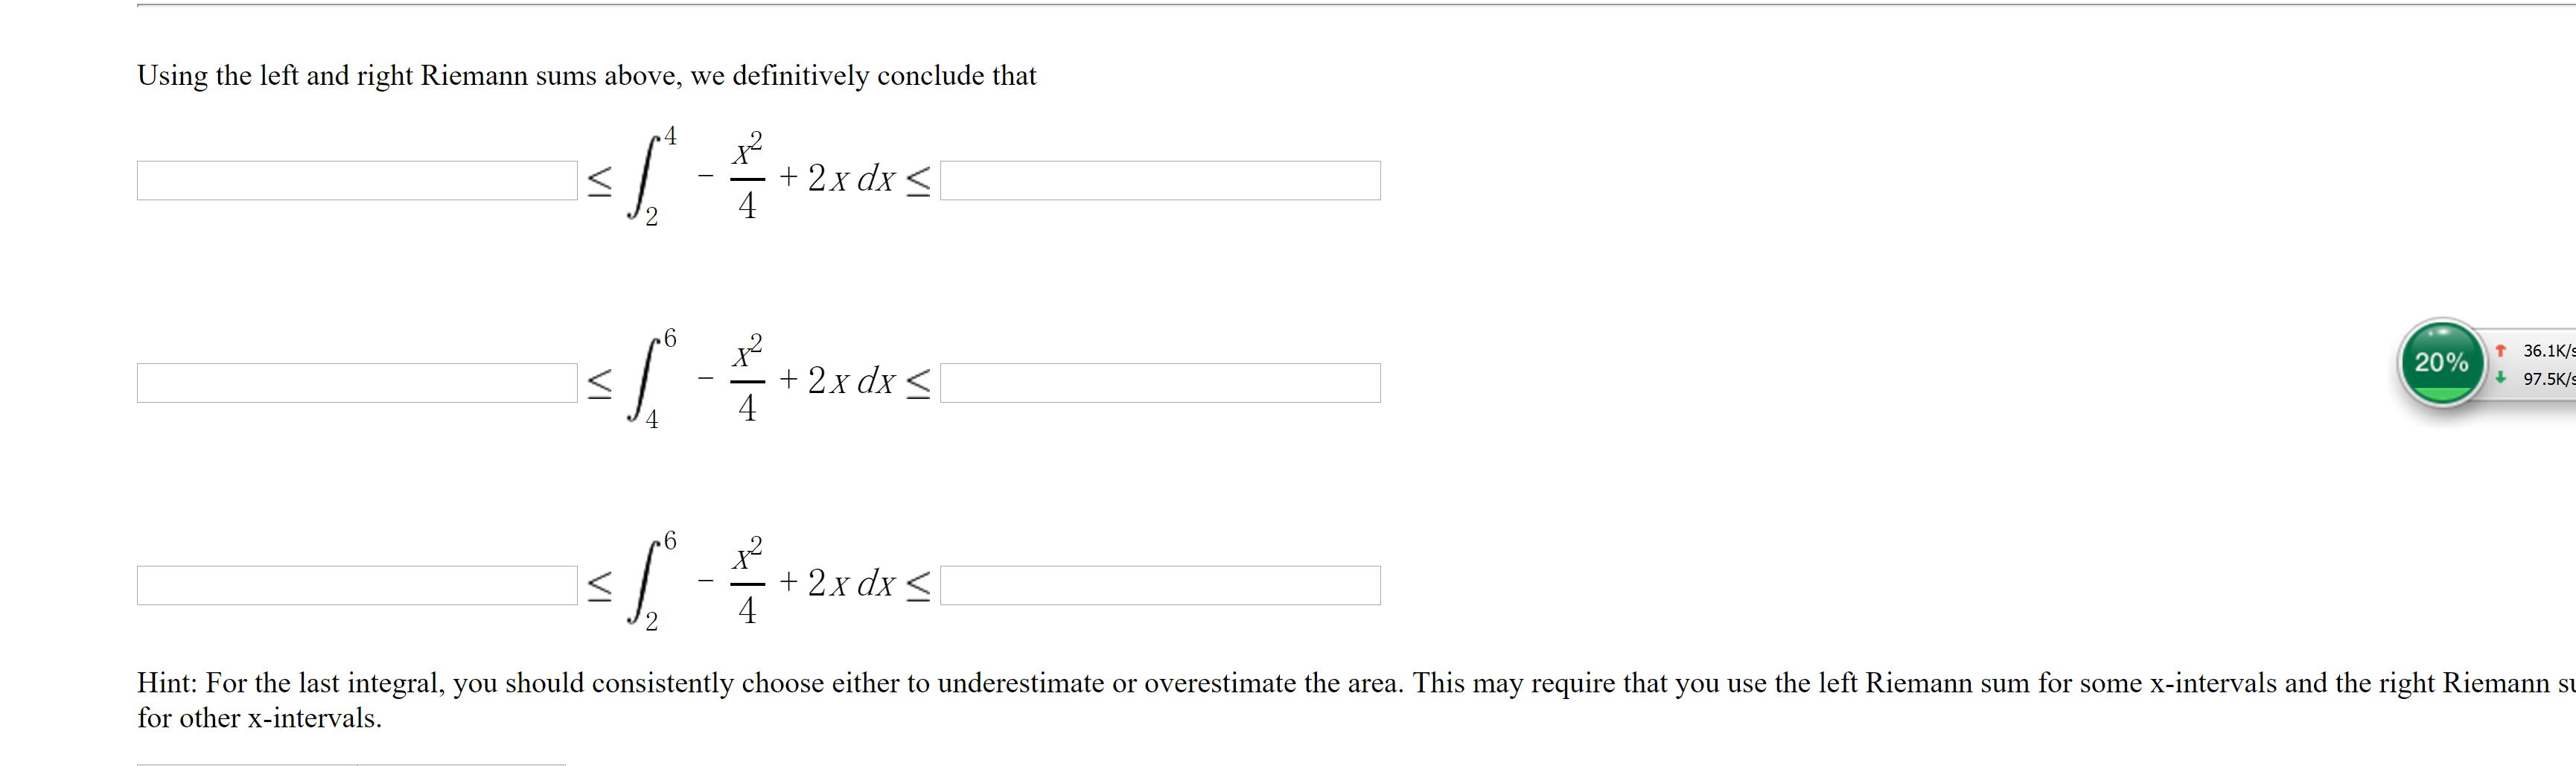
At least one of the above answers is NOT correct. (1 pt) The rectangles in the graph below illustrate a left endpoint Riemann sum for
Step by Step Solution
There are 3 Steps involved in it
Step: 1

Get Instant Access to Expert-Tailored Solutions
See step-by-step solutions with expert insights and AI powered tools for academic success
Step: 2

Step: 3
Ace Your Homework with AI
Get the answers you need in no time with our AI-driven, step-by-step assistance
Get Started
An Introduction to the Mathematics of Financial Derivatives
Authors: Ali Hirsa, Salih N. Neftci
3rd edition
012384682X, 978-0123846822