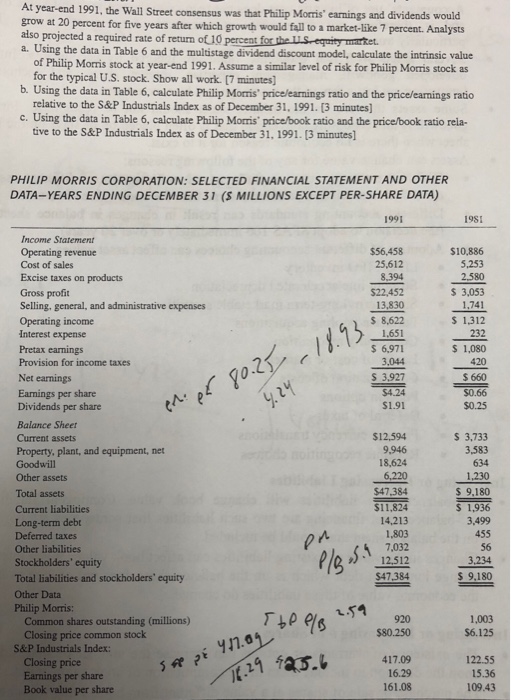
At year-end 1991, the Wall Street consensus was that Philip Morris' earnings and dividends would grow at 20 percent for five years after which growth would fall to a market-like 7 percent. Analysts also projected a required rate of return of 10 percent for the LLS-equity mntket a. Using the data in Table 6 and the multistage dividend discount model, calculate the intrinsic value of Philip Morris stock at year-end 1991. Assume a similar level of risk for Philip Morris stock as b. Using the data in Table 6, calculate Philip Morris' pricelearnings ratio and the pricelearnings ratio c. Using the data in Table 6, calculate Philip Morris' price/book ratio and the price/book ratio rela- for the typical U.S. stock. Show all work. [7 minutes] relative to the S&P Industrials Index as of December 31, 1991. [3 minutes] tive to the S&P Industrials Index as of December 31,1991. [3 minutes] PHILIP MORRIS CORPORATION: SELECTED FINANCIAL STATEMENT AND OTHER DATA-YEARS ENDING DECEMBER 31 (S MILLIONS EXCEPT PER-SHARE DATA) 1991 1981 Income Statement $56.458 25,612 $10,886 5,253 Cost of sales Excise taxes on products s 3,053 1,741 s 1,312 Gross proft Selling, general, and administrative expenses Operating income Interest expense Pretax earnings Provision for income taxes Net earnings S 6,971 3,927 $1.91 $ 1,080 Earnings per share Dividends per share Balance Sheet Current assets Property, plant, and equipment, net Goodwill Other assets Total assets Current liabilities Long-term debt Deferred taxes Other liabilities Stockholders' equity Total liabilities and stockholders' equity Other Data Philip Morris: s 3,733 6.220 $47.384 $11,824 14,213 1.230 9,180 S 1,936 7,032 12.5123,234 $47,384 Common shares outstanding (millions) Closing price common stock $6.125 S&P Industrials Index t11 fa5. 9 125s 417.09 Closing price Earnings per share Book value per share 15.36 109.43 161.08