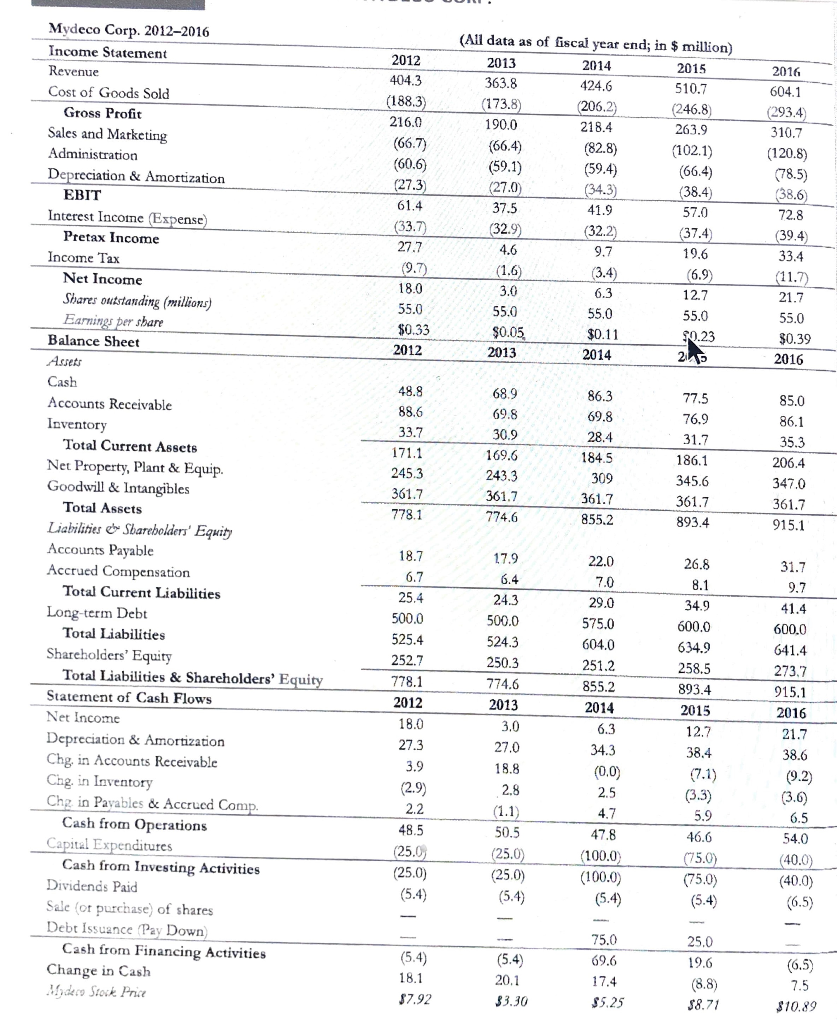
 Attached Table 2.5 shows financial statement data and stock price data for Mydeco Corp. What is Mydecos market capitalization at the end of each year? What is Mydecos market-to-book ratio at the end of each year? What is Mydecos enterprise value at the end of each year? please I can't post the table... I want an explanation of the answer
2012 404.3 (188.3) 216.0 (66.7) (60.6) (27.3 (All data as of fiscal year end; in $ million) 2013 2014 2015 363.8 424.6 510.7 (173.8) (206.2) (246.8) 190.0 218.4 263.9 (66.4) (82.8) (102.1) (59.1) (59.4) (66.4) (27.0 (34.3) (38.4) 37.5 41.9 57.0 32.9) (32.2) (37.4) 4.6 9.7 19.6 (1.6) (3.4) (6.9) 3.0 6.3 12.7 55.0 55.0 55.0 $0.05 $0.11 90.23 2013 2014 21 61.4 (33.7) 27.7 (9.7) 18.0 55.0 $0.33 2012 2016 604.1 (293.4) 310.7 (120.8) (78.5) (38.6) 72.8 (39.4) 33.4 (11.7 21.7 55.0 $0.39 2016 68.9 48.8 88.6 33.7 171.1 245.3 361.7 778.1 Mydeco Corp. 2012-2016 Income Statement Revenue Cost of Goods Sold Gross Profit Sales and Marketing Administration Depreciation & Amortization EBIT Interest Income Expense) Pretax Income Income Tax Net Income Shares outstanding (millions) Earnings per share Balance Sheet Assets Cash Accounts Receivable Inventory Total Current Assets Net Property, Plant & Equip. Goodwill & Intangibles Total Assets Liabilities el Shareholders' Equity Accounts Payable Accrued Compensation Total Current Liabilities Long-term Debt Total Liabilities Shareholders' Equity Total Liabilities & Shareholders' Equity Statement of Cash Flows Net Income Depreciation & Amortization Chg, in Accounts Receivable Chg. in Inventory Chg in Payables & Accrued Comp. Cash from Operations Capital Expenditures Cash from Investing Activities Dividends Paid Sale (or purchase) of shares Debt issuance Pay Down Cash from Financing Activities Change in Cash Mide Stock Price 69.8 30.9 169.6 243.3 361.7 774.6 86.3 69.8 28.4 184.5 309 361.7 855.2 77.5 76.9 31.7 186.1 345.6 361.7 893.4 85.0 86.1 35.3 206.4 347.0 361.7 915.1 26.8 18.7 6.7 25.4 500.0 525.4 252.7 778.1 2012 18.0 27.3 3.9 (2.9) 2.2 48.5 (25.0 (25.0) (5.4) 17.9 6.4 24.3 500.0 524.3 250.3 774.6 2013 3.0 27.0 18.8 2.8 (1.1) 50.5 (25.0) (25:0) (5.4) 22.0 7.0 29.0 575.0 604.0 251.2 855.2 2014 6.3 34.3 (0,0) 2.5 4.7 47.8 (100.0) (100.0) (5.4) 8.1 34.9 600.0 634.9 258.5 893.4 2015 12.7 38.4 (7.1) (3.3) 5.9 46.6 (75.0) (75.0) (5.4) 31.7 9.7 41.4 600.0 641.4 273.7 915.1 2016 21.7 38.6 (9.2) (3.6) 6.5 54.0 (40.0) (40.0) (6.5) (5.4) 18.1 $7.92 (5.4) 20.1 33.30 75.0 69.6 17.4 $5.25 25.0 19.6 (8.8) $8.71 (6.5) 7.5 $10.89