

Answered step by step
Verified Expert Solution
Question
1 Approved Answer
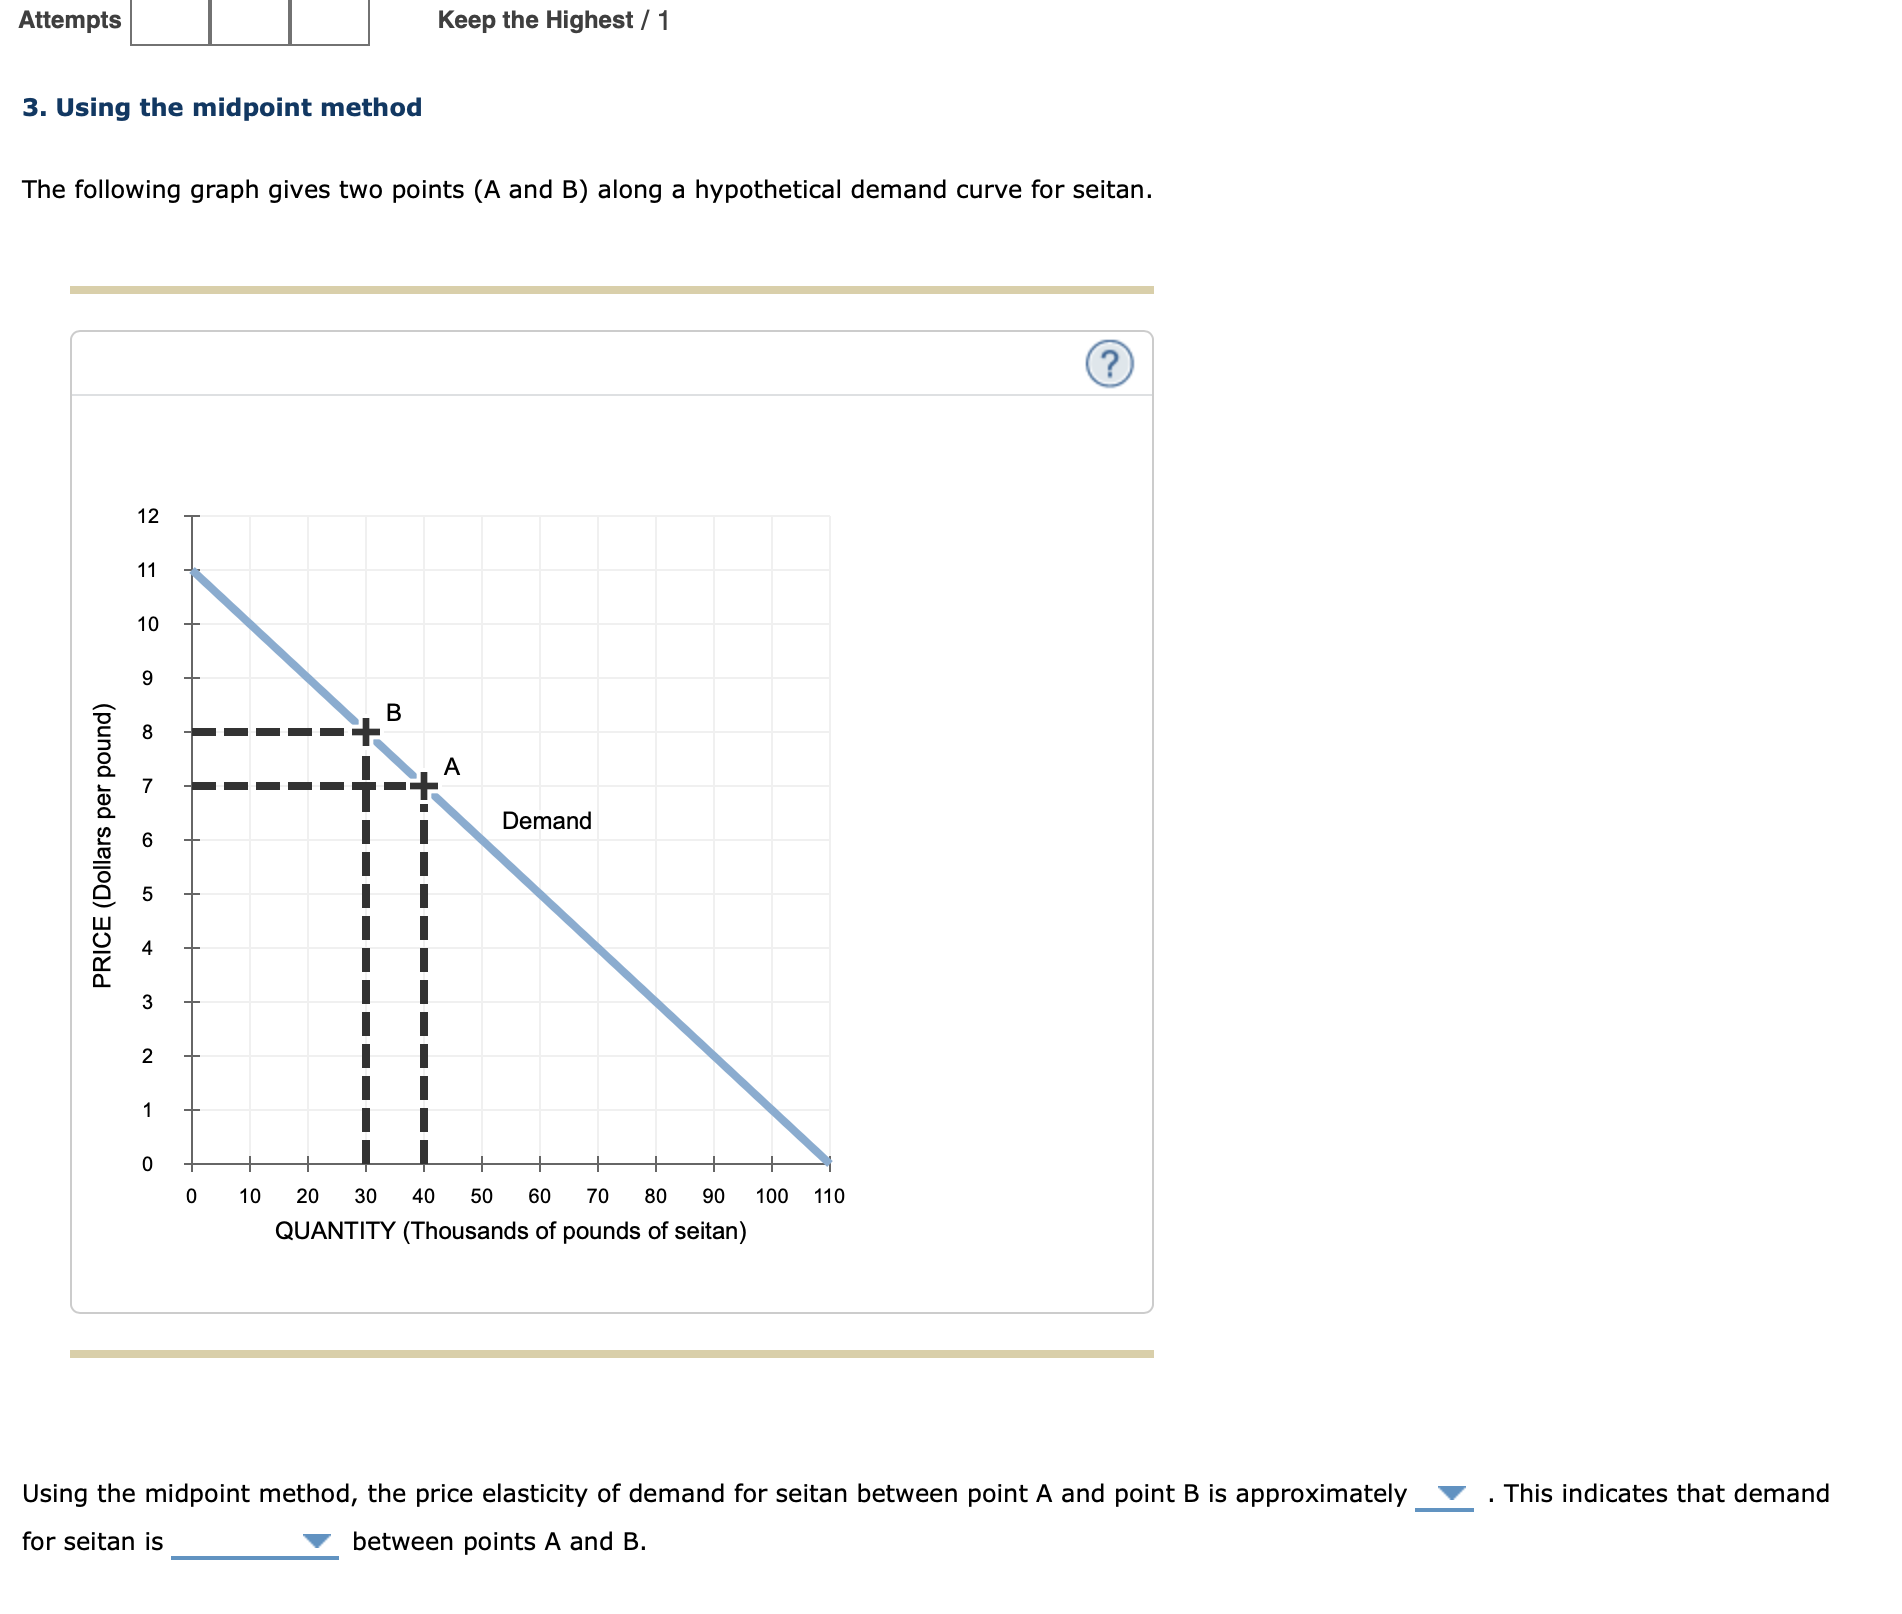
Attempts Keep the Highest / 1 3. Using the midpoint method The following graph gives two points (A and B) along a hypothetical demand curve
Step by Step Solution
There are 3 Steps involved in it
Step: 1

Get Instant Access to Expert-Tailored Solutions
See step-by-step solutions with expert insights and AI powered tools for academic success
Step: 2

Step: 3
Ace Your Homework with AI
Get the answers you need in no time with our AI-driven, step-by-step assistance
Get Started
The Economics Of Inequality
Authors: Thomas Piketty, Arthur Goldhammer
1st Edition
0674504801, 9780674504806