Question
Attendance at Victoria's newest theme park has been as follows; Year Quarter Guests(in 000's) 1 Winter 123 Spring 154 Summer 218 Fall 124 2

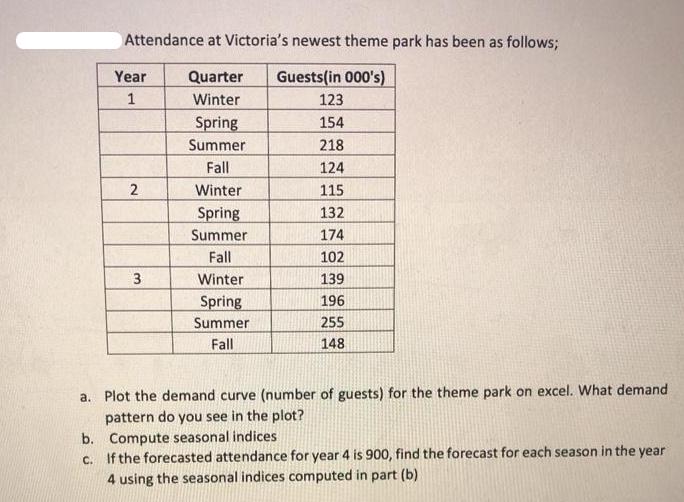
Attendance at Victoria's newest theme park has been as follows; Year Quarter Guests(in 000's) 1 Winter 123 Spring 154 Summer 218 Fall 124 2 Winter 115 Spring 132 Summer 174 Fall 102 3 Winter 139 Spring 196 Summer 255 Fall 148 a. Plot the demand curve (number of guests) for the theme park on excel. What demand pattern do you see in the plot? b. Compute seasonal indices c. If the forecasted attendance for year 4 is 900, find the forecast for each season in the year 4 using the seasonal indices computed in part (b)
Step by Step Solution
There are 3 Steps involved in it
Step: 1

Get Instant Access to Expert-Tailored Solutions
See step-by-step solutions with expert insights and AI powered tools for academic success
Step: 2

Step: 3

Ace Your Homework with AI
Get the answers you need in no time with our AI-driven, step-by-step assistance
Get StartedRecommended Textbook for
Operations Management
Authors: Jay Heizer, Barry Render, Paul Griffin
1st Canadian Edition
132687585, 978-0133357516, 133357511, 978-0132687584
Students also viewed these Marketing questions
Question
Answered: 1 week ago
Question
Answered: 1 week ago
Question
Answered: 1 week ago
Question
Answered: 1 week ago
Question
Answered: 1 week ago
Question
Answered: 1 week ago
Question
Answered: 1 week ago
Question
Answered: 1 week ago
Question
Answered: 1 week ago
Question
Answered: 1 week ago
Question
Answered: 1 week ago
Question
Answered: 1 week ago
Question
Answered: 1 week ago
Question
Answered: 1 week ago
Question
Answered: 1 week ago
Question
Answered: 1 week ago
Question
Answered: 1 week ago
Question
Answered: 1 week ago
Question
Answered: 1 week ago
Question
Answered: 1 week ago
Question
Answered: 1 week ago
View Answer in SolutionInn App


