Answered step by step
Verified Expert Solution
Question
1 Approved Answer
Aurelia Dimas, managing director of fixed income at Orrington Financial Partners, had spent the first week of April 2010 on a whirlwind tour of
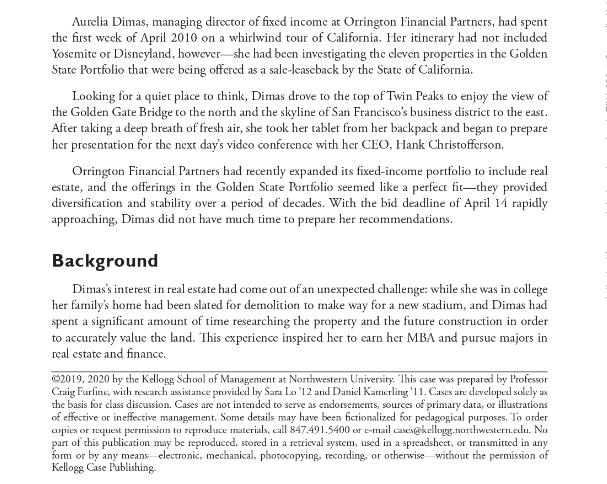
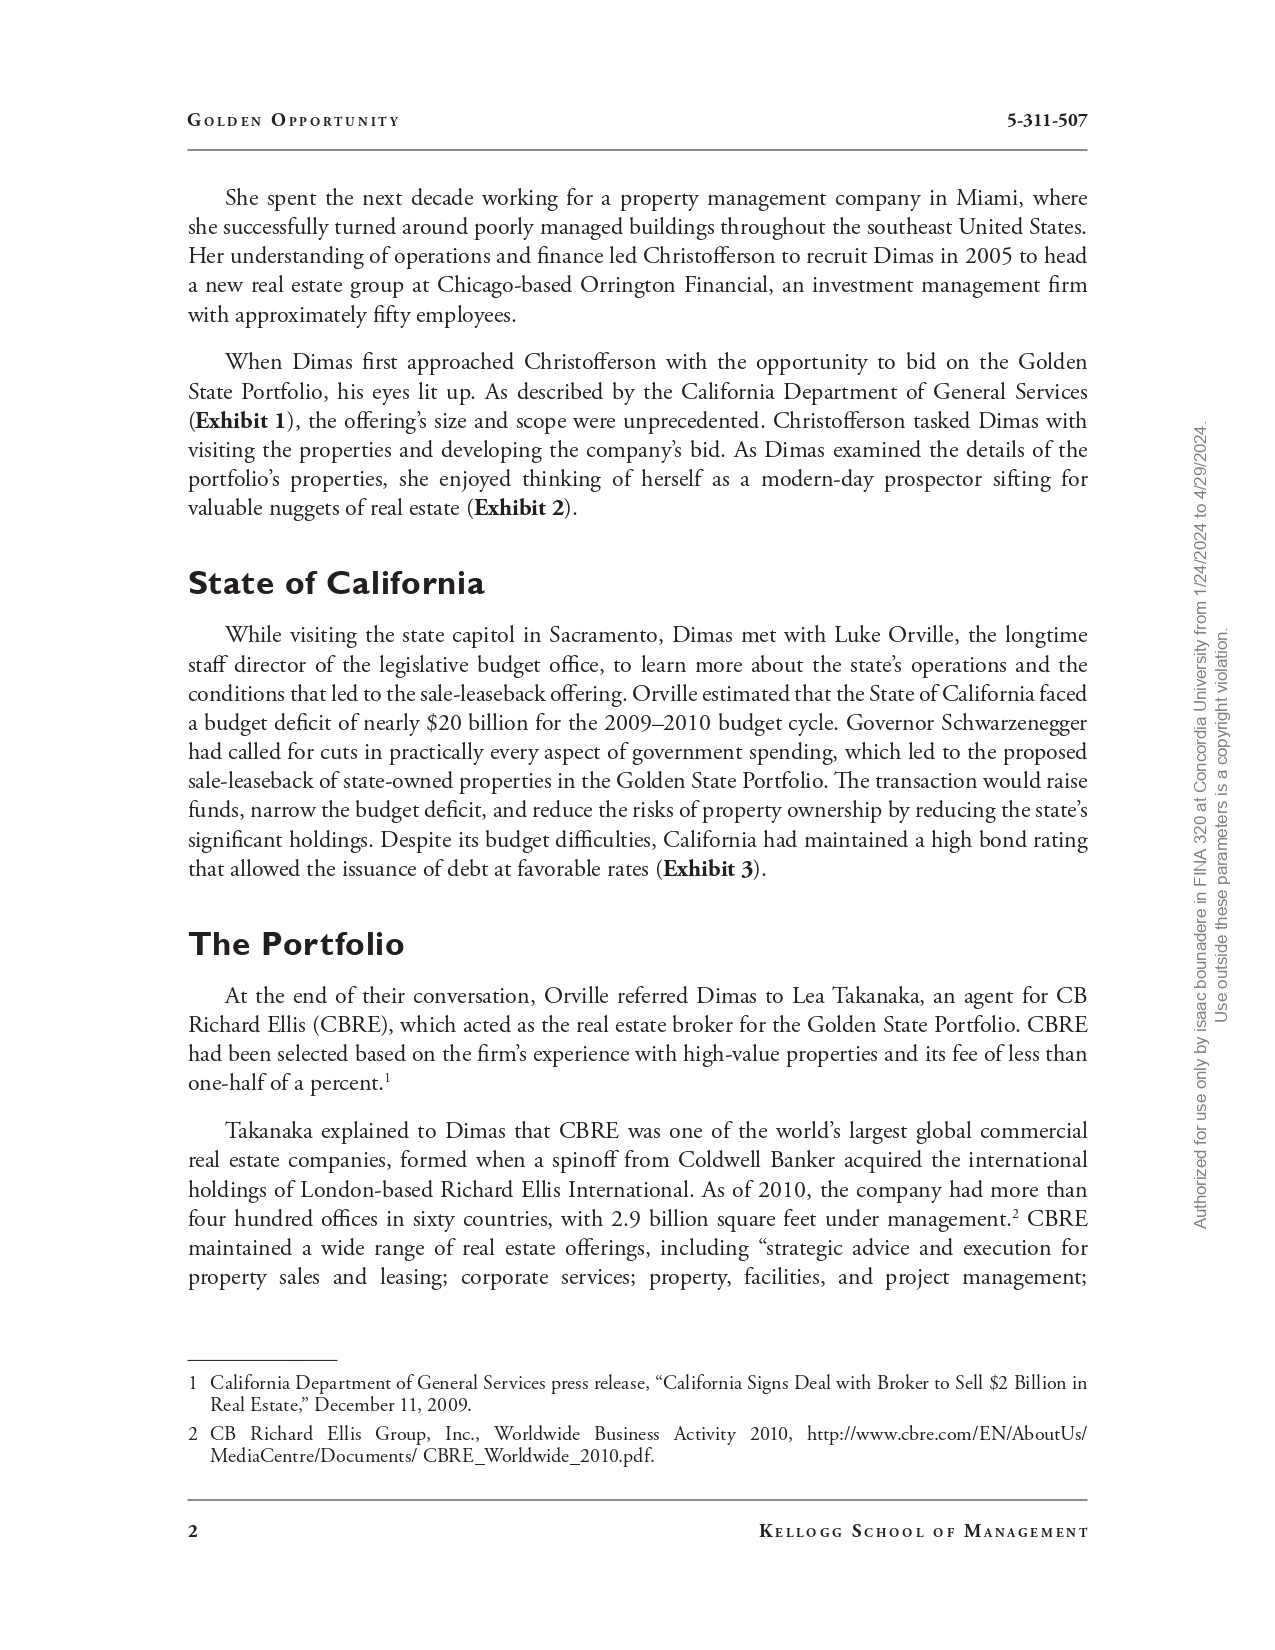
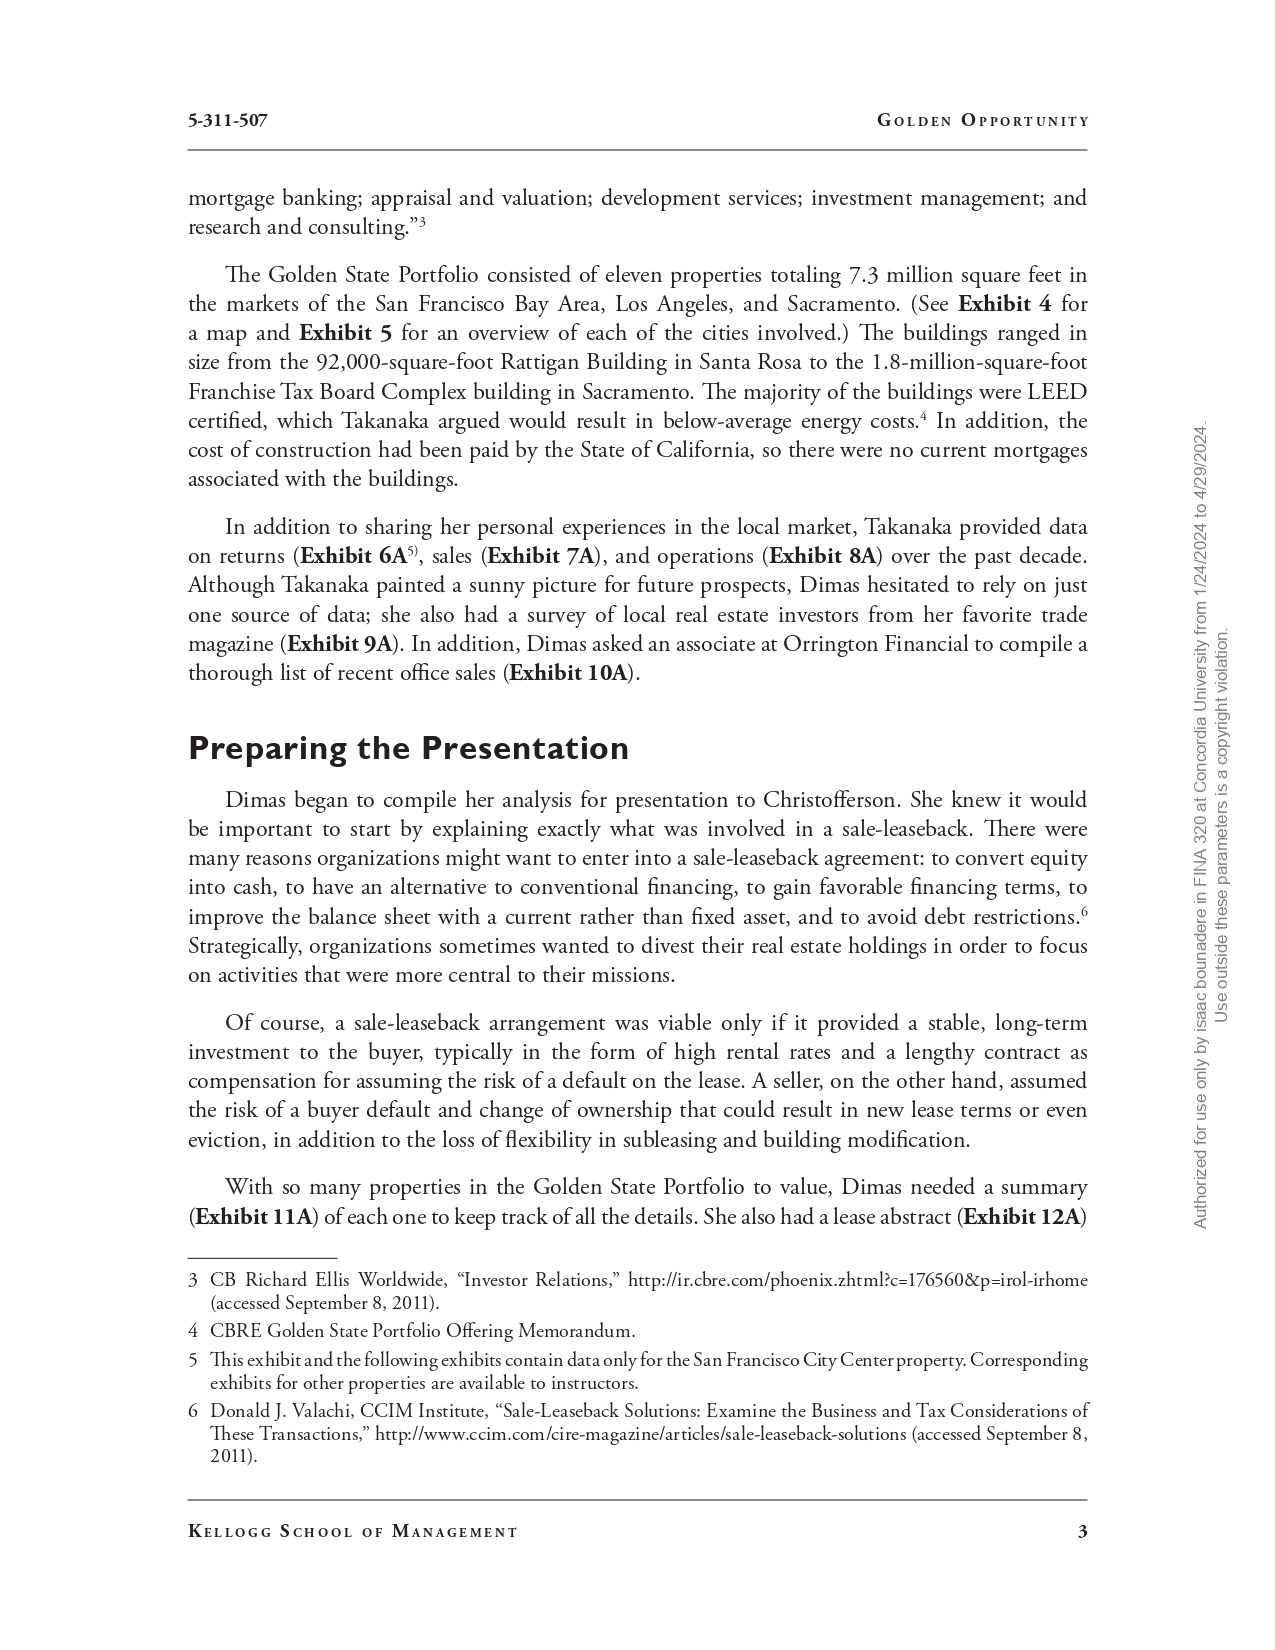
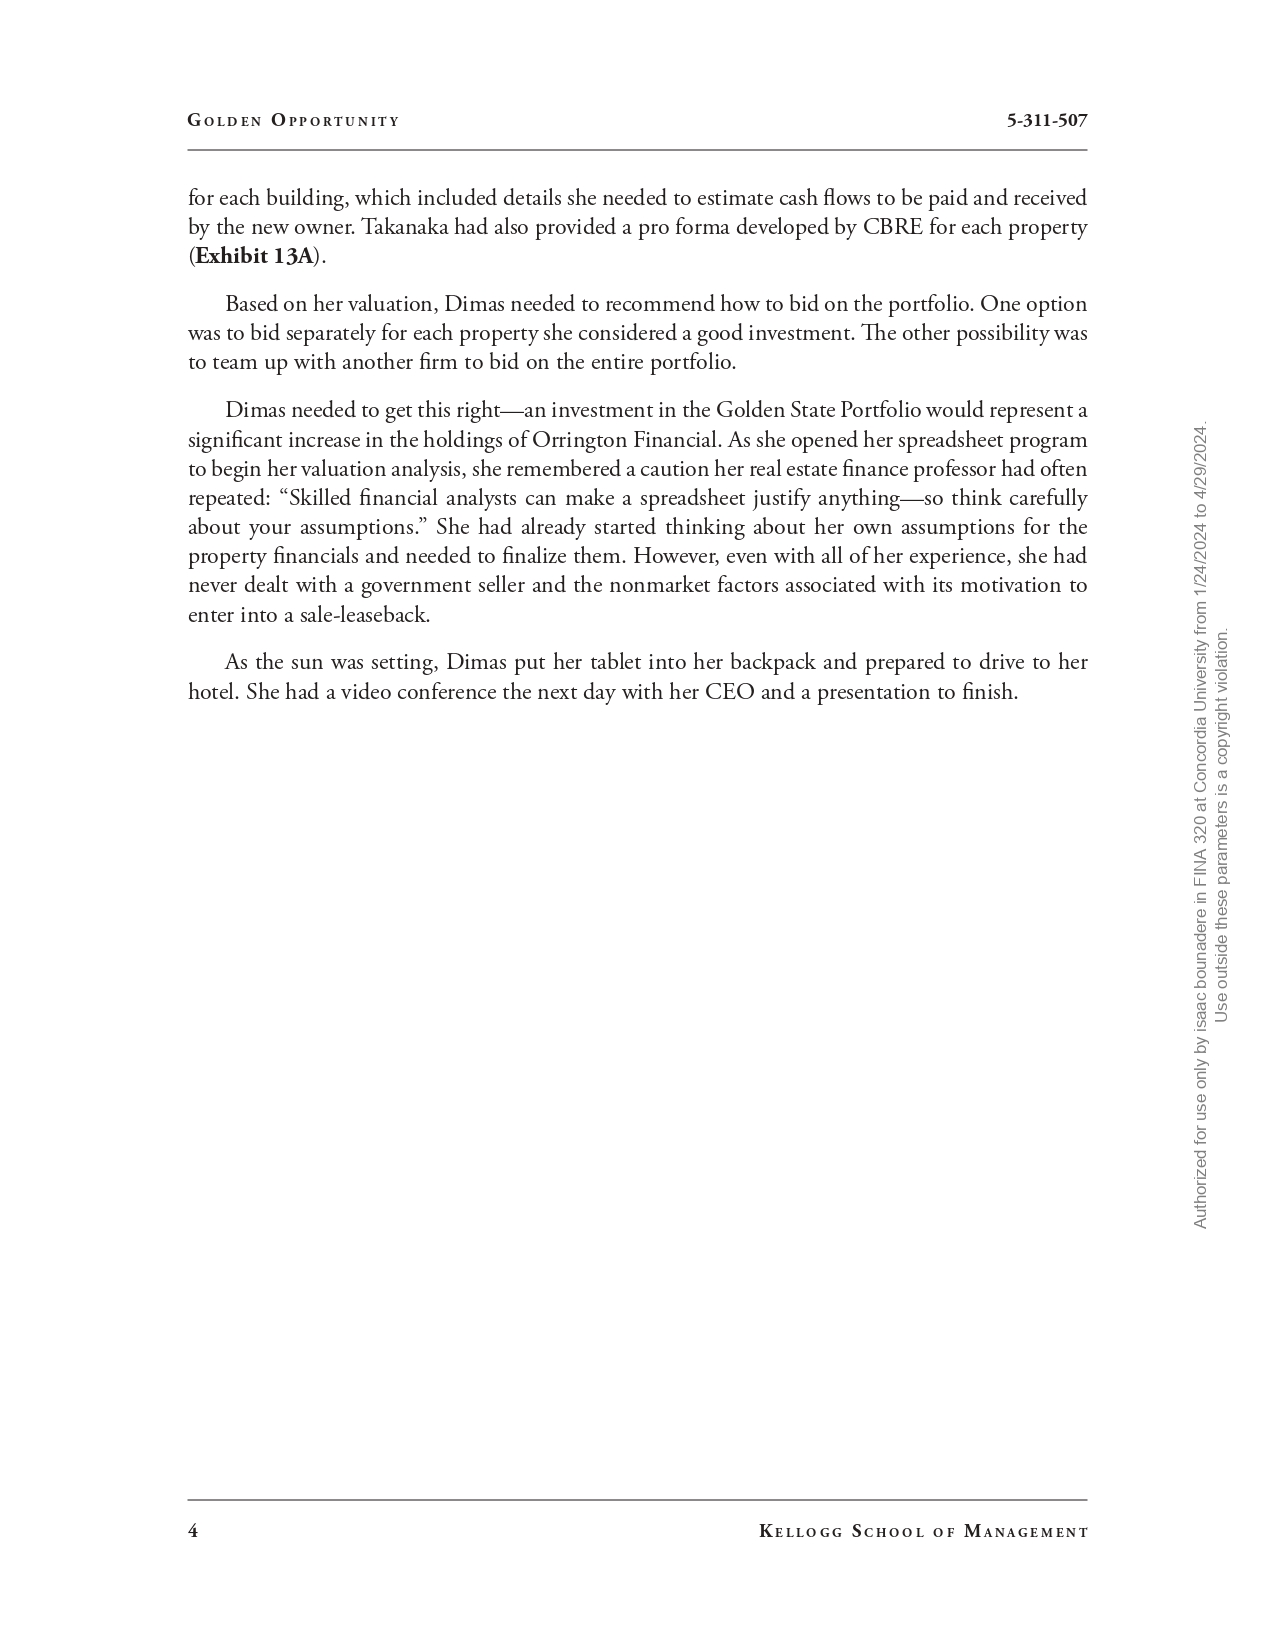
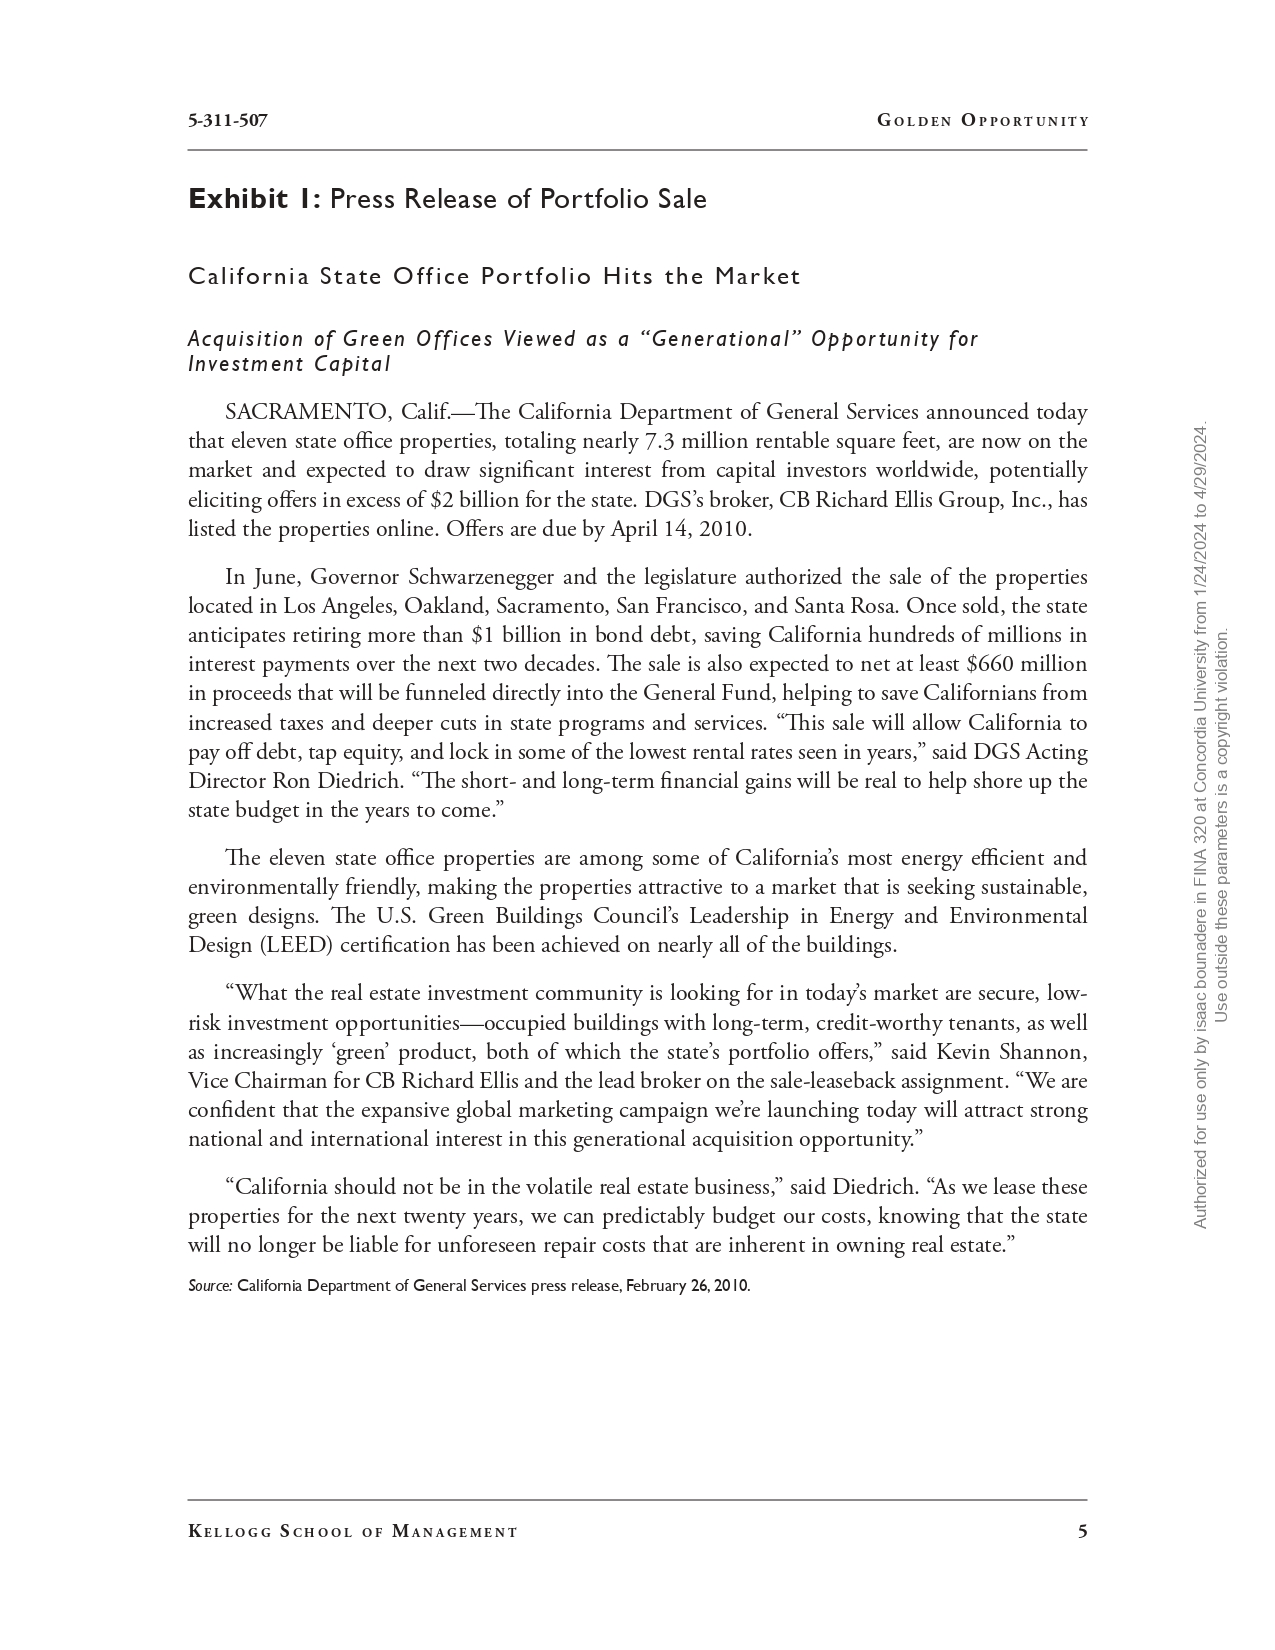
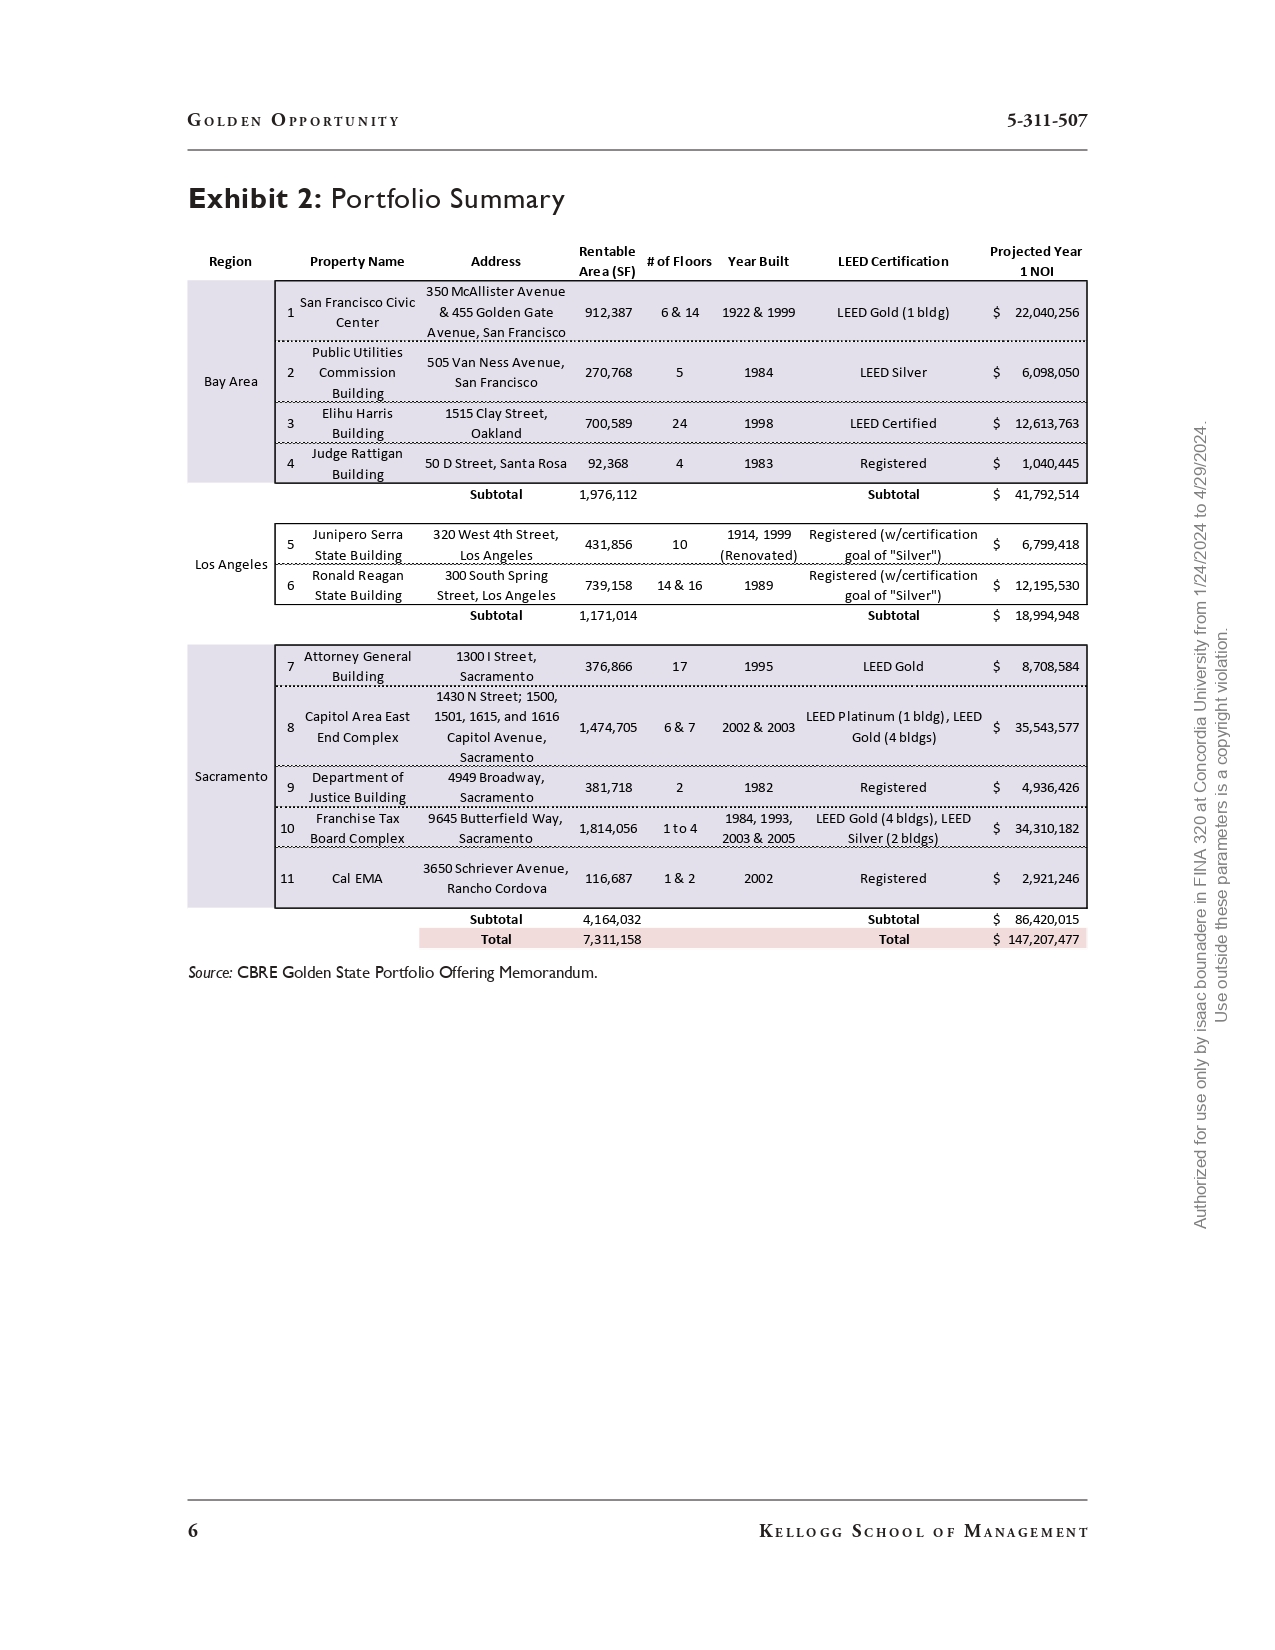
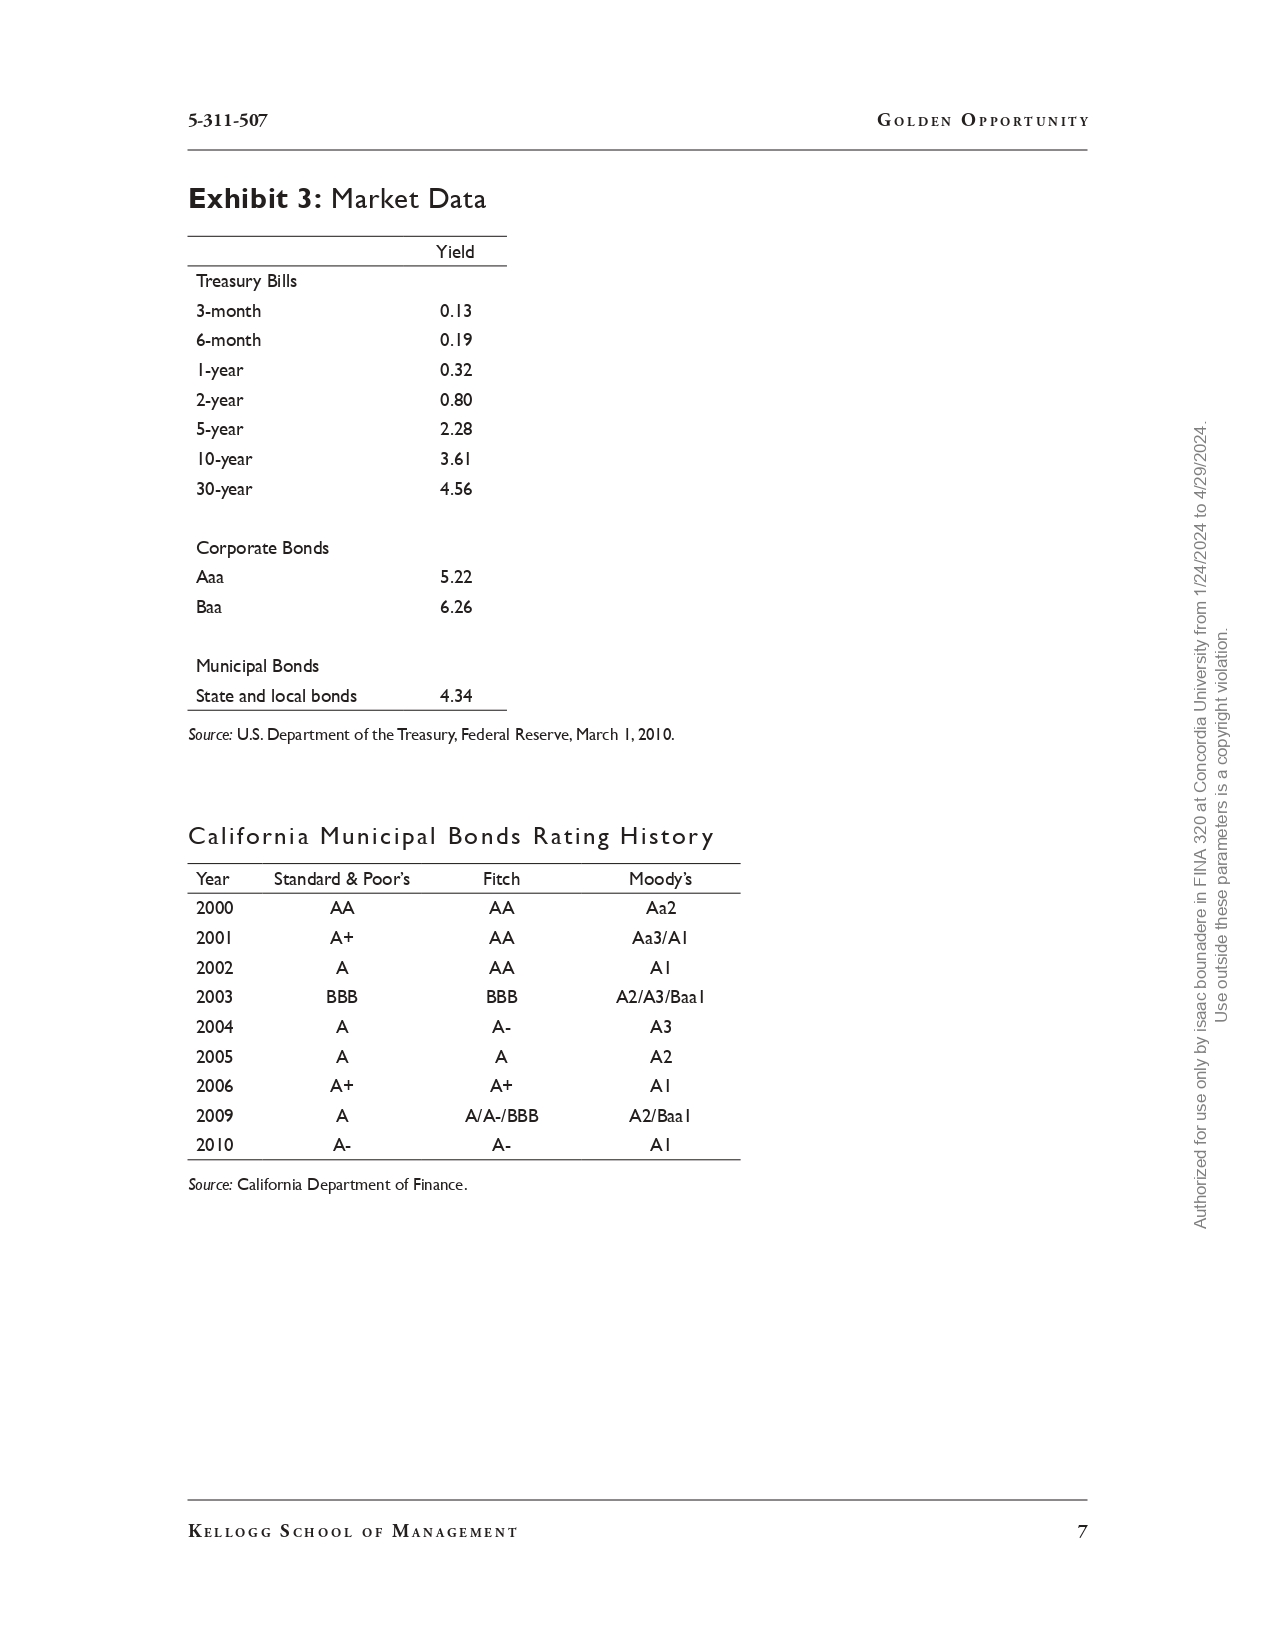
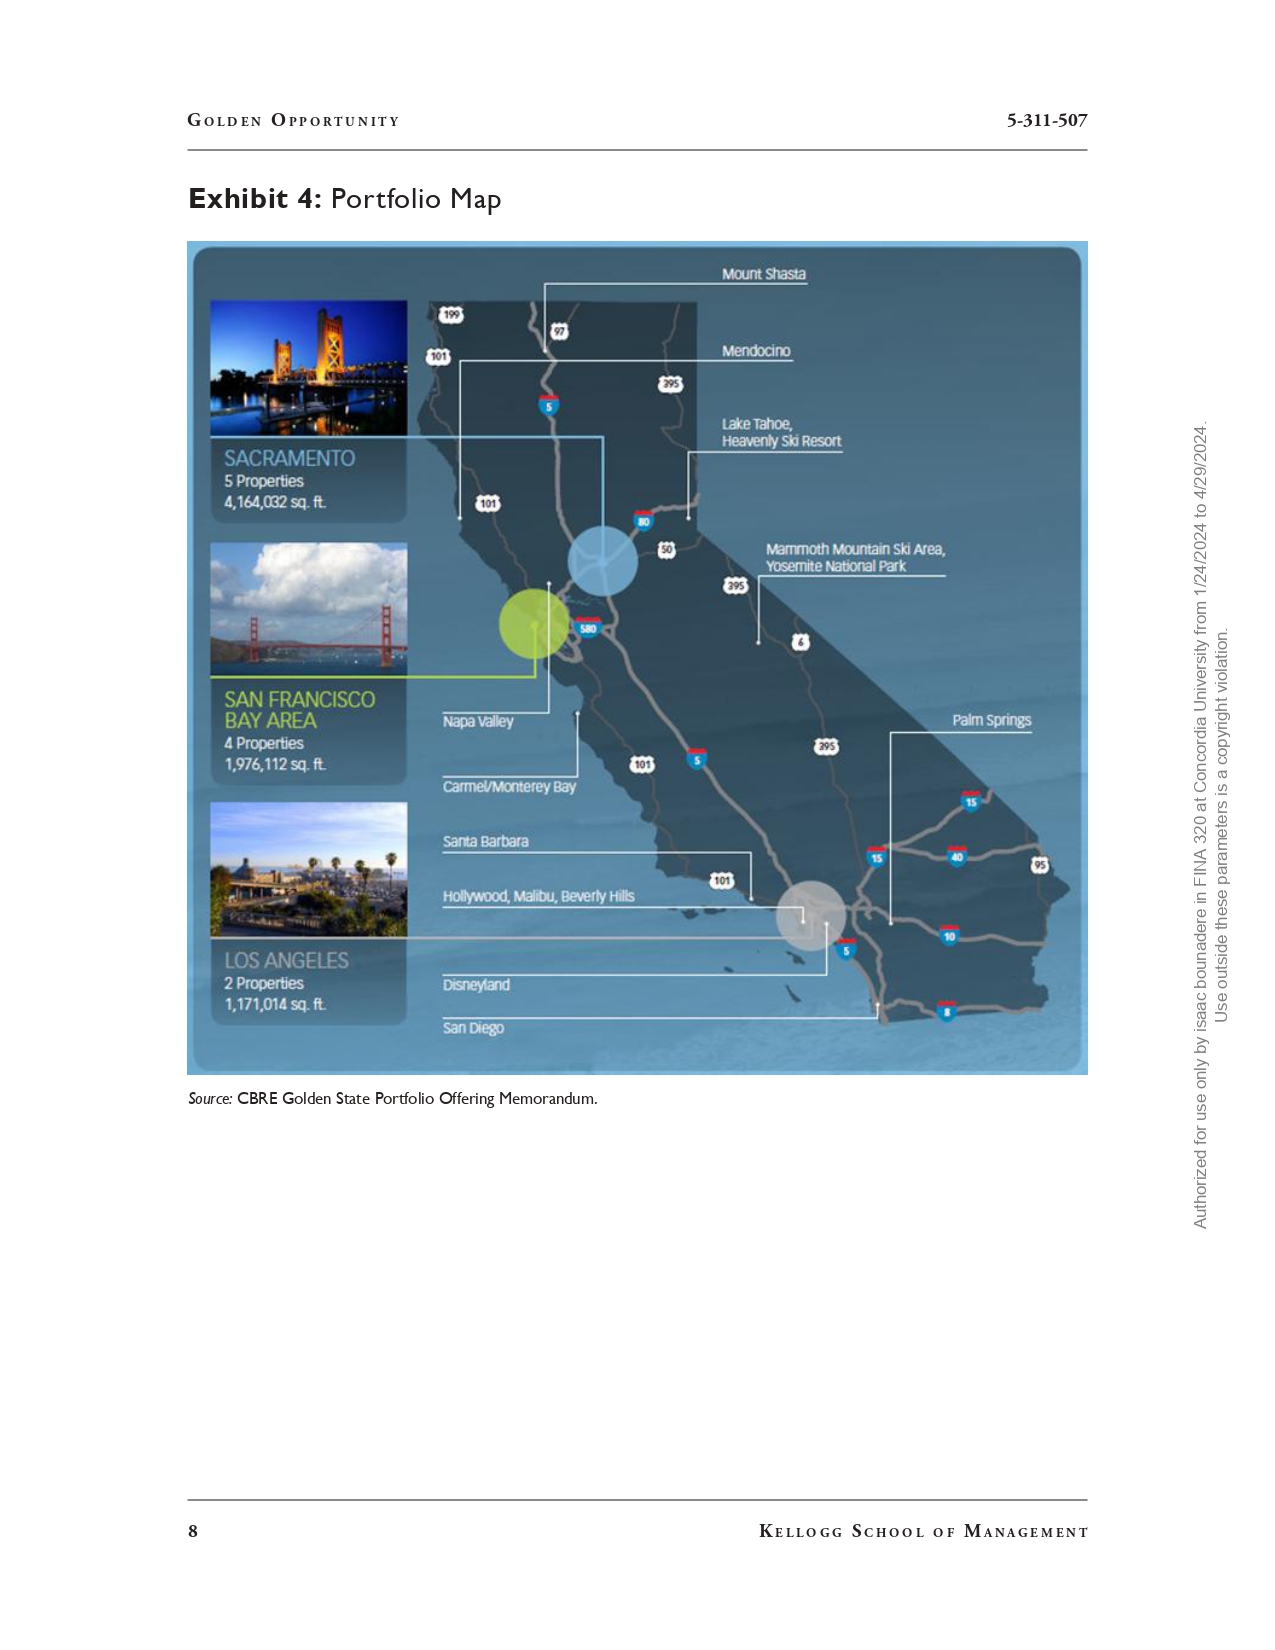
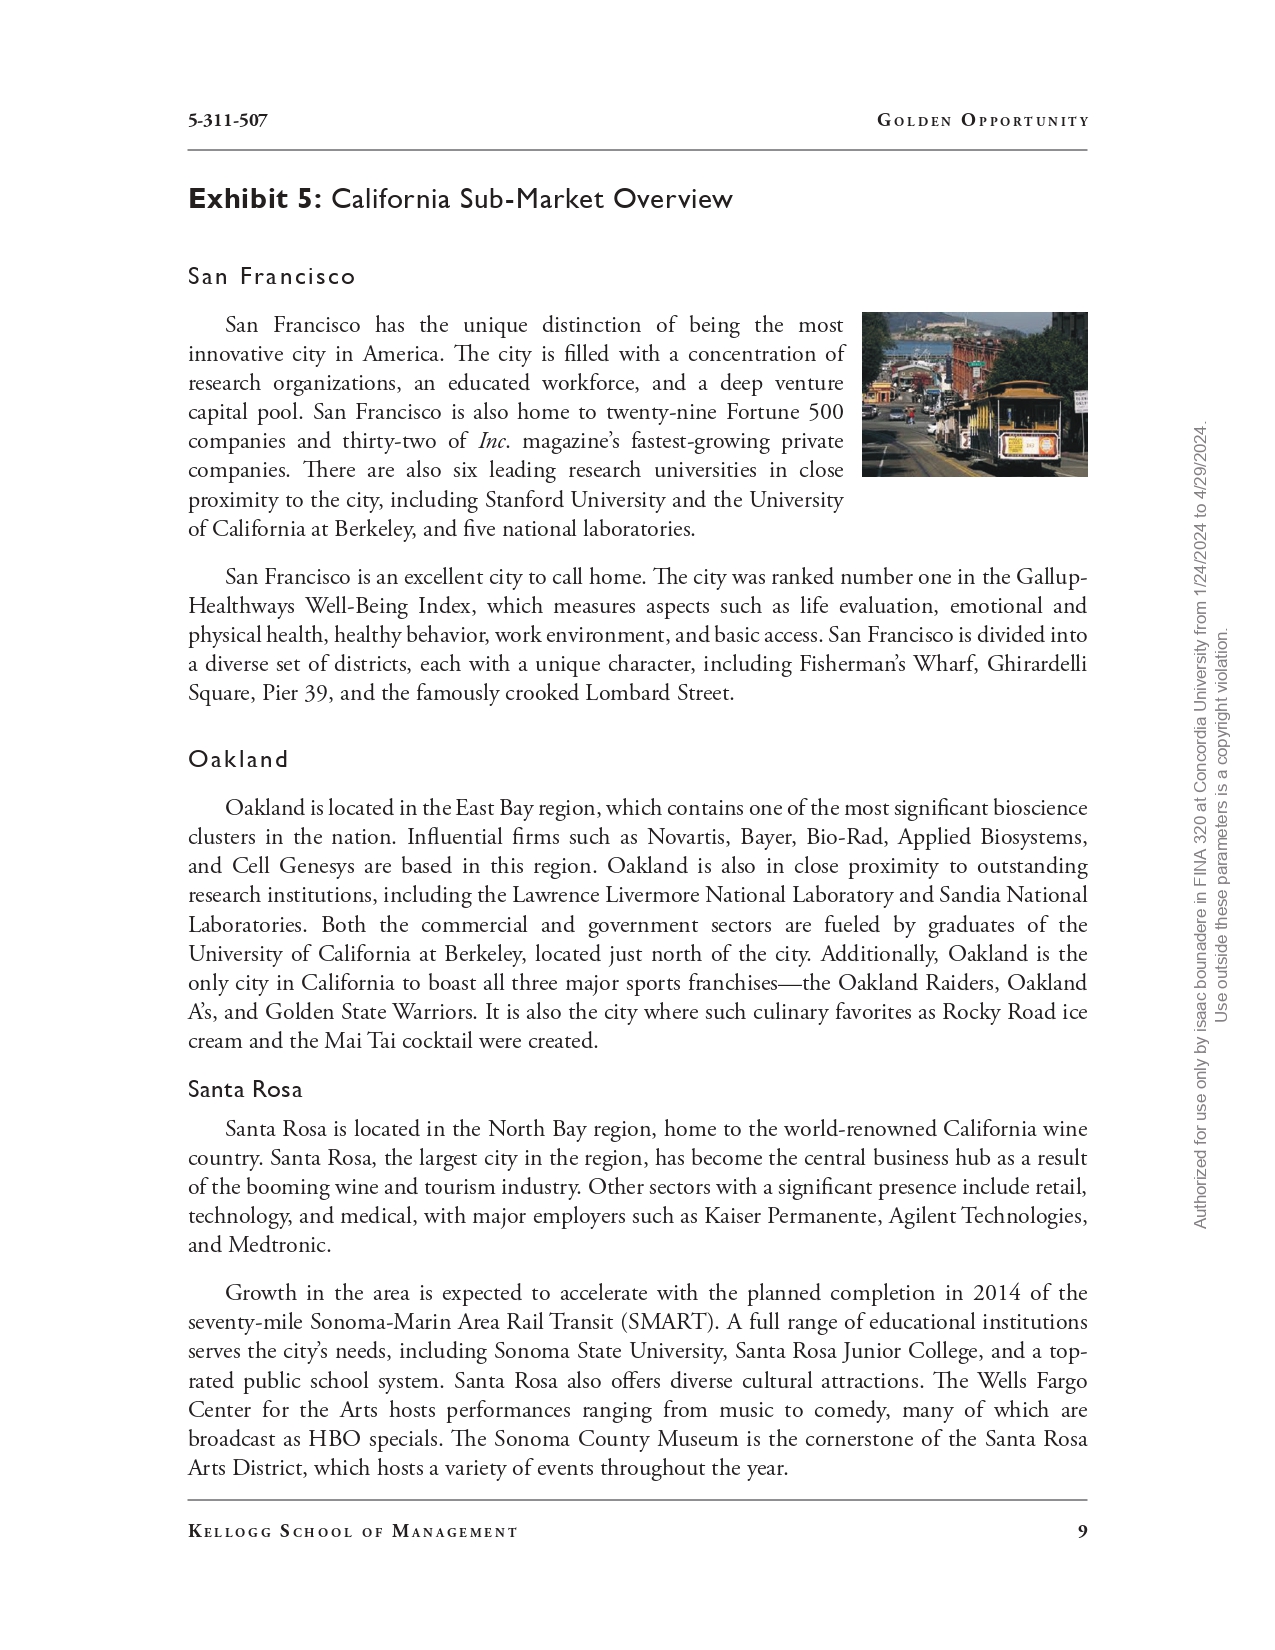
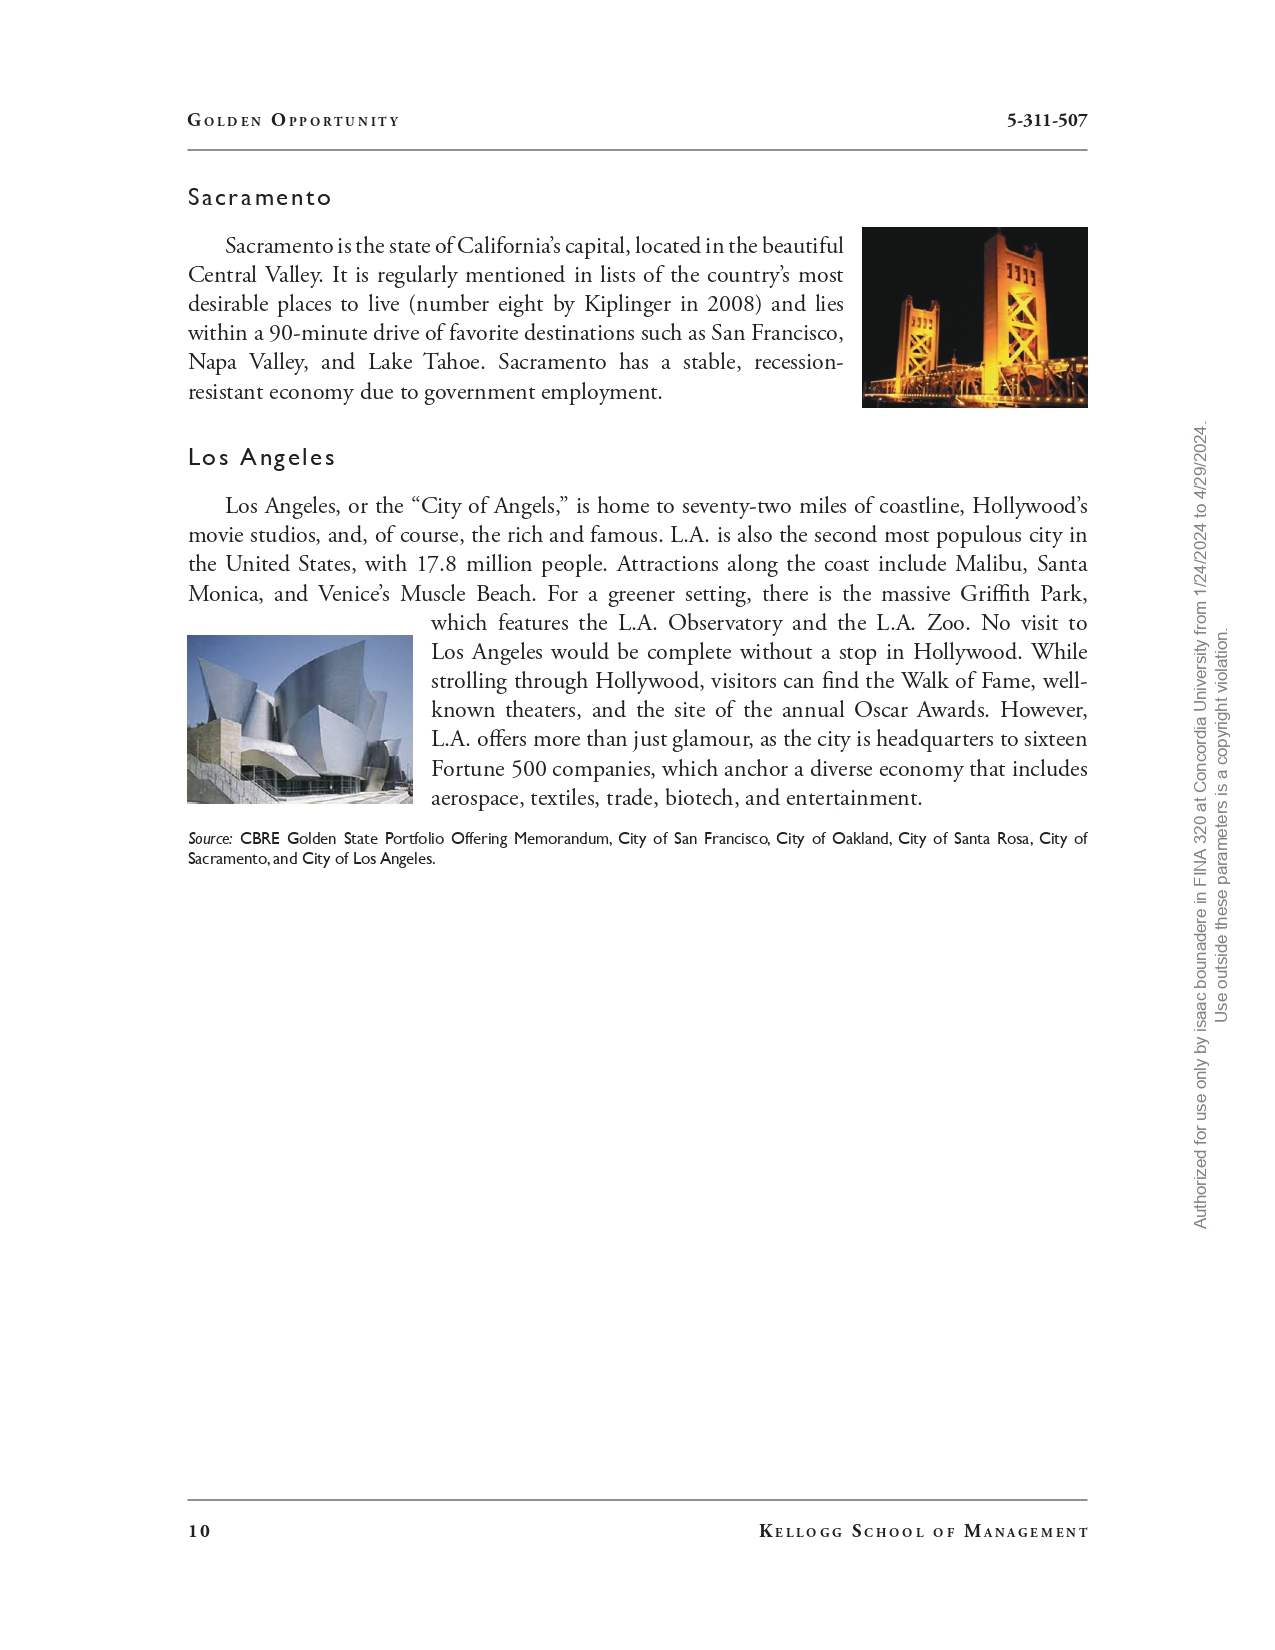
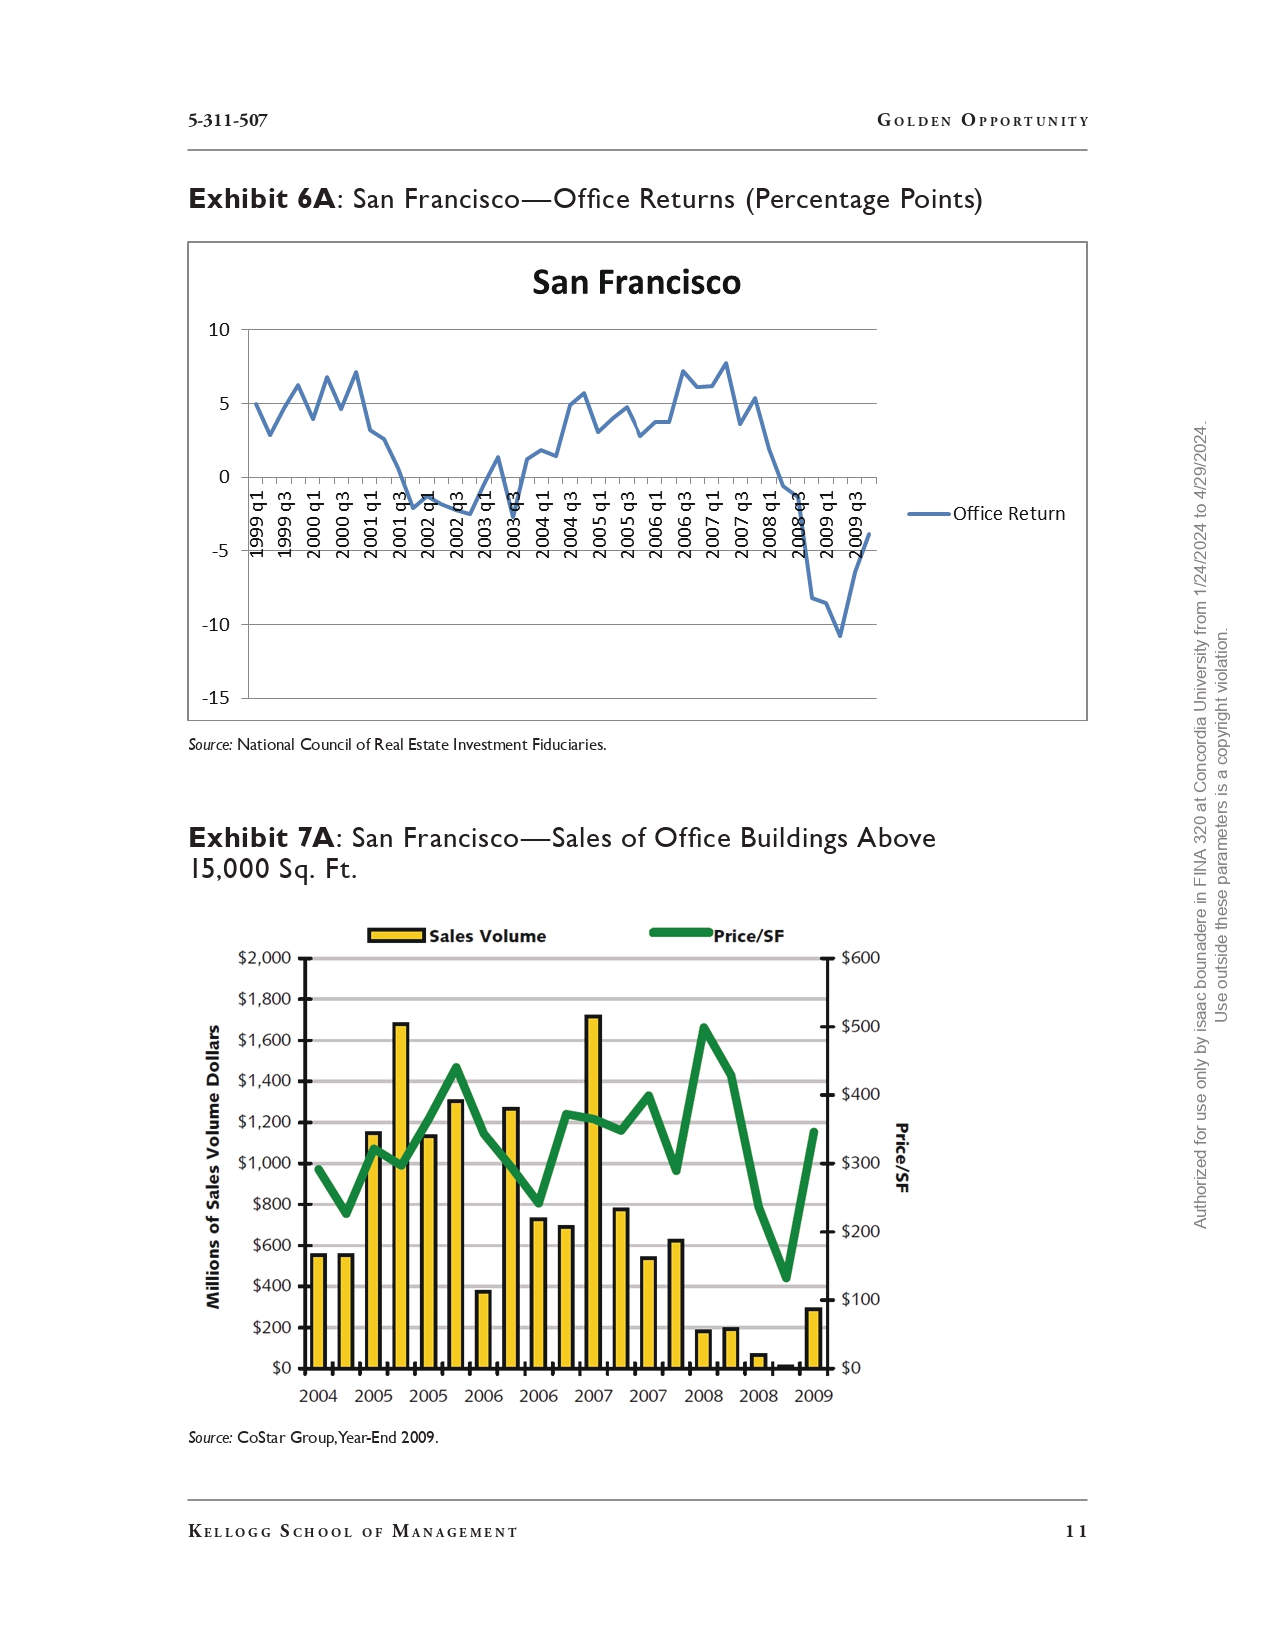
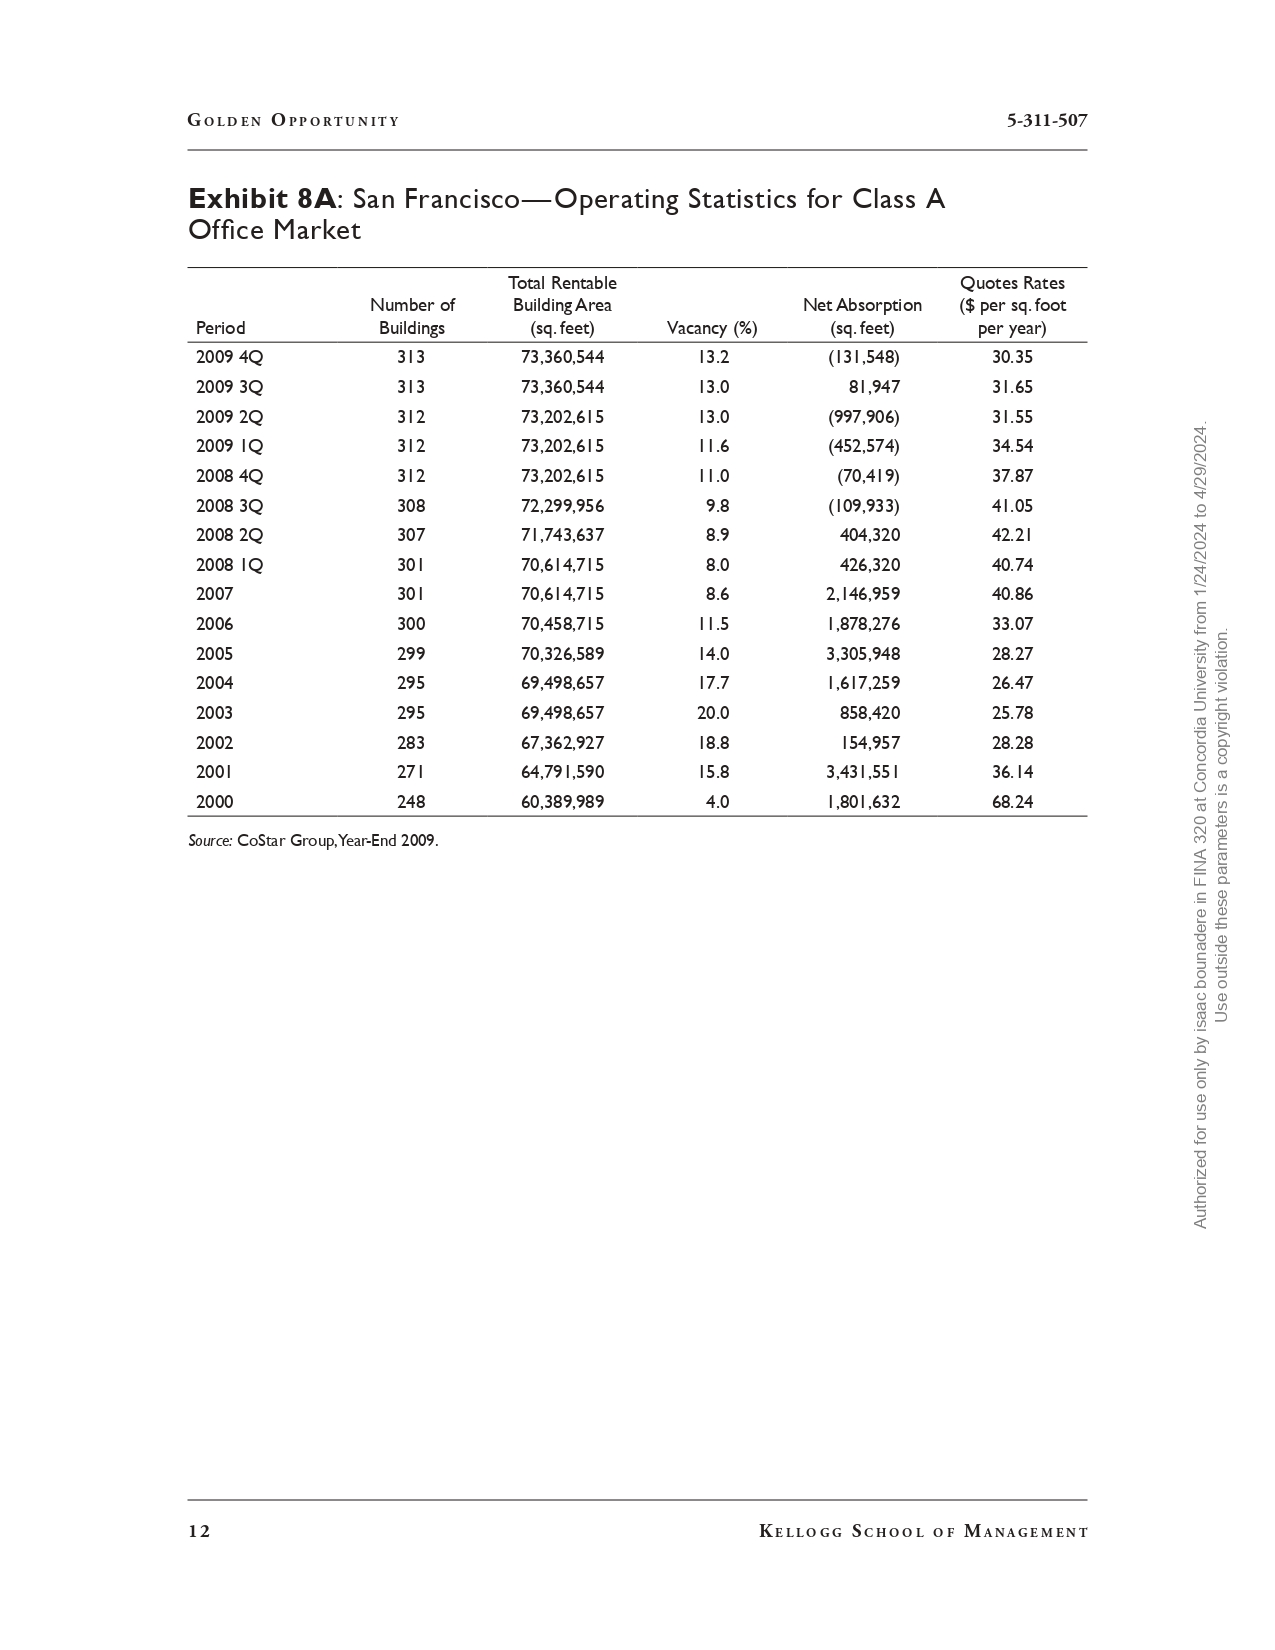
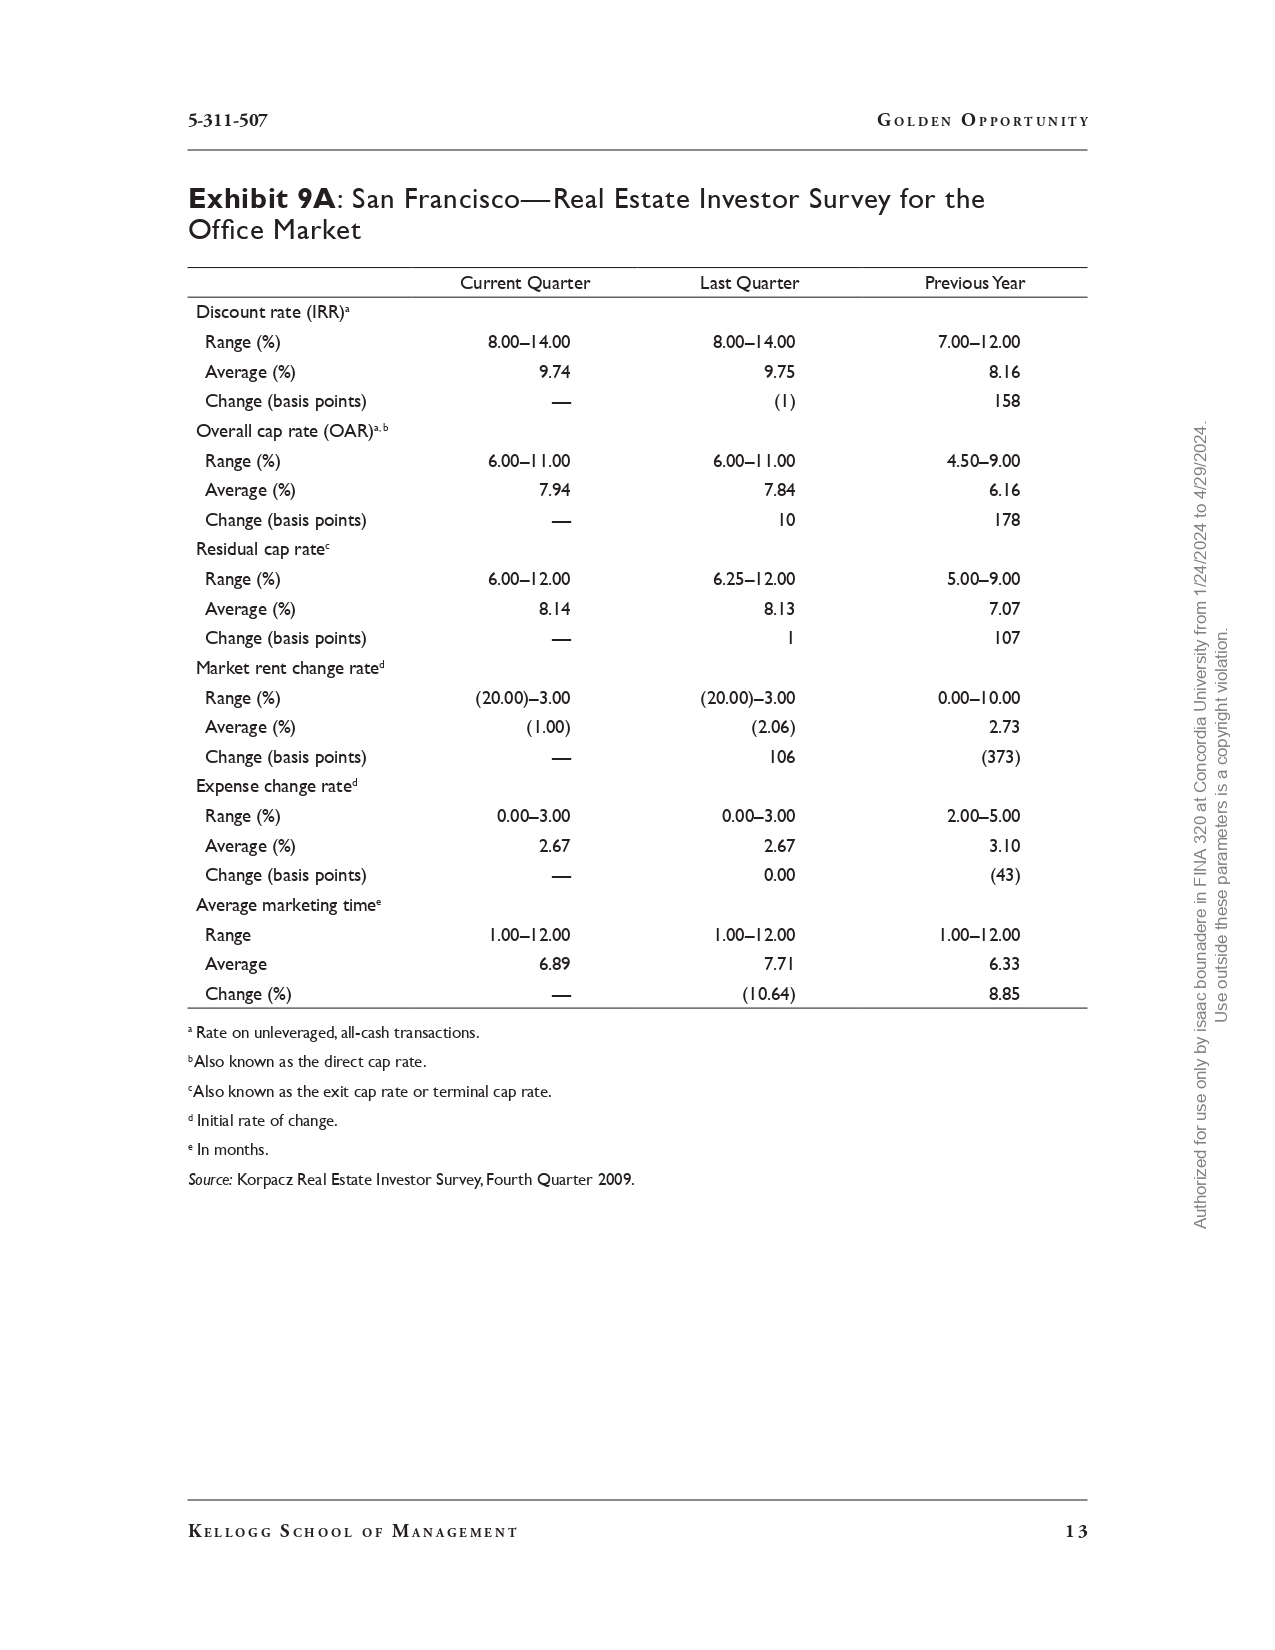
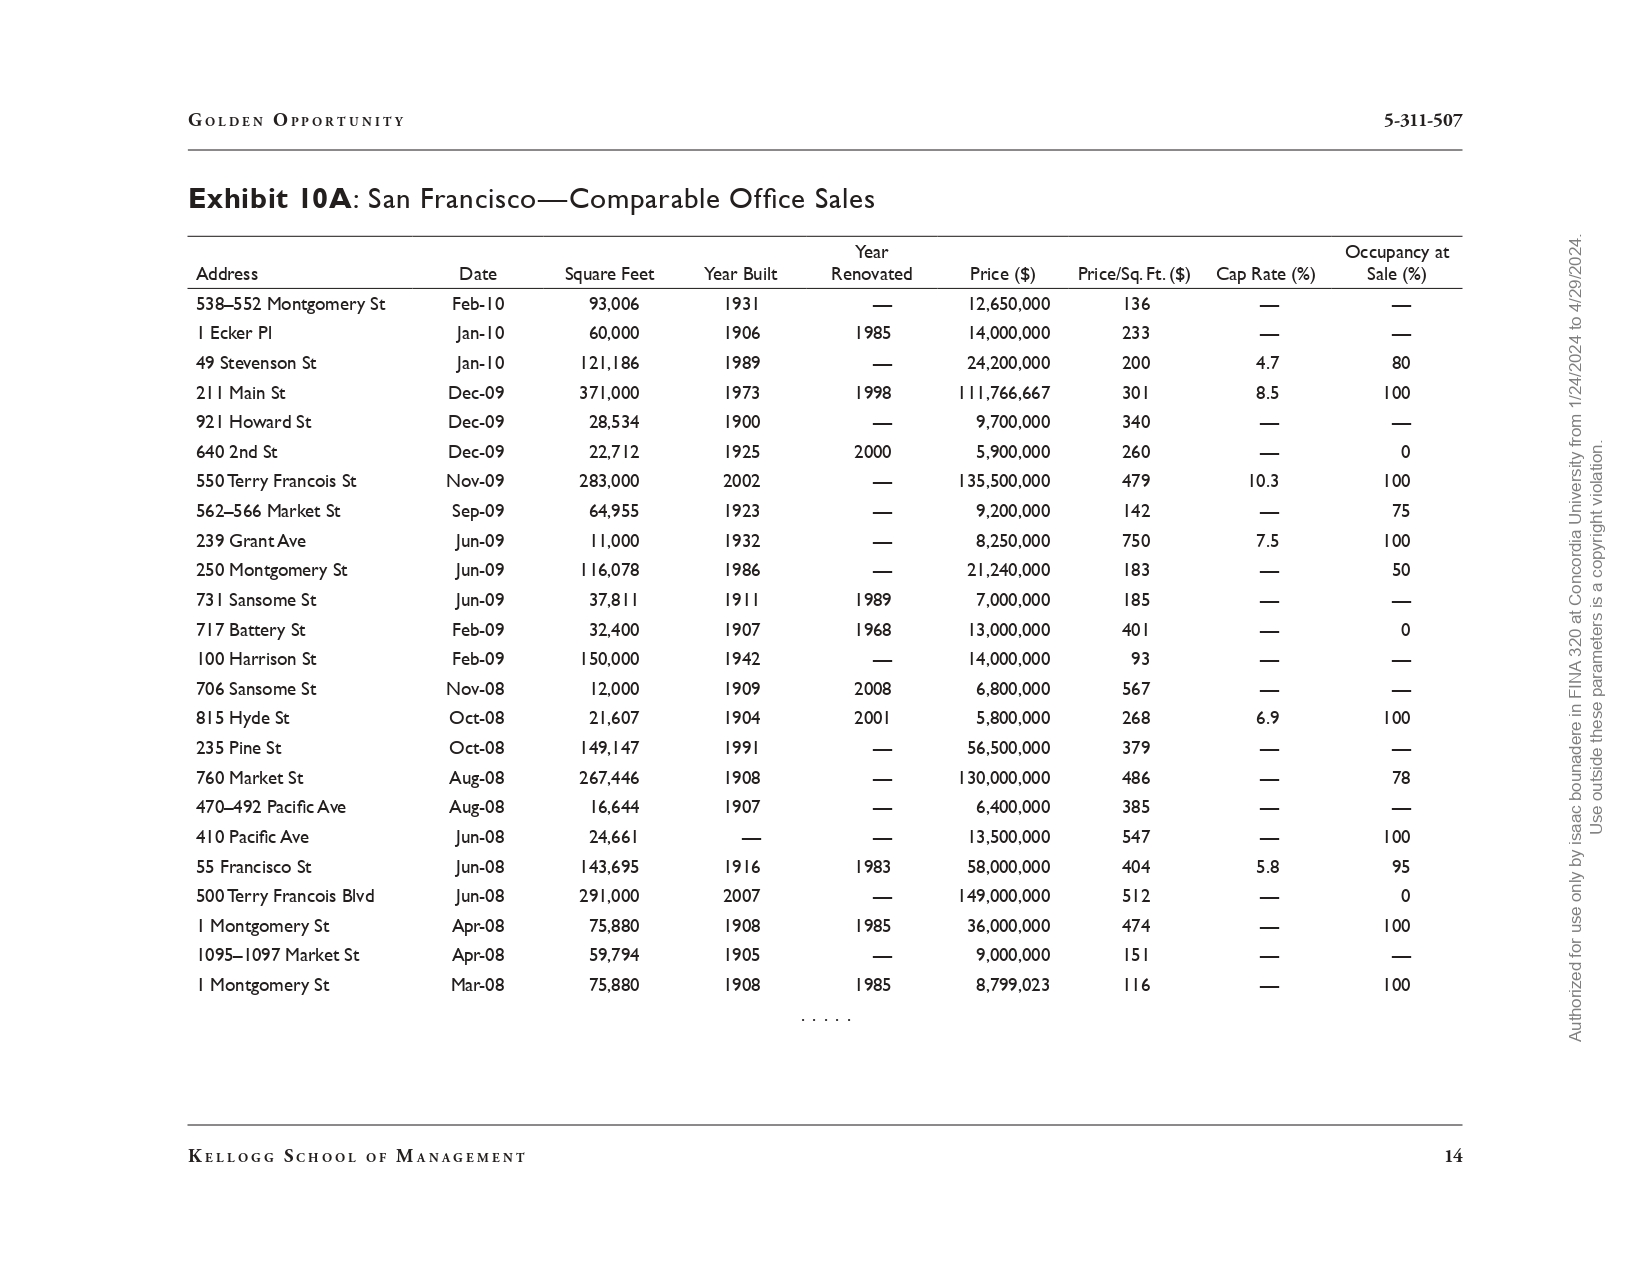
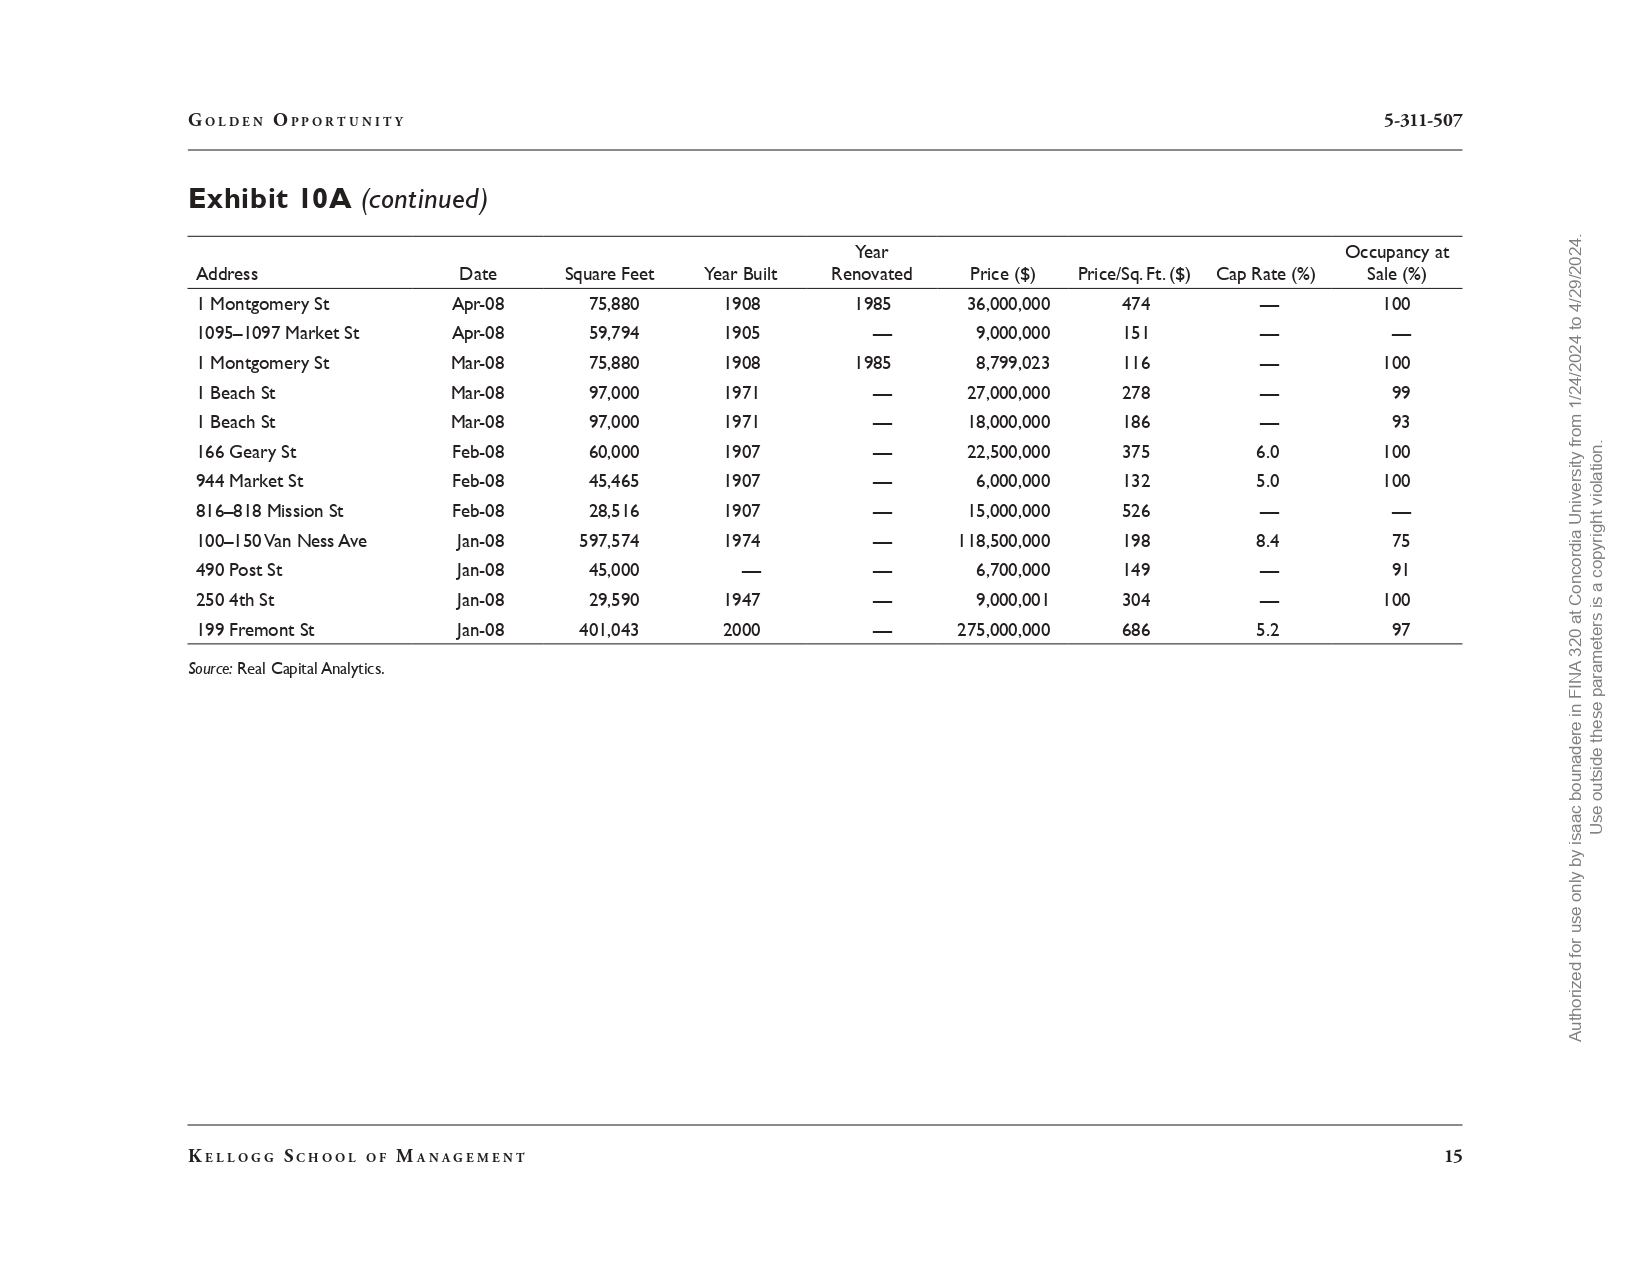
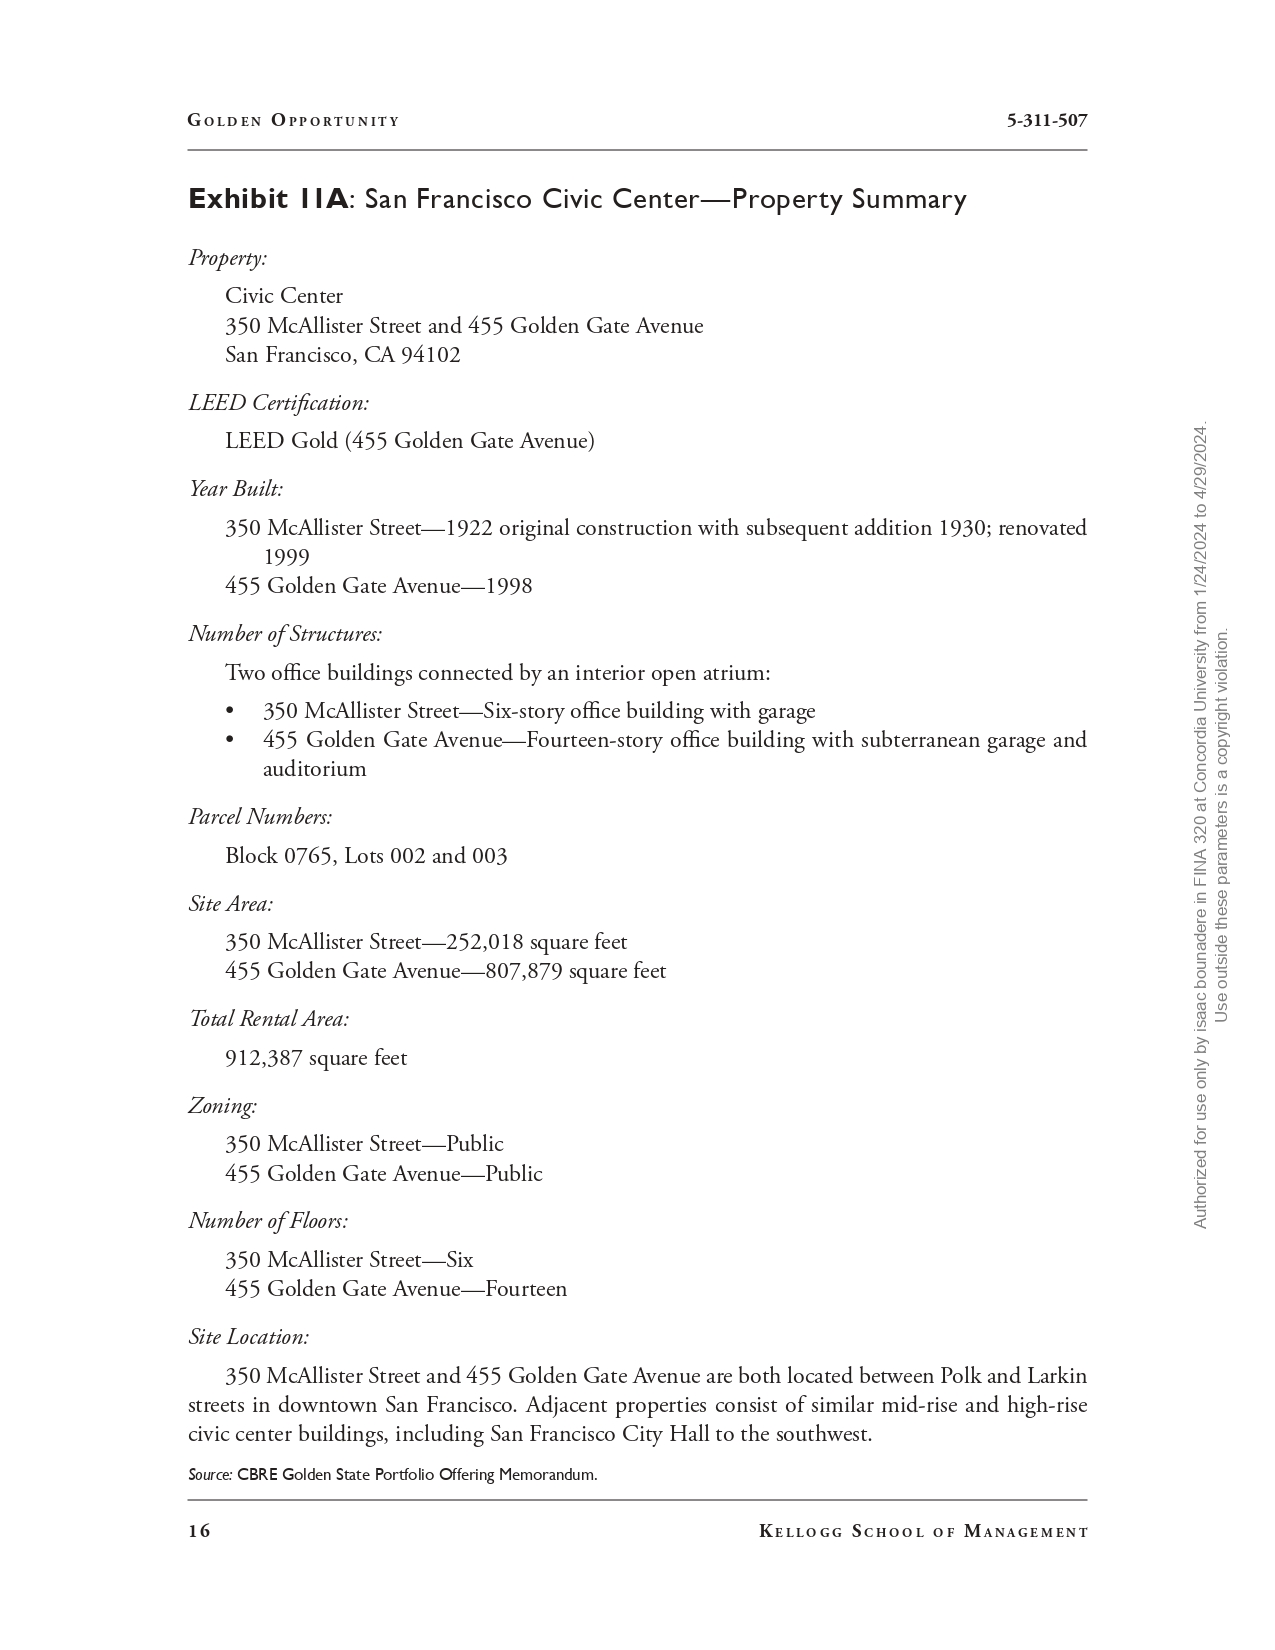
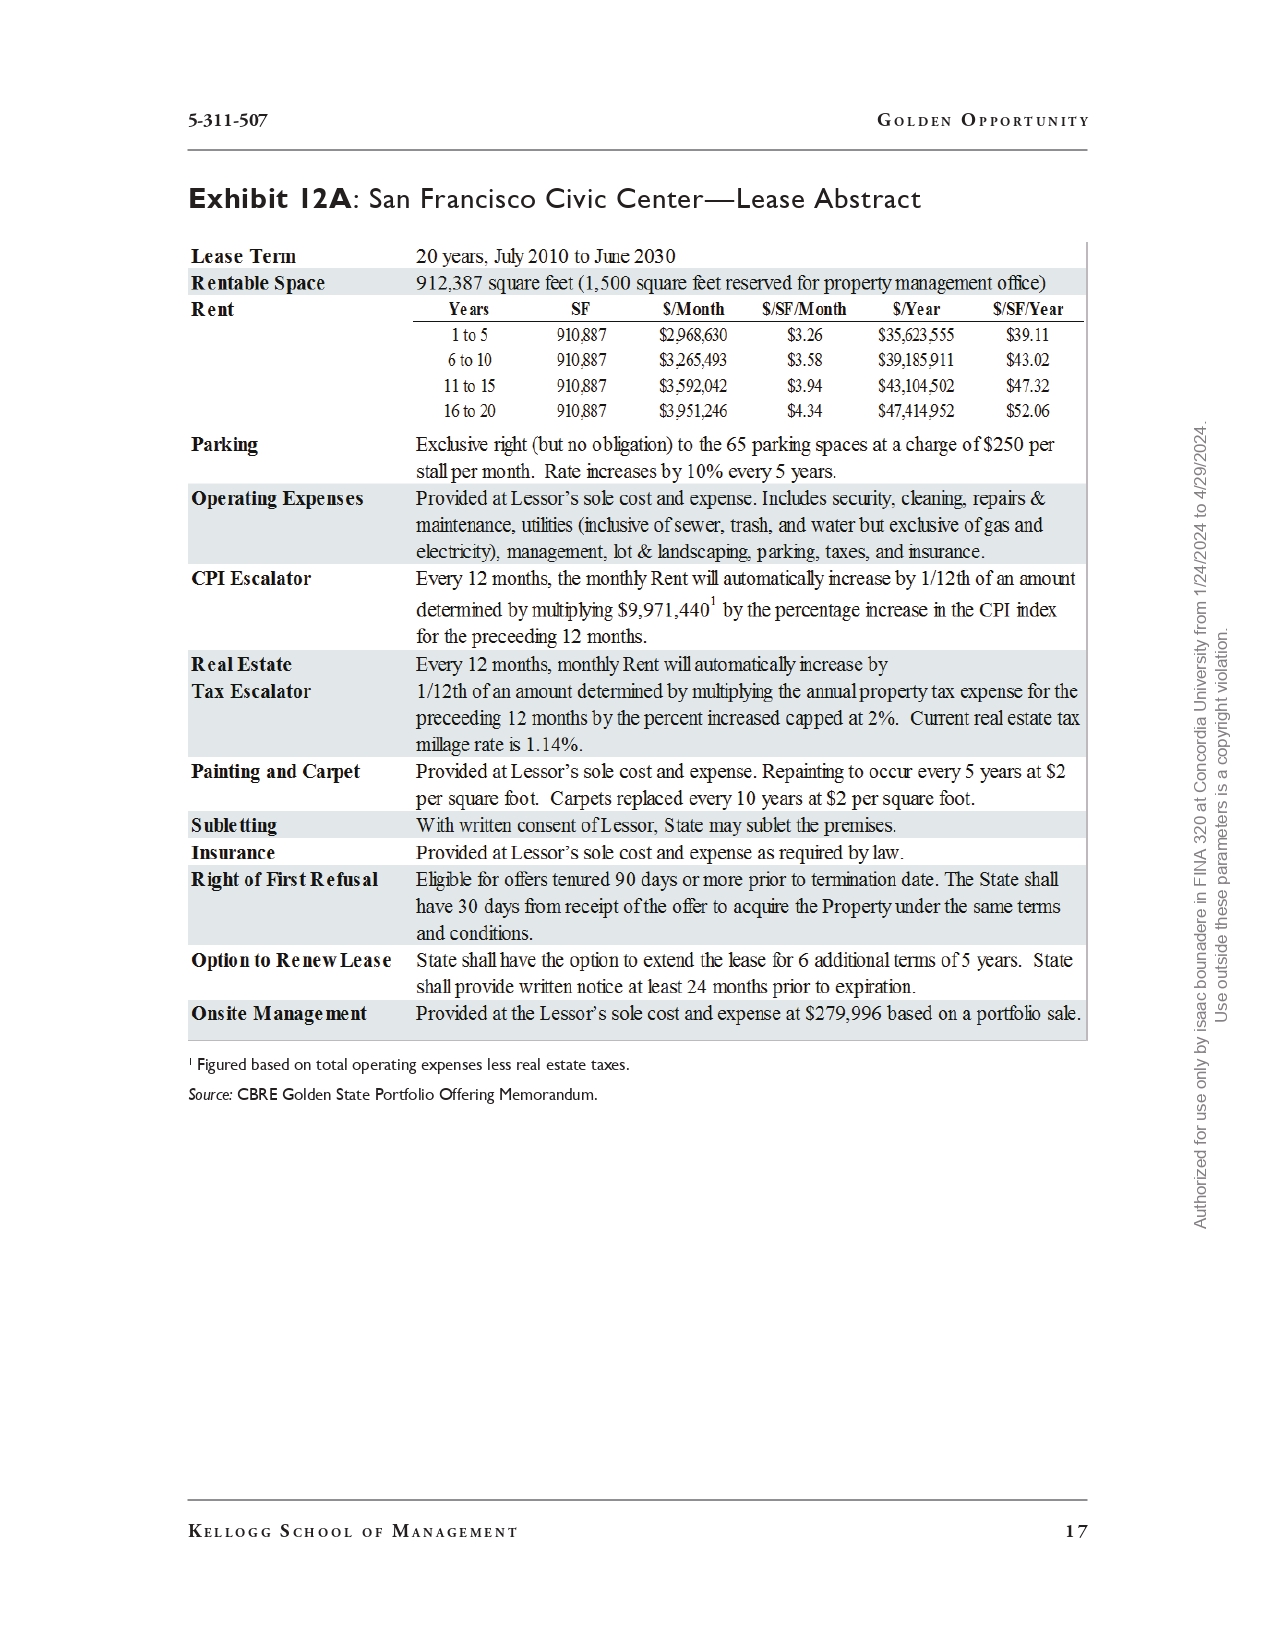
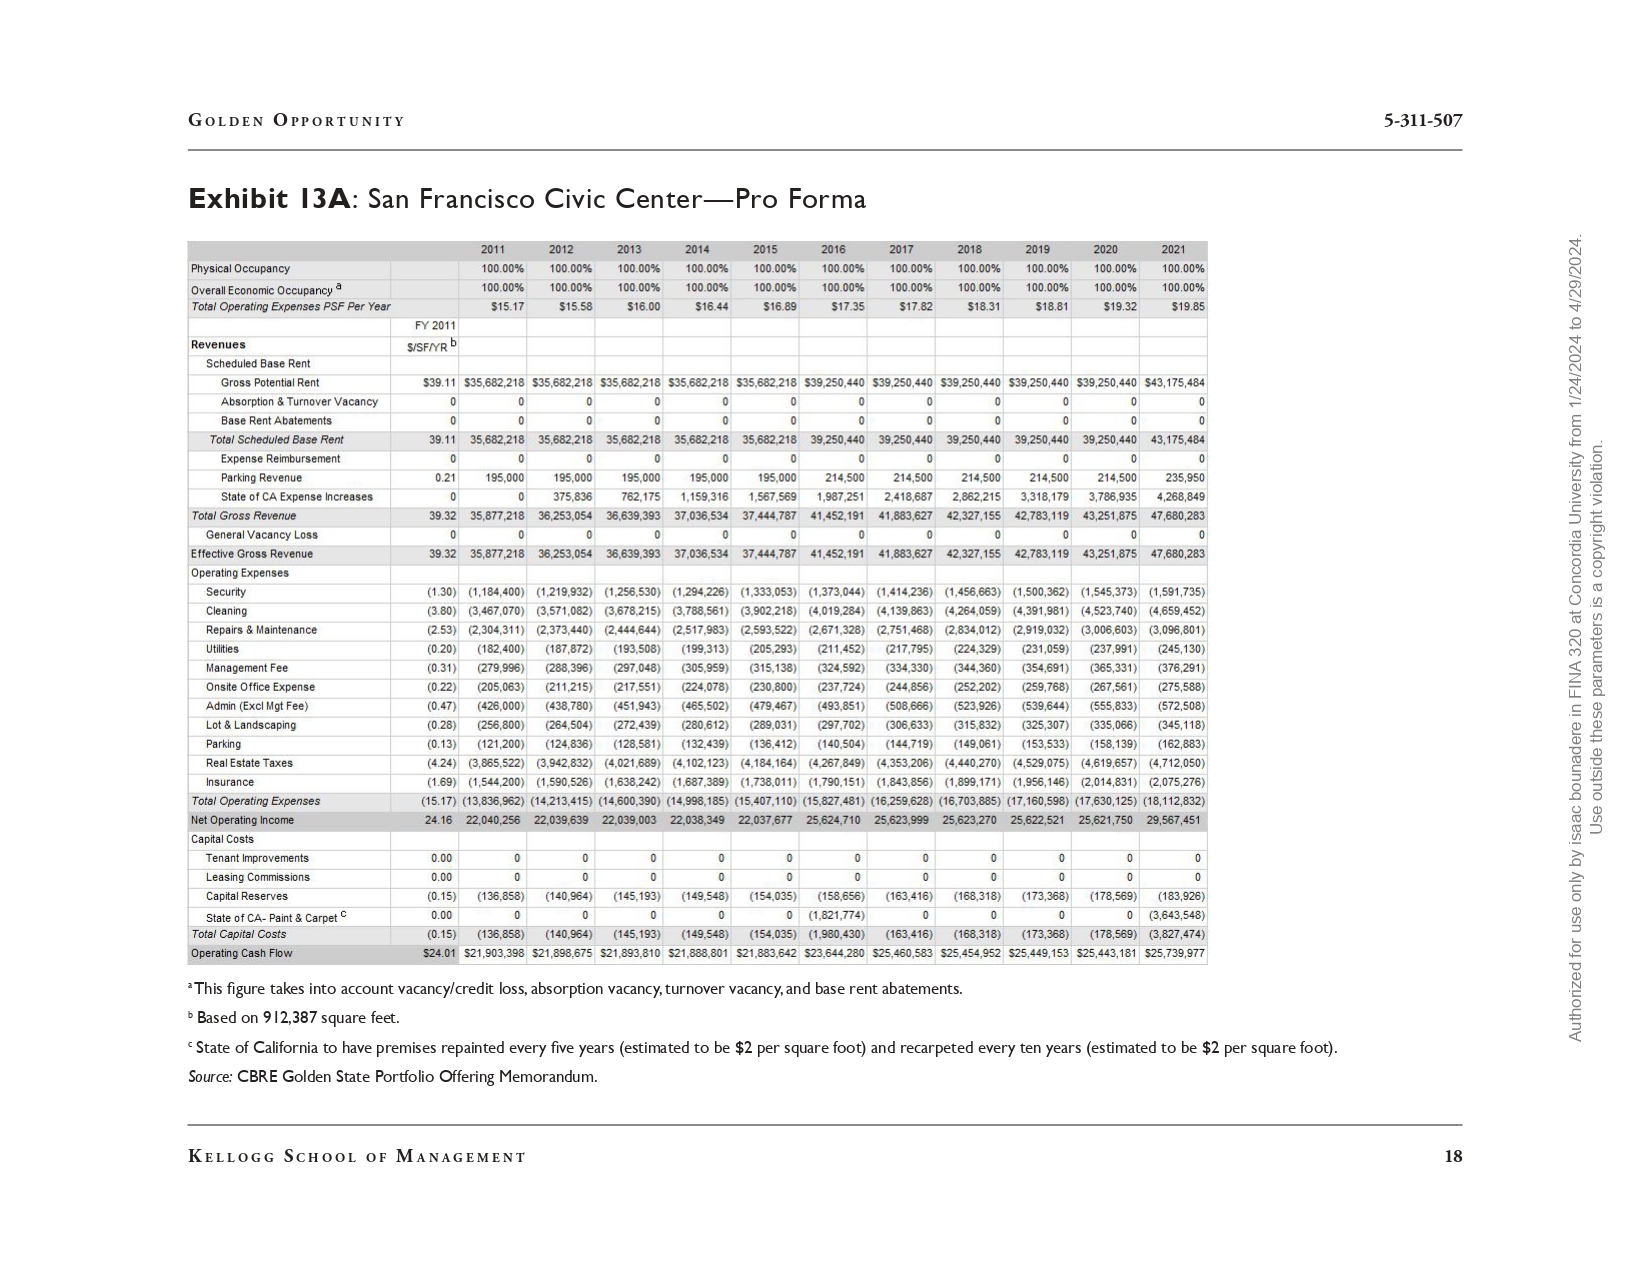
Aurelia Dimas, managing director of fixed income at Orrington Financial Partners, had spent the first week of April 2010 on a whirlwind tour of California. Her itinerary had not included Yosemite or Disneyland, however she had been investigating the eleven properties in the Golden State Portfolio that were being offered as a sale-leaseback by the State of California. Looking for a quiet place to think, Dimas drove to the top of Twin Peaks to enjoy the view of the Golden Gate Bridge to the north and the skyline of San Francisco's business district to the east. After taking a deep breath of fresh air, she took her tablet from her backpack and began to prepare her presentation for the next day's video conference with her CEO, Hank Christofferson. Orrington Financial Partners had recently expanded its fixed-income portfolio to include real estate, and the offerings in the Golden State Portfolio seemed like a perfect fit-they provided diversification and stability over a period of decades. With the bid deadline of April 14 rapidly approaching, Dimas did not have much time to prepare her recommendations. Background Dimas's interest in real estate had come out of an unexpected challenge: while she was in college her family's home had been slated for demolition to make way for a new stadium, and Dimas had spent a significant amount of time researching the property and the future construction in order to accurately value the land. This experience inspired her to earn her MBA and pursue majors in real estate and finance. 2019, 2020 by the Kellogg School of Management at Northwestern University. This case was prepared by Professor Craig Furfine, with research assistance provided by Sara Lo 12 and Daniel Kamerling '11. Cases are developed solely as the basis for class discussion. Cases are not intended to serve as endorsements, sources of primary data, or illustrations of effective or ineffective management. Some details may have been fictionalized for pedagogical purposes. To order copies or request permission to reproduce materials, call 847.491.5400 or e-mail cases@kellogg.northwestern.edu. No part of this publication may be reproduced, stored in a retrieval system, used in a spreadsheet, or transmitted in any form or by any means electronic, mechanical, photocopying, recording, or otherwise without the permission of Kellogg Case Publishing. 2 GOLDEN OPPORTUNITY 5-311-507 She spent the next decade working for a property management company in Miami, where she successfully turned around poorly managed buildings throughout the southeast United States. Her understanding of operations and finance led Christofferson to recruit Dimas in 2005 to head a new real estate group at Chicago-based Orrington Financial, an investment management firm with approximately fifty employees. When Dimas first approached Christofferson with the opportunity to bid on the Golden State Portfolio, his eyes lit up. As described by the California Department of General Services (Exhibit 1), the offering's size and scope were unprecedented. Christofferson tasked Dimas with visiting the properties and developing the company's bid. As Dimas examined the details of the portfolio's properties, she enjoyed thinking of herself as a modern-day prospector sifting for valuable nuggets of real estate (Exhibit 2). State of California While visiting the state capitol in Sacramento, Dimas met with Luke Orville, the longtime staff director of the legislative budget office, to learn more about the state's operations and the conditions that led to the sale-leaseback offering. Orville estimated that the State of California faced a budget deficit of nearly $20 billion for the 2009-2010 budget cycle. Governor Schwarzenegger had called for cuts in practically every aspect of government spending, which led to the proposed sale-leaseback of state-owned properties in the Golden State Portfolio. The transaction would raise funds, narrow the budget deficit, and reduce the risks of property ownership by reducing the state's significant holdings. Despite its budget difficulties, California had maintained a high bond rating that allowed the issuance of debt at favorable rates (Exhibit 3). The Portfolio At the end of their conversation, Orville referred Dimas to Lea Takanaka, an agent for CB Richard Ellis (CBRE), which acted as the real estate broker for the Golden State Portfolio. CBRE had been selected based on the firm's experience with high-value properties and its fee of less than one-half of a percent.' Takanaka explained to Dimas that CBRE was one of the world's largest global commercial real estate companies, formed when a spinoff from Coldwell Banker acquired the international holdings of London-based Richard Ellis International. As of 2010, the company had more than four hundred offices in sixty countries, with 2.9 billion square feet under management. CBRE maintained a wide range of real estate offerings, including "strategic advice and execution for property sales and leasing; corporate services; property, facilities, and project management; 1 California Department of General Services press release, California Signs Deal with Broker to Sell $2 Billion in Real Estate," December 11, 2009. 2 CB Richard Ellis Group, Inc., Worldwide Business Activity 2010, http://www.cbre.com/EN/AboutUs/ MediaCentre/Documents/ CBRE_Worldwide_2010.pdf. KELLOGG SCHOOL OF MANAGEMENT Authorized for use only by isaac bounadere in FINA 320 at Concordia University from 1/24/2024 to 4/29/2024. Use outside these parameters is a copyright violation. 5-311-507 GOLDEN OPPORTUNITY mortgage banking; appraisal and valuation; development services; investment management; and research and consulting."3 The Golden State Portfolio consisted of eleven properties totaling 7.3 million square feet in the markets of the San Francisco Bay Area, Los Angeles, and Sacramento. (See Exhibit 4 for a map and Exhibit 5 for an overview of each of the cities involved.) The buildings ranged in size from the 92,000-square-foot Rattigan Building in Santa Rosa to the 1.8-million-square-foot Franchise Tax Board Complex building in Sacramento. The majority of the buildings were LEED certified, which Takanaka argued would result in below-average energy costs. In addition, the cost of construction had been paid by the State of California, so there were no current mortgages associated with the buildings. In addition to sharing her personal experiences in the local market, Takanaka provided data on returns (Exhibit 6A5, sales (Exhibit 7A), and operations (Exhibit 8A) over the past decade. Although Takanaka painted a sunny picture for future prospects, Dimas hesitated to rely on just one source of data; she also had a survey of local real estate investors from her favorite trade magazine (Exhibit 9A). In addition, Dimas asked an associate at Orrington Financial to compile a thorough list of recent office sales (Exhibit 10A). Preparing the Presentation Dimas began to compile her analysis for presentation to Christofferson. She knew it would be important to start by explaining exactly what was involved in a sale-leaseback. There were many reasons organizations might want to enter into a sale-leaseback agreement: to convert equity into cash, to have an alternative to conventional financing, to gain favorable financing terms, to improve the balance sheet with a current rather than fixed asset, and to avoid debt restrictions.6 Strategically, organizations sometimes wanted to divest their real estate holdings in order to focus on activities that were more central to their missions. Of course, a sale-leaseback arrangement was viable only if it provided a stable, long-term investment to the buyer, typically in the form of high rental rates and a lengthy contract as compensation for assuming the risk of a default on the lease. A seller, on the other hand, assumed the risk of a buyer default and change of ownership that could result in new lease terms or even eviction, in addition to the loss of flexibility in subleasing and building modification. With so many properties in the Golden State Portfolio to value, Dimas needed a summary (Exhibit 11A) of each one to keep track of all the details. She also had a lease abstract (Exhibit 12A) 3 CB Richard Ellis Worldwide, "Investor Relations," http://ir.cbre.com/phoenix.zhtml?c=176560&p=irol-irhome (accessed September 8, 2011). 4 CBRE Golden State Portfolio Offering Memorandum. 5 This exhibit and the following exhibits contain data only for the San Francisco City Center property. Corresponding exhibits for other properties are available to instructors. 6 Donald J. Valachi, CCIM Institute, "Sale-Leaseback Solutions: Examine the Business and Tax Considerations of These Transactions," http://www.ccim.com/cire-magazine/articles/sale-leaseback-solutions (accessed September 8, 2011). KELLOGG SCHOOL OF MANAGEMENT 3 Authorized for use only by isaac bounadere in FINA 320 at Concordia University from 1/24/2024 to 4/29/2024. Use outside these parameters is a copyright violation. GOLDEN OPPORTUNITY 5-311-507 for each building, which included details she needed to estimate cash flows to be paid and received by the new owner. Takanaka had also provided a pro forma developed by CBRE for each property (Exhibit 13A). Based on her valuation, Dimas needed to recommend how to bid on the portfolio. One option was to bid separately for each property she considered a good investment. The other possibility was to team up with another firm to bid on the entire portfolio. Dimas needed to get this rightan investment in the Golden State Portfolio would represent a significant increase in the holdings of Orrington Financial. As she opened her spreadsheet program to begin her valuation analysis, she remembered a caution her real estate finance professor had often repeated: "Skilled financial analysts can make a spreadsheet justify anythingso think carefully about your assumptions." She had already started thinking about her own assumptions for the property financials and needed to finalize them. However, even with all of her experience, she had never dealt with a government seller and the nonmarket factors associated with its motivation to enter into a sale-leaseback. As the sun was setting, Dimas put her tablet into her backpack and prepared to drive to her hotel. She had a video conference the next day with her CEO and a presentation to finish. KELLOGG SCHOOL OF MANAGEMENT Authorized for use only by isaac bounadere in FINA 320 at Concordia University from 1/24/2024 to 4/29/2024. Use outside these parameters is a copyright violation. 5-311-507 Exhibit I: Press Release of Portfolio Sale GOLDEN OPPORTUNITY California State Office Portfolio Hits the Market Acquisition of Green Offices Viewed as a "Generational" Opportunity for Investment Capital SACRAMENTO, Calif.-The California Department of General Services announced today that eleven state office properties, totaling nearly 7.3 million rentable square feet, are now on the market and expected to draw significant interest from capital investors worldwide, potentially eliciting offers in excess of $2 billion for the state. DGS's broker, CB Richard Ellis Group, Inc., has listed the properties online. Offers are due by April 14, 2010. In June, Governor Schwarzenegger and the legislature authorized the sale of the properties located in Los Angeles, Oakland, Sacramento, San Francisco, and Santa Rosa. Once sold, the state anticipates retiring more than $1 billion in bond debt, saving California hundreds of millions in interest payments over the next two decades. The sale is also expected to net at least $660 million in proceeds that will be funneled directly into the General Fund, helping to save Californians from increased taxes and deeper cuts in state programs and services. "This sale will allow California to pay off debt, tap equity, and lock in some of the lowest rental rates seen in years," said DGS Acting Director Ron Diedrich. "The short- and long-term financial gains will be real to help shore up state budget in the years to come." the The eleven state office properties are among some of California's most energy efficient and environmentally friendly, making the properties attractive to a market that is seeking sustainable, green designs. The U.S. Green Buildings Council's Leadership in Energy and Environmental Design (LEED) certification has been achieved on nearly all of the buildings. "What the real estate investment community is looking for in today's market are secure, low- risk investment opportunities-occupied buildings with long-term, credit-worthy tenants, as well as increasingly 'green' product, both of which the state's portfolio offers, said Kevin Shannon, Vice Chairman for CB Richard Ellis and the lead broker on the sale-leaseback assignment. "We are confident that the expansive global marketing campaign we're launching today will attract strong national and international interest in this generational acquisition opportunity." "California should not be in the volatile real estate business," said Diedrich. "As we lease these properties for the next twenty years, we can predictably budget our costs, knowing that the state will no longer be liable for unforeseen repair costs that are inherent in owning real estate." Source: California Department of General Services press release, February 26, 2010. KELLOGG SCHOOL OF MANAGEMENT 5 Authorized for use only by isaac bounadere in FINA 320 at Concordia University from 1/24/2024 to 4/29/2024. Use outside these parameters is a copyright violation. GOLDEN OPPORTUNITY Exhibit 2: Portfolio Summary 5-311-507 Region Property Name Address Rentable Area (SF) # of Floors Year Built LEED Certification Projected Year 1 NOI 350 McAllister Avenue 1 San Francisco Civic Center & 455 Golden Gate Avenue, San Francisco 912,387 6 & 14 1922 & 1999 LEED Gold (1 bldg) $ 22,040,256 Public Utilities 2 Commission Bay Area 505 Van Ness Avenue, San Francisco 270,768 5 1984 LEED Silver $ 6,098,050 Building Elihu Harris 1515 Clay Street, 3 700,589 24 1998 LEED Certified $ 12,613,763 Building Oakland Judge Rattigan 4 50 D Street, Santa Rosa 92,368 4 1983 Registered $ 1,040,445 Building Subtotal 1,976,112 Subtotal $ 41,792,514 Junipero Serra 320 West 4th Street, 5 431,856 10 State Building Los Angeles Ronald Reagan 6 State Building Los Angeles 300 South Spring Street, Los Angeles Subtotal 739,158 14 & 16 1914, 1999 (Renovated) 1989 Registered (w/certification $ 6,799,418 goal of "Silver"). Registered (w/certification $ 12,195,530 goal of "Silver") 1,171,014 Subtotal $ 18,994,948 Sacramento 9 Attorney General 7 Building 1300 | Street, Sacramento 376,866 17 1995 Capitol Area East 8 End Complex Department of Justice Building ...................... ............... 1430 N Street; 1500, 1501, 1615, and 1616 Capitol Avenue, Sacramento 4949 Broadway, Sacramento 1,474,705 6 & 7 2002 & 2003 381,718 2 1982 10 Franchise Tax Board Complex 9645 Butterfield Way, 1,814,056 1 to 4 Sacramento 1984, 1993, 2003 & 2005 11 Cal EMA 3650 Schriever Avenue, Rancho Cordova 116,687 1 & 2 2002 Subtotal Total 4,164,032 7,311,158 Source: CBRE Golden State Portfolio Offering Memorandum. LEED Gold $ 8,708,584 LEED Platinum (1 bldg), LEED Gold (4 bldgs) Registered LEED Gold (4 bldgs), LEED Silver (2 bldgs) $ 35,543,577 $ 4,936,426 $ 34,310,182 Registered $ 2,921,246 Subtotal $ 86,420,015 Total $ 147,207,477 6 KELLOGG SCHOOL OF MANAGEMENT Authorized for use only by isaac bounadere in FINA 320 at Concordia University from 1/24/2024 to 4/29/2024. Use outside these parameters is a copyright violation. 5-311-507 Exhibit 3: Market Data Yield Treasury Bills 3-month 0.13 6-month 0.19 I-year 0.32 2-year 0.80 5-year 2.28 10-year 3.61 30-year 4.56 Corporate Bonds Aaa 5.22 Baa 6.26 Municipal Bonds State and local bonds 4.34 Source: U.S. Department of the Treasury, Federal Reserve, March 1, 2010. California Municipal Bonds Rating History Year Standard & Poor's Fitch Moody's 2000 AA AA Aa2 2001 A+ AA Aa3/Al 2002 A AA 2003 BBB BBB A2/A3/Baal 2004 A A- A3 2005 A A A2 2006 A+ A+ 2009 A A/A-/BBB A2/Baal 2010 A- A- Source: California Department of Finance. GOLDEN OPPORTUNITY 7 KELLOGG SCHOOL OF MANAGEMENT Authorized for use only by isaac bounadere in FINA 320 at Concordia University from 1/24/2024 to 4/29/2024. Use outside these parameters is a copyright violation. GOLDEN OPPORTUNITY Exhibit 4: Portfolio Map SACRAMENTO 5 Properties 4,164,032 sq. ft. 1011 Mount Shasta 199 17 Mendocino 101 SAN FRANCISCO BAY AREA 4 Properties 1,976,112 sq. ft. Napa Valley Carmel/Monterey Bay Santa Barbara Hollywood, Malibu, Beverly Hills LOS ANGELES 2 Properties Disneyland 1,171,014 sq. ft. San Diego Source: CBRE Golden State Portfolio Offering Memorandum. Lake Tahoe, Heavenly Ski Resort 395 Mammoth Mountain Ski Area, Yosemite National Park Palm Springs 5-311-507 8 KELLOGG SCHOOL OF MANAGEMENT Authorized for use only by isaac bounadere in FINA 320 at Concordia University from 1/24/2024 to 4/29/2024. Use outside these parameters is a copyright violation. 5-311-507 Exhibit 5: California Sub-Market Overview GOLDEN OPPORTUNITY San Francisco San Francisco has the unique distinction of being the most innovative city in America. The city is filled with a concentration of research organizations, an educated workforce, and a deep venture capital pool. San Francisco is also home to twenty-nine Fortune 500 companies and thirty-two of Inc. magazine's fastest-growing private companies. There are also six leading research universities in close proximity to the city, including Stanford University and the University of California at Berkeley, and five national laboratories. San Francisco is an excellent city to call home. The city was ranked number one in the Gallup- Healthways Well-Being Index, which measures aspects such as life evaluation, emotional and physical health, healthy behavior, work environment, and basic access. San Francisco is divided into a diverse set of districts, each with a unique character, including Fisherman's Wharf, Ghirardelli Square, Pier 39, and the famously crooked Lombard Street. Oakland Oakland is located in the East Bay region, which contains one of the most significant bioscience clusters in the nation. Influential firms such as Novartis, Bayer, Bio-Rad, Applied Biosystems, and Cell Genesys are based in this region. Oakland is also in close proximity to outstanding research institutions, including the Lawrence Livermore National Laboratory and Sandia National Laboratories. Both the commercial and government sectors are fueled by graduates of the University of California at Berkeley, located just north of the city. Additionally, Oakland is the only city in California to boast all three major sports franchisesthe Oakland Raiders, Oakland A's, and Golden State Warriors. It is also the city where such culinary favorites as Rocky Road ice cream and the Mai Tai cocktail were created. Santa Rosa Santa Rosa is located in the North Bay region, home to the world-renowned California wine country. Santa Rosa, the largest city in the region, has become the central business hub as a result of the booming wine and tourism industry. Other sectors with a significant presence include retail, technology, and medical, with major employers such as Kaiser Permanente, Agilent Technologies, and Medtronic. Growth in the area is expected to accelerate with the planned completion in 2014 of the seventy-mile Sonoma-Marin Area Rail Transit (SMART). A full range of educational institutions serves the city's needs, including Sonoma State University, Santa Rosa Junior College, and a top- rated public school system. Santa Rosa also offers diverse cultural attractions. The Wells Fargo Center for the Arts hosts performances ranging from music to comedy, many of which are broadcast as HBO specials. The Sonoma County Museum is the cornerstone of the Santa Rosa Arts District, which hosts a variety of events throughout the year. KELLOGG SCHOOL OF MANAGEMENT 9 Authorized for use only by isaac bounadere in FINA 320 at Concordia University from 1/24/2024 to 4/29/2024. Use outside these parameters is a copyright violation. GOLDEN OPPORTUNITY 5-311-507 Sacramento Sacramento is the state of California's capital, located in the beautiful Central Valley. It is regularly mentioned in lists of the country's most desirable places to live (number eight by Kiplinger in 2008) and lies within a 90-minute drive of favorite destinations such as San Francisco, Napa Valley, and Lake Tahoe. Sacramento has a stable, recession- resistant economy due to government employment. Los Angeles 1111 Los Angeles, or the "City of Angels," is home to seventy-two miles of coastline, Hollywood's movie studios, and, of course, the rich and famous. L.A. is also the second most populous city in the United States, with 17.8 million people. Attractions along the coast include Malibu, Santa Monica, and Venice's Muscle Beach. For a greener setting, there is the massive Griffith Park, which features the L.A. Observatory and the L.A. Zoo. No visit to Los Angeles would be complete without a stop in Hollywood. While strolling through Hollywood, visitors can find the Walk of Fame, well- known theaters, and the site of the annual Oscar Awards. However, L.A. offers more than just glamour, as the city is headquarters to sixteen Fortune 500 companies, which anchor a diverse economy that includes aerospace, textiles, trade, biotech, and entertainment. Source: CBRE Golden State Portfolio Offering Memorandum, City of San Francisco, City of Oakland, City of Santa Rosa, City of Sacramento, and City of Los Angeles. 10 KELLOGG SCHOOL OF MANAGEMENT Authorized for use only by isaac bounadere in FINA 320 at Concordia University from 1/24/2024 to 4/29/2024. Use outside these parameters is a copyright violation. -10 -5 5-311-507 GOLDEN OPPORTUNITY Exhibit 6A: San Francisco-Office Returns (Percentage Points) 10 5 San Francisco 0 1999 q1 . 1999 q3 2000 q1. 2000 q3 2001 q1 2001 q3 2002 q1 2002 q3 2003 q1 2003 q3 2004 q1 2004 q3 2005 q1 -15 Source: National Council of Real Estate Investment Fiduciaries. 2005 q3 2006 q1 2006 q3 2007 q1 2007 q3 2008 q1 2008 q3 2009 q1 2009 q3 Exhibit 7A: San Francisco-Sales of Office Buildings Above 15,000 Sq. Ft. $2,000 $1,800 $1,600 $1,400 $1,200 Millions of Sales Volume Dollars $1,000 $800 $600 Sales Volume Price/SF $600 $500 $400 $300 $200 $400 $100 $200 $0 $0 2004 2005 2005 2006 2006 2007 2007 2008 2008 2009 Source: CoStar Group, Year-End 2009. KELLOGG SCHOOL OF MANAGEMENT Price/SF 11 Office Return Authorized for use only by isaac bounadere in FINA 320 at Concordia University from 1/24/2024 to 4/29/2024. Use outside these parameters is a copyright violation. GOLDEN OPPORTUNITY Exhibit 8A: San Francisco-Operating Statistics for Class A Office Market 5-311-507 Total Rentable Quotes Rates Number of Building Area Period Buildings (sq. feet) Vacancy (%) Net Absorption (sq. feet) ($ per sq. foot per year) 2009 4Q 313 73,360,544 13.2 (131,548) 30.35 2009 3Q 313 73,360,544 13.0 81,947 31.65 2009 2Q 312 73,202,615 13.0 (997,906) 31.55 2009 IQ 312 73,202,615 11.6 (452,574) 34.54 2008 4Q 312 73,202,615 11.0 (70,419) 37.87 2008 3Q 308 72,299,956 9.8 (109,933) 41.05 2008 2Q 307 71,743,637 8.9 404,320 42.21 2008 IQ 301 70,614,715 8.0 426,320 40.74 2007 301 70,614,715 8.6 2,146,959 40.86 2006 300 70,458,715 11.5 1,878,276 33.07 2005 299 70,326,589 14.0 3,305,948 28.27 2004 295 69,498,657 17.7 1,617,259 26.47 2003 295 69,498,657 20.0 858,420 25.78 2002 283 67,362,927 18.8 154,957 28.28 2001 271 64,791,590 15.8 3,431,551 36.14 2000 248 60,389,989 4.0 1,801,632 68.24 Source: CoStar Group, Year-End 2009. 12 KELLOGG SCHOOL OF MANAGEMENT Authorized for use only by isaac bounadere in FINA 320 at Concordia University from 1/24/2024 to 4/29/2024. Use outside these parameters is a copyright violation. 5-311-507 GOLDEN OPPORTUNITY Exhibit 9A: San Francisco-Real Estate Investor Survey for the Office Market Current Quarter Last Quarter Previous Year Discount rate (IRR) Range (%) Average (%) 8.00-14.00 9.74 Change (basis points) 8.00-14.00 9.75 (I) 7.00-12.00 816 158 Overall cap rate (OAR)a.b Range (%) 6.00-11.00 6.00-11.00 4.50-9.00 Average (%) 7.94 7.84 6.16 Change (basis points) 10 178 Residual cap rate Range (%) Average (%) Change (basis points) 6.00-12.00 6.25-12.00 8.14 8.13 | 5.00-9.00 7.07 107 Market rent change rated Range (%) Average (%) Change (basis points) (20.00)-3.00 (1.00) (20.00)-3.00 (2.06) 106 0.00-10.00 2.73 (373) Expense change rated Range (%) 0.00-3.00 0.00-3.00 2.00-5.00 Average (%) 2.67 2.67 3.10 Change (basis points) 0.00 (43) Average marketing time Range 1.00-12.00 1.00-12.00 1.00-12.00 Average 6.89 7.71 Change (%) (10.64) 6.33 8.85 * Rate on unleveraged, all-cash transactions. bAlso known as the direct cap rate. "Also known as the exit cap rate or terminal cap rate. d Initial rate of change. e In months. Source: Korpacz Real Estate Investor Survey, Fourth Quarter 2009. KELLOGG SCHOOL OF MANAGEMENT 13 Authorized for use only by isaac bounadere in FINA 320 at Concordia University from 1/24/2024 to 4/29/2024. Use outside these parameters is a copyright violation. GOLDEN OPPORTUNITY Exhibit 10A: San Francisco-Comparable Office Sales 5-311-507 Address Date Square Feet Year Built Year Renovated Occupancy at Price ($) Price/Sq. Ft. ($) Cap Rate (%) Sale (%) 538-552 Montgomery St Feb-10 93,006 1931 12,650,000 136 I Ecker Pl Jan-10 60,000 1906 1985 14,000,000 233 49 Stevenson St Jan-10 121,186 1989 24,200,000 200 4.7 211 Main St Dec-09 371,000 1973 1998 111,766,667 301 8.5 100 921 Howard St Dec-09 28,534 1900 9,700,000 340 640 2nd St Dec-09 22,712 1925 2000 5,900,000 260 550 Terry Francois St Nov-09 283,000 2002 135,500,000 479 10.3 100 562-566 Market St Sep-09 64,955 1923 9,200,000 142 239 Grant Ave Jun-09 11,000 1932 8,250,000 750 7.5 100 250 Montgomery St Jun-09 1 16,078 1986 21,240,000 183 731 Sansome St Jun-09 37,811 1989 7,000,000 185 717 Battery St Feb-09 32,400 1907 1968 13,000,000 401 100 Harrison St Feb-09 150,000 1942 14,000,000 93 706 Sansome St Nov-08 12,000 1909 2008 6,800,000 567 815 Hyde St Oct-08 21,607 1904 2001 5,800,000 268 6.9 100 235 Pine St Oct-08 149,147 1991 56,500,000 379 760 Market St Aug-08 267,446 1908 130,000,000 486 470-492 Pacific Ave Aug-08 16,644 1907 6,400,000 385 410 Pacific Ave Jun-08 24,661 13,500,000 547 100 55 Francisco St Jun-08 143,695 1916 1983 58,000,000 404 5.8 500 Terry Francois Blvd. Jun-08 291,000 2007 149,000,000 512 I Montgomery St Apr-08 75,880 1908 1985 36,000,000 474 1095-1097 Market St Apr-08 59,794 1905 9,000,000 151 I Montgomery St Mar-08 75,880 1908 1985 8,799,023 116 || 8 8 82 88 8 82 88 80 0 75 50 0 78 95 KELLOGG SCHOOL OF MANAGEMENT 14 Authorized for use only by isaac bounadere in FINA 320 at Concordia University from 1/24/2024 to 4/29/2024. Use outside these parameters is a copyright violation. GOLDEN OPPORTUNITY Exhibit 10A (continued) 5-311-507 Address Date Square Feet Year Built I Montgomery St Apr-08 75,880 1908 Year Renovated 1985 Occupancy at Price ($) Price/Sq. Ft. ($) Cap Rate (%) Sale (%) 36,000,000 474 100 1095-1097 Market St Apr-08 59,794 1905 9,000,000 151 I Montgomery St Mar-08 75,880 1908 1985 8,799,023 116 100 | Beach St Mar-08 97,000 1971 27,000,000 278 | Beach St Mar-08 97,000 1971 18,000,000 186 166 Geary St Feb-08 60,000 1907 22,500,000 375 6.0 100 944 Market St Feb-08 45,465 1907 6,000,000 132 5.0 100 816-818 Mission St Feb-08 28,516 1907 15,000,000 526 100-150 Van Ness Ave Jan-08 597,574 1974 | 18,500,000 198 490 Post St Jan-08 45,000 6,700,000 149 250 4th St Jan-08 29,590 1947 9,000,001 304 199 Fremont St Jan-08 401,043 2000 275,000,000 686 $ | 8 100 5.2 97 882288282 99 93 75 Source: Real Capital Analytics. KELLOGG SCHOOL OF MANAGEMENT 15 Authorized for use only by isaac bounadere in FINA 320 at Concordia University from 1/24/2024 to 4/29/2024. Use outside these parameters is a copyright violation. GOLDEN OPPORTUNITY 5-311-507 Exhibit IIA: San Francisco Civic Center-Property Summary Property: Civic Center 350 McAllister Street and 455 Golden Gate Avenue San Francisco, CA 94102 LEED Certification: LEED Gold (455 Golden Gate Avenue) Year Built: 350 McAllister Street-1922 original construction with subsequent addition 1930; renovated 1999 455 Golden Gate Avenue-1998 Number of Structures: Two office buildings connected by an interior open atrium: 350 McAllister Street-Six-story office building with garage 455 Golden Gate Avenue-Fourteen-story office building with subterranean garage and auditorium Parcel Numbers: Block 0765, Lots 002 and 003 Site Area: 350 McAllister Street-252,018 square feet 455 Golden Gate Avenue-807,879 square feet Total Rental Area: 912,387 square feet Zoning: 350 McAllister Street-Public 455 Golden Gate Avenue-Public Number of Floors: 350 McAllister Street-Six 455 Golden Gate Avenue-Fourteen Site Location: 350 McAllister Street and 455 Golden Gate Avenue are both located between Polk and Larkin streets in downtown San Francisco. Adjacent properties consist of similar mid-rise and high-rise civic center buildings, including San Francisco City Hall to the southwest. Source: CBRE Golden State Portfolio Offering Memorandum. 16 KELLOGG SCHOOL OF MANAGEMENT Authorized for use only by isaac bounadere in FINA 320 at Concordia University from 1/24/2024 to 4/29/2024. Use outside these parameters is a copyright violation. 5-311-507 GOLDEN OPPORTUNITY Exhibit 12A: San Francisco Civic Center-Lease Abstract Lease Term Rentable Space Rent 20 years, July 2010 to June 2030 912,387 square feet (1,500 square feet reserved for property management office) Years SF S/Month S/SF/Month S/Year $/SF/Year 1 to 5 910,887 $2.968,630 $3.26 $35,623,555 $39.11 6 to 10 910,887 $3,265,493 $3.58 $39,185,911 $43.02 11 to 15 910,887 $3.592,042 $3.94 $43,104,502 $47.32 16 to 20 910.887 $3,951,246 $4.34 $47,414,952 $52.06 Parking Operating Expenses CPI Escalator Real Estate Tax Escalator Painting and Carpet Subletting Insurance Right of First Refusal Option to Renew Lease Onsite Management Exclusive right (but no obligation) to the 65 parking spaces at a charge of $250 per stall per month. Rate increases by 10% every 5 years. Provided at Lessor's sole cost and expense. Includes security, cleaning, repairs & maintenance, utilities (inclusive of sewer, trash, and water but exclusive of gas and electricity), management, lot & landscaping, parking, taxes, and insurance. Every 12 months, the monthly Rent will automatically increase by 1/12th of an amount determined by multiplying $9,971,440' by the percentage increase in the CPI index for the preceeding 12 months. Every 12 months, monthly Rent will automatically increase by 1/12th of an amount determined by multiplying the annual property tax expense for the preceeding 12 months by the percent increased capped at 2%. Current real estate tax millage rate is 1.14%. Provided at Lessor's sole cost and expense. Repainting to occur every 5 years at $2 per square foot. Carpets replaced every 10 years at $2 per square foot. With written consent of Lessor, State may sublet the premises. Provided at Lessor's sole cost and expense as required by law. Eligible for offers tenured 90 days or more prior to termination date. The State shall have 30 days from receipt of the offer to acquire the Property under the same terms and conditions. State shall have the option to extend the lease for 6 additional terms of 5 years. State shall provide written notice at least 24 months prior to expiration. Provided at the Lessor's sole cost and expense at $279,996 based on a portfolio sale. Figured based on total operating expenses less real estate taxes. Source: CBRE Golden State Portfolio Offering Memorandum. KELLOGG SCHOOL OF MANAGEMENT 17 Authorized for use only by isaac bounadere in FINA 320 at Concordia University from 1/24/2024 to 4/29/2024. Use outside these parameters is a copyright violation. GOLDEN OPPORTUNITY Exhibit 13A: San Francisco Civic Center-Pro Forma 2011 Physical Occupancy Overall Economic Occupancy a Total Operating Expenses PSF Per Year 2012 100.00% 100.00% 100.00% 100.00% $15.17 $15.58 2013 FY 2011 Revenues S/SF/YR b 2014 100.00% 2015 100.00% 2016 2018 2020 2021 2017 2019 100.00% 100.00% 100.00% 100.00% 100.00% 100.00% 100.00% 100.00% 100.00% 100.00% 100.00% 100.00% 100.00% 100.00% 100.00% 100.00% $16.00 $16.89 $17.35 $17.82 $19.32 $16.44 $18.31 $18.81 $19.85 0 0 0 0 0 0 0 0 35,682,218 35,682,218 35,682,218 39,250,440 39,250,440 39,250,440 39,250,440 39,250,440 43,175,484 0 0 0 0 Scheduled Base Rent Gross Potential Rent $39.11 $35,682,218 $35,682,218 $35,682,218 $35,682,218 $35,682,218 $39,250,440 $39,250,440 $39,250,440 $39,250,440 $39,250,440 $43,175,484 Absorption & Turnover Vacancy 0 0 0 Base Rent Abatements 0 0 0 0 0 0 0 0 0 0 0 0 0 Total Scheduled Base Rent 39.11 35,682,218 35,682,218 Expense Reimbursement 0 0 0 0 0 0 0 0 Parking Revenue 0.21 195,000 State of CA Expense Increases. 0 0 195,000 375,836 195,000 195,000 762,175 1,159,316 195,000 1,567,569 214,500 214,500 1,987,251 2,418,687 Total Gross Revenue 39.32 General Vacancy Loss 0 0 Effective Gross Revenue 0 0 0 37,036,534 37,444,787 0 0 Operating Expenses Security Cleaning Repairs & Maintenance Utilities 214,500 214,500 214,500 235,950 2,862,215 3,318,179 3,786,935 4,268,849 35,877,218 36,253,054 36,639,393 37,036,534 37,444,787 41,452,191 41,883,627 42,327,155 42,783,119 43,251,875 47,680,283 0 39.32 35,877,218 36,253,054 36,639,393 0 0 0 0 41,452,191 41,883,627 42,327,155 42,783,119 43,251,875 47,680,283 (1.30) (1,184,400) (1,219,932) (1,256,530) (1,294,226) (1,333,053) (1,373,044) (1,414,236) (1,456,663) (1,500,362) (1,545,373) (1,591,735) (3.80) (3,467,070) (3,571,082) (3,678,215) (3,788,561) (3,902,218) (4,019,284) (4,139,863) (4,264,059) (4,391,981) (4,523,740) (4,659,452) (2.53) (2,304,311) (2,373,440) (2,444,644) (2,517,983) (2,593,522) (2,671,328) (2,751,468) (2,834,012) (2,919,032) (3,006,603) (3,096,801) (0.20) (182,400) (187,872) (193,508) (199,313) (205,293) (211,452) (217,795) (224,329) (231,059) (237,991) (245,130) (0.31) (279,996) (288,396) (297,048) (305,959) (315,138) (324,592) (334,330) (344,360) (354,691) (365,331) (0.22) (205,063) (211,215) (217,551) (224,078) (230,800) (237,724) (244,856) (252,202) (259,768) (267,561) (426,000) (438,780) (451,943) (465,502) (479,467) (493,851) (508,666) (523,926) (539,644) (555,833) (0.28) (256,800) (264,504) (272,439) (280,612) (289,031) (297,702) (306,633) (315,832) (325,307) (335,066) (345,118) (0.13) (121,200) (124,836) (128,581) (132,439) (136,412) (140,504) (144,719) (149,061) (153,533) (158,139) (162,883) Management Fee Onsite Office Expense Admin (Excl Mgt Fee) (0.47) Lot & Landscaping Parking Real Estate Taxes Insurance Total Operating Expenses Net Operating Income Capital Costs (376,291) (275,588) (572,508) (4.24) (3,865,522) (3,942,832) (4,021,689) (4,102,123) (4,184,164) (4,267,849) (4,353,206) (4,440,270) (4,529,075) (4,619,657) (4,712,050) (1.69) (1,544,200) (1,590,526) (1,638,242) (1,687,389) (1,738,011) (1,790,151) (1,843,856) (1,899,171) (1,956,146) (2,014,831) (2,075,276) (15.17) (13,836,962) (14,213,415) (14,600,390) (14,998,185) (15,407,110) (15,827,481) (16,259,628) (16,703,885) (17,160,598) (17,630,125) (18,112,832) 24.16 22,040,256 22,039,639 22,039,003 22,038,349 22,037,677 25,624,710 25,623,999 25,623,270 25,622,521 25,621,750 29,567,451 Tenant Improvements 0.00 0 Leasing Commissions. Capital Reserves State of CA- Paint & Carpet C 0.00 (0.15) 0.00 0 0 0 0 0 0 0 0 0 0 0 0 0 0 0 0 0 0 0 0 0 (136,858) 0 (140,964) (145,193) 0 0 (149,548) 0 (154,035) (158,656) (163,416) 0 (1,821,774) 0 (168,318) 0 (173,368) (178,569) (183,926) 0 Total Capital Costs (0.15) (136,858) (140,964) (145,193) (149,548) (154,035) (1,980,430) (163,416) (168,318) 0 (3,643,548) (173,368) (178,569) (3,827,474) Operating Cash Flow $24.01 $21,903,398 $21,898,675 $21,893,810 $21,888,801 $21,883,642 $23,644,280 $25,460,583 $25,454,952 $25,449,153 $25,443,181 $25,739,977 *This figure takes into account vacancy/credit loss, absorption vacancy, turnover vacancy, and base rent abatements. b Based on 912,387 square feet. "State of California to have premises repainted every five years (estimated to be $2 per square foot) and recarpeted every ten years (estimated to be $2 per square foot). Source: CBRE Golden State Portfolio Offering Memorandum. KELLOGG SCHOOL OF MANAGEMENT 18 5-311-507 Authorized for use only by isaac bounadere in FINA 320 at Concordia University from 1/24/2024 to 4/29/2024. Use outside these parameters is a copyright violation.
Step by Step Solution
There are 3 Steps involved in it
Step: 1

Get Instant Access to Expert-Tailored Solutions
See step-by-step solutions with expert insights and AI powered tools for academic success
Step: 2

Step: 3

Ace Your Homework with AI
Get the answers you need in no time with our AI-driven, step-by-step assistance
Get Started


