Answered step by step
Verified Expert Solution
Question
1 Approved Answer
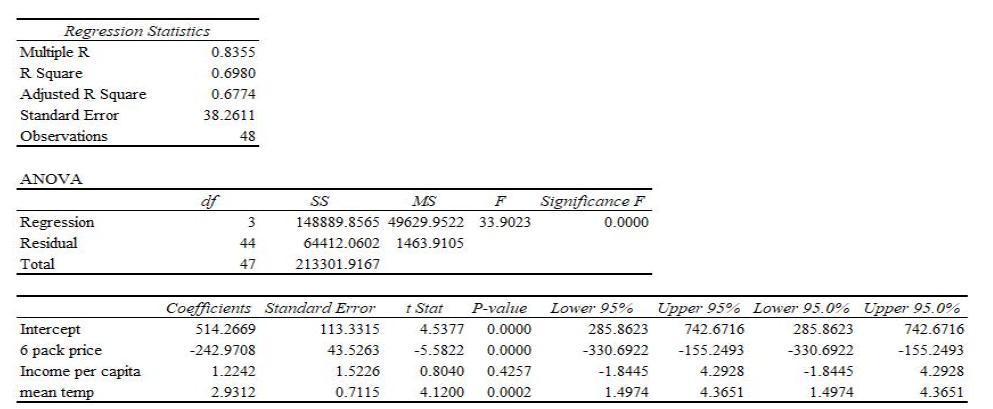
Regression Statistics Multiple R R Square Adjusted R Square 0.8355 0.6980 0.6774 Standard Error 38.2611 Observations 48 ANOVA df SS MS F Significance F
Regression Statistics Multiple R R Square Adjusted R Square 0.8355 0.6980 0.6774 Standard Error 38.2611 Observations 48 ANOVA df SS MS F Significance F Regression 3 148889.8565 49629.9522 33.9023 0.0000 Residual 44 64412.0602 1463.9105 Total 47 213301.9167 Coefficients Standard Error t Stat P-value Lower 95% Upper 95% Lower 95.0% Upper 95.0% Intercept 514.2669 113.3315 4.5377 0.0000 285.8623 742.6716 285.8623 742.6716 6 pack price Income per capita -242.9708 43.5263 -5.5822 0.0000 -330.6922 -155.2493 -330.6922 -155.2493 1.2242 1.5226 0.8040 0.4257 -1.8445 4.2928 -1.8445 4.2928 mean temp 2.9312 0.7115 4.1200 0.0002 1.4974 4.3651 1.4974 4.3651 b. What is the coefficient of determination? Explain what it means? [2 Marks] c. Do the signs of the coefficients make economic sense? Which of the coefficients are significant? (alpha = 0.025, df = 6, critical t-statistic = 2.447) [2 Marks] d. Find the price and income elasticities using the average values. Interpret the answers. [2 Marks]
Step by Step Solution
There are 3 Steps involved in it
Step: 1
b Rsquare value is coefficient of determination and the value is 069...
Get Instant Access to Expert-Tailored Solutions
See step-by-step solutions with expert insights and AI powered tools for academic success
Step: 2

Step: 3

Ace Your Homework with AI
Get the answers you need in no time with our AI-driven, step-by-step assistance
Get Started


