AutoSave @ (0 [ B ASSIGN#2 RCM DocuSign 4aBbCcDdEe|ll AaBbCcDc Empha: Heading 1 B. DESCRIPTIVE STATISTICS 1. Once you have downloaded, saved, and opened the
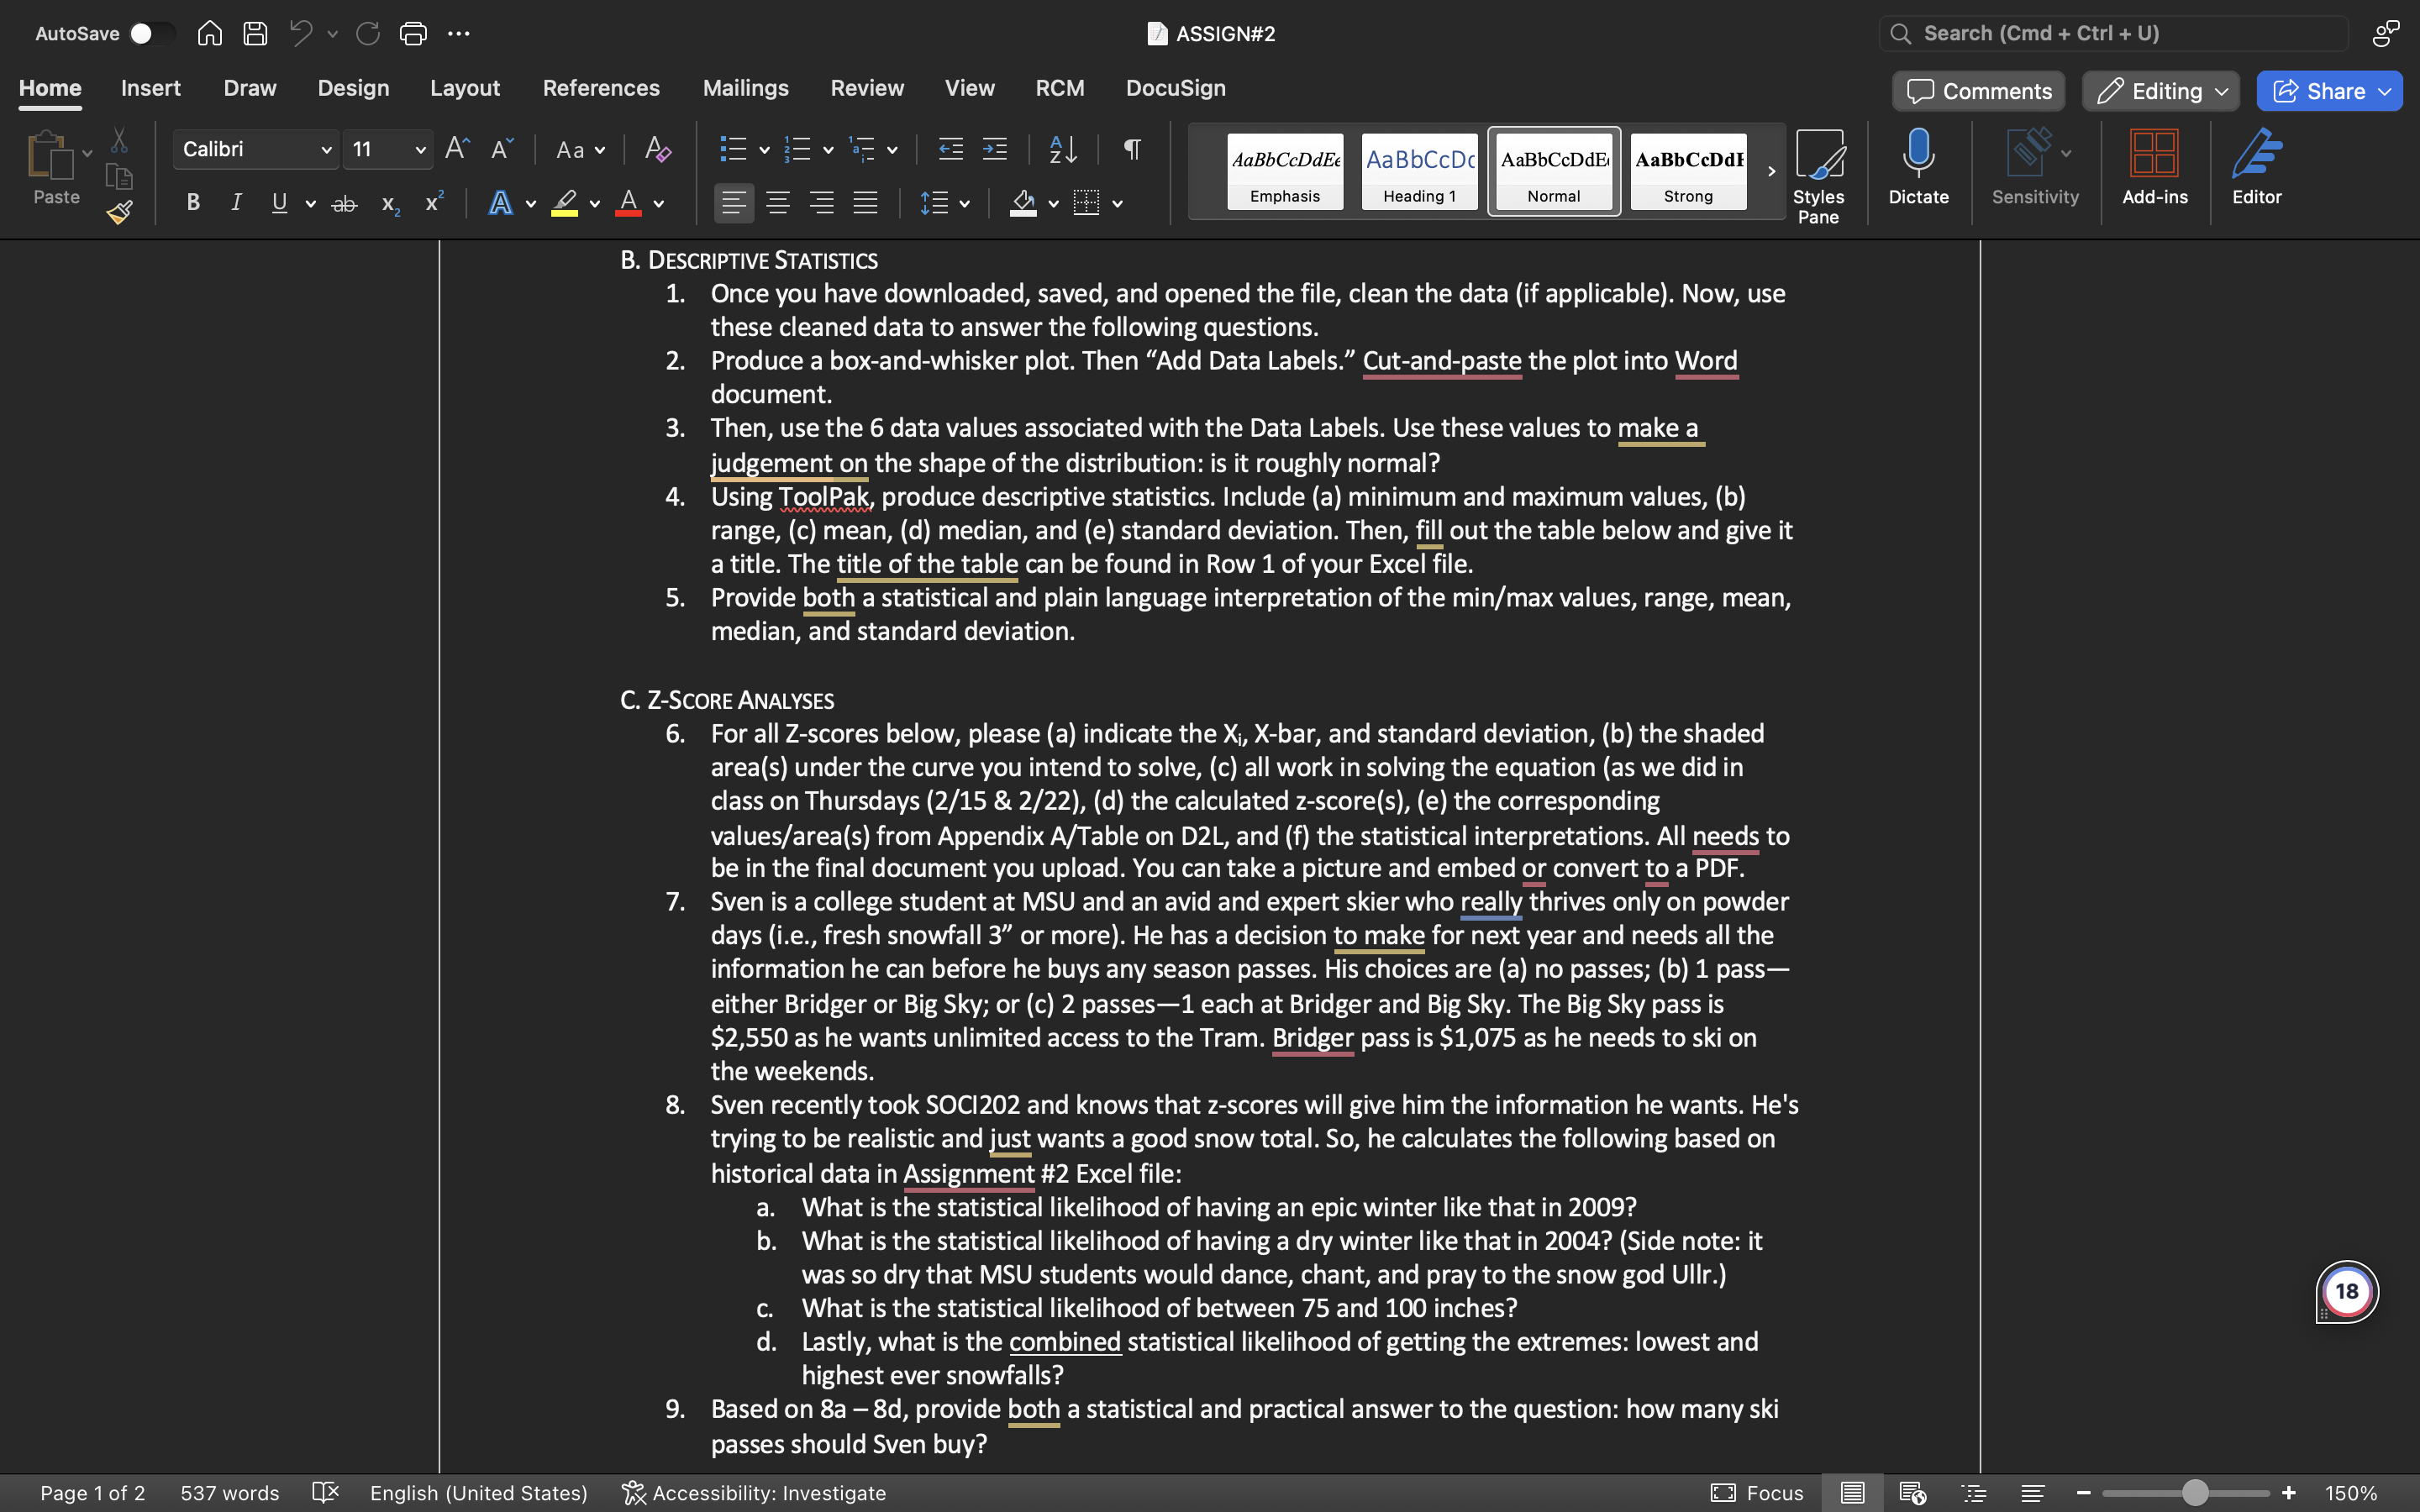
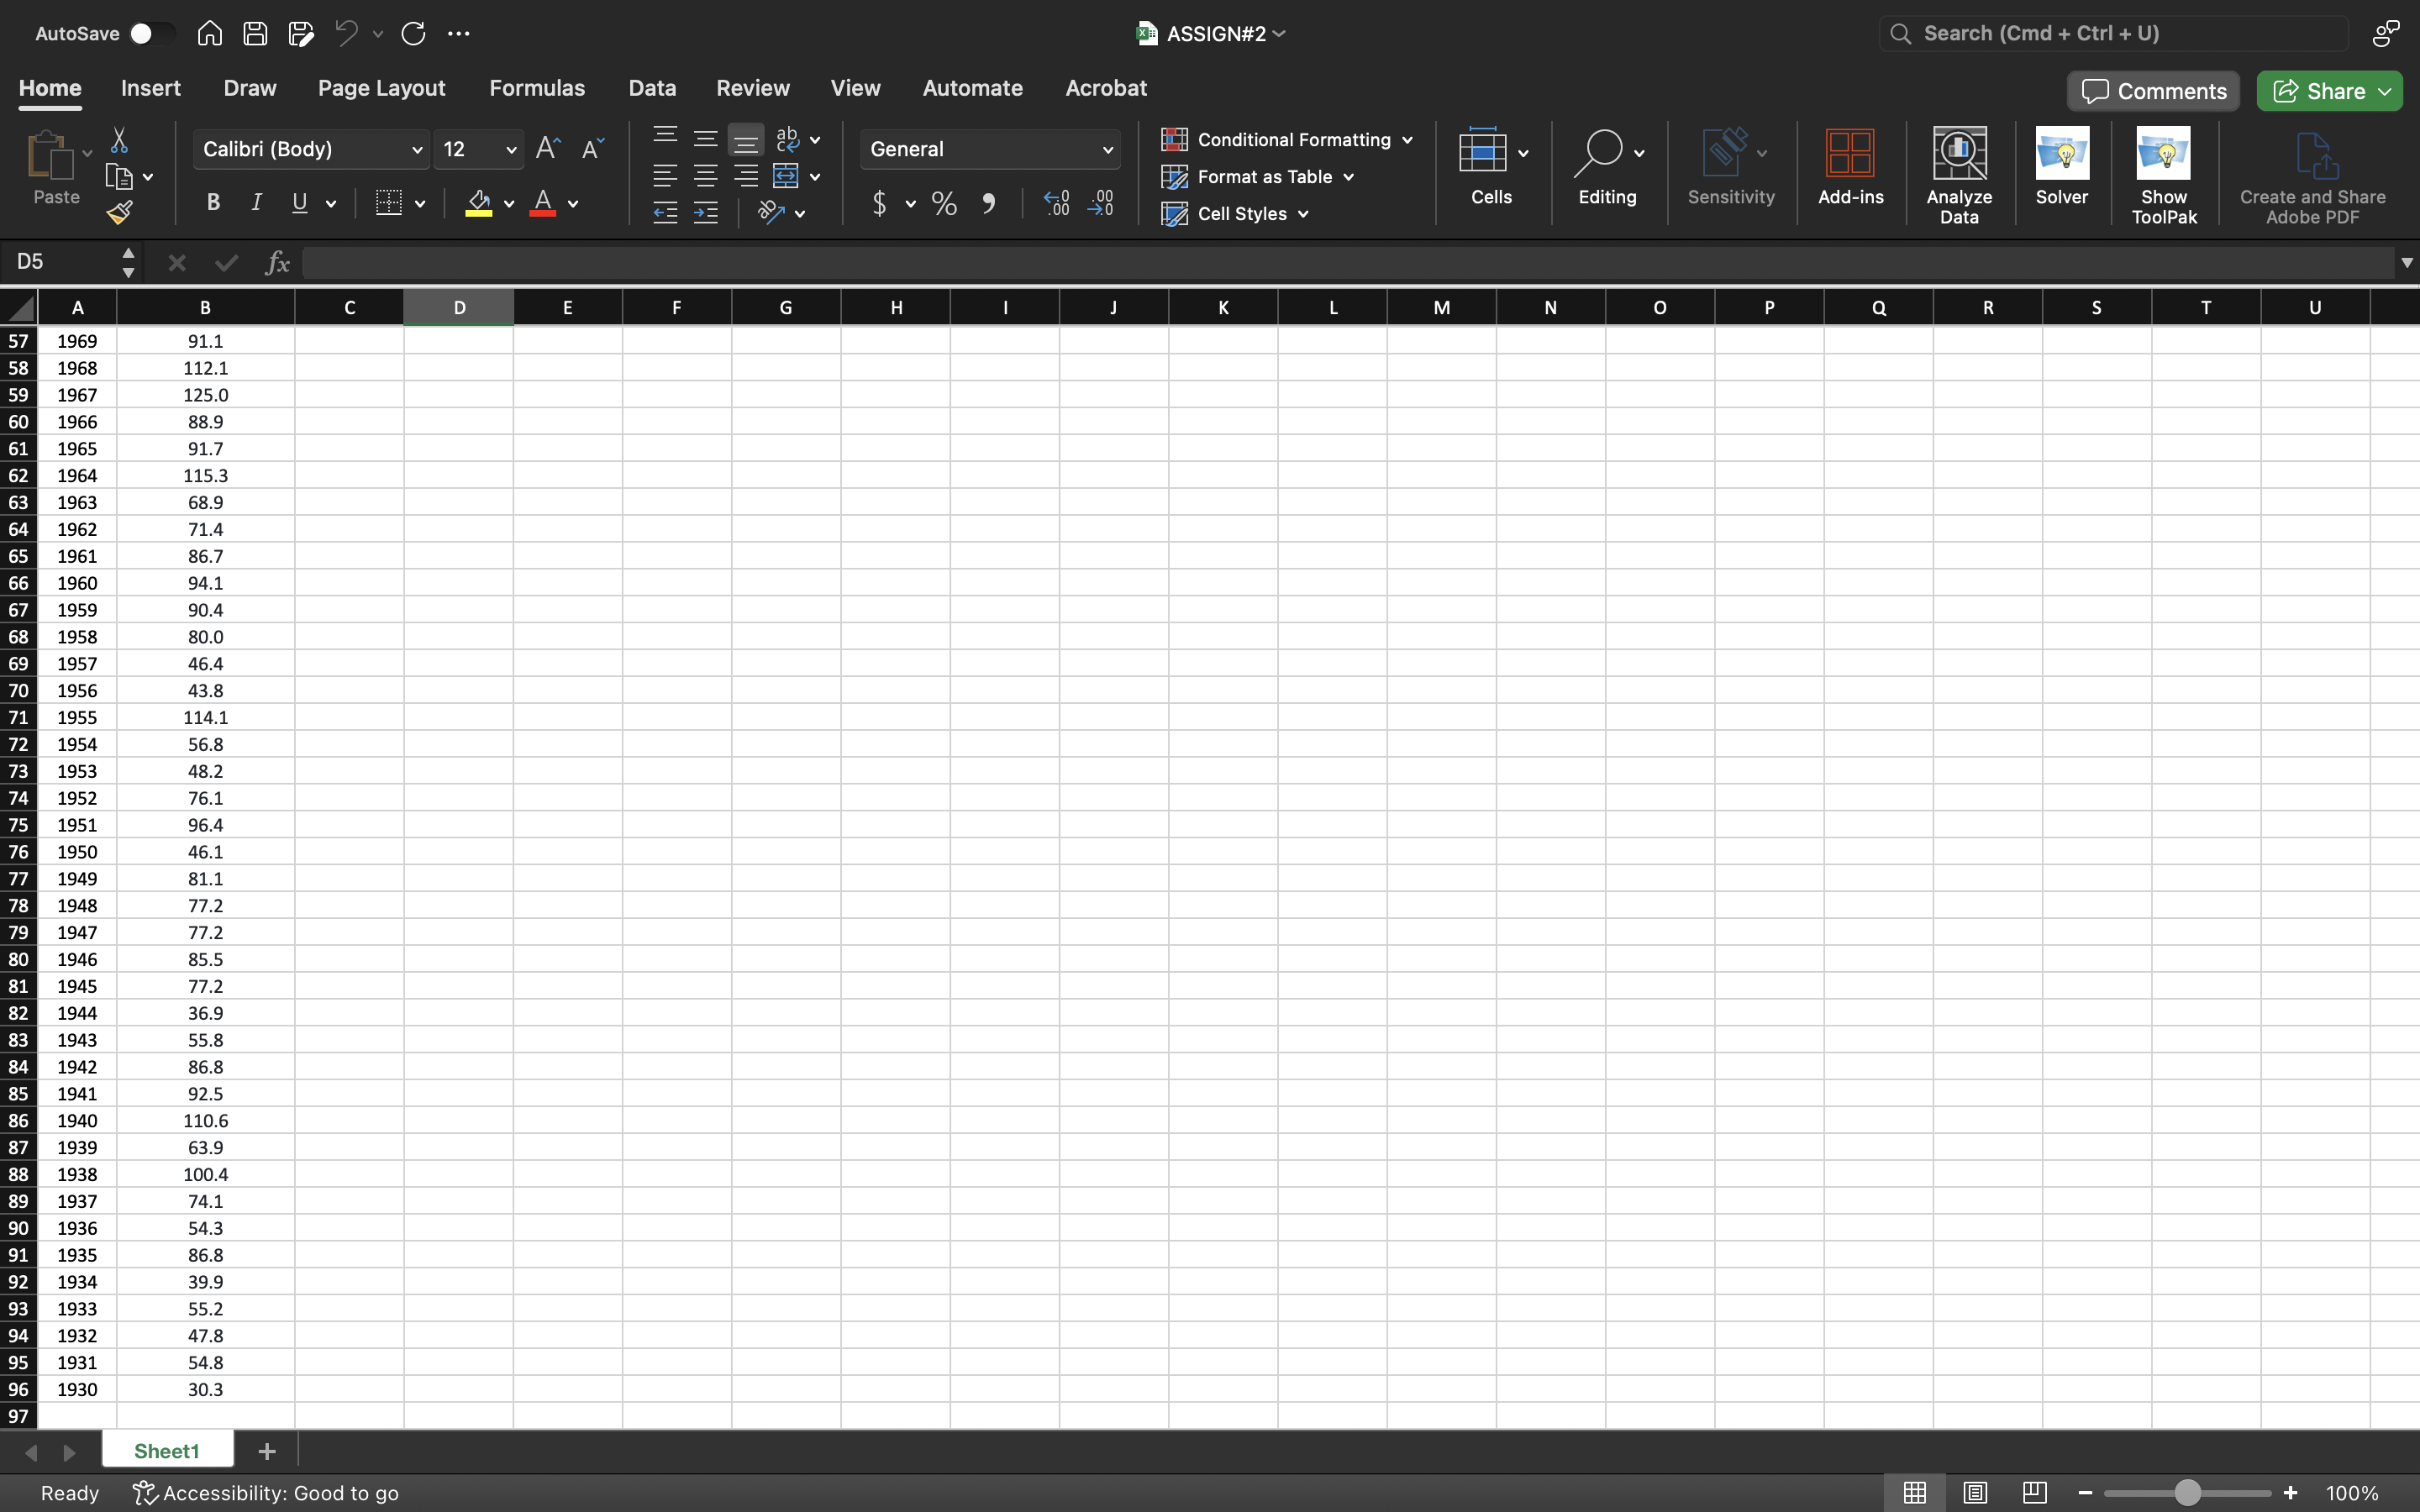
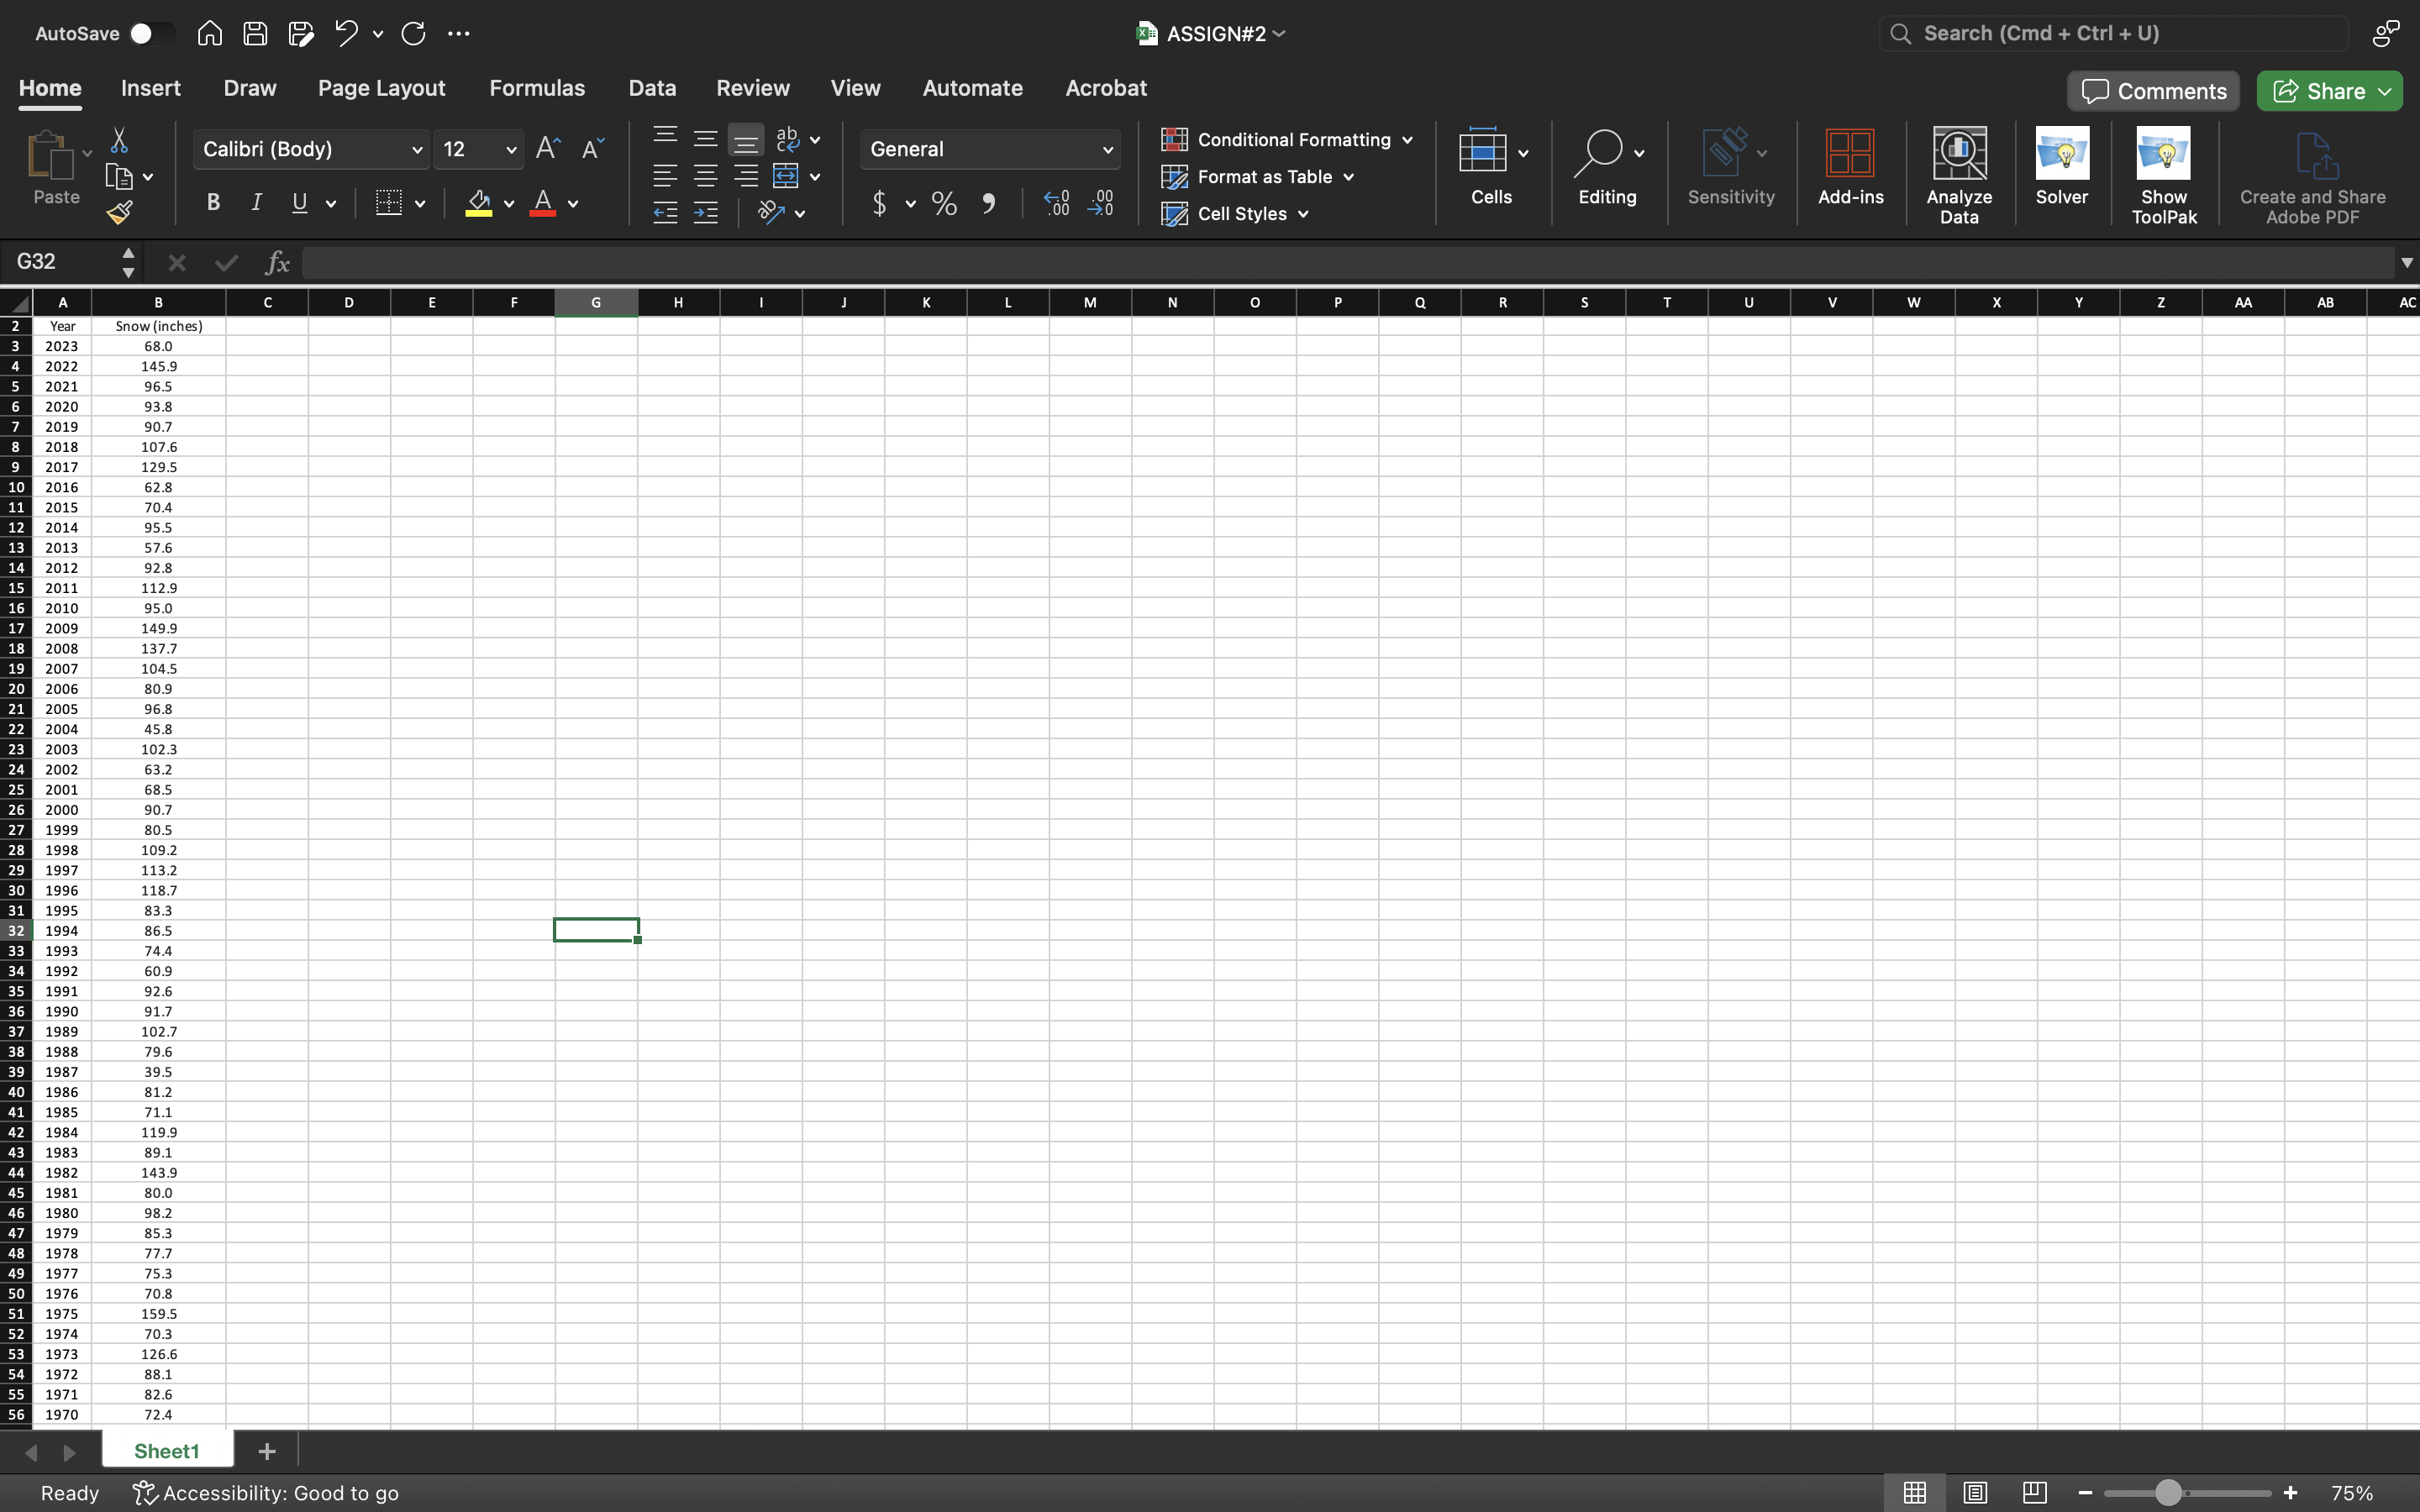
AutoSave @ (0 [ B ASSIGN#2 RCM DocuSign 4aBbCcDdEe|ll AaBbCcDc Empha: Heading 1 B. DESCRIPTIVE STATISTICS 1. Once you have downloaded, saved, and opened the file, clean the data (if applicable). Now, use these cleaned data to answer the following questions. Produce a box-and-whisker plot. Then \"Add Data Labels.\" Cut-and-paste the plot into Word document. Then, use the 6 data values associated with the Data Labels. Use these values t judgement on the shape of the distribution: is it roughly normal? Using ToolPak, produce descriptive statistics. Include (a) minimum and maximum values, (b) range, (c) mean, (d) median, and (e) standard deviation. Then, fill out the table below and give it a title. The title of the table can be found in Row 1 of your Excel file. Provide both a statistical and plain language interpretation of the min/max values, range, mean, median, and standard deviation. 13610 Insert Draw Design (=101 References Mailings Review A Calibri = B I Uvab Pane ke a (o Zele T\\ 6. For all Z-scores below, please (a) indicate the X;, X-bar, and standard deviation, (b) the shaded area(s) under the curve you intend to solve, (c) all work in solving the equation (as we did in class on Thursdays (2/15 & 2/22), (d) the calculated z-score(s), (e) the corresponding values/area(s) from Appendix A/Table on D2L, and (f) the statistical interpretations. All needs to be in the final document you upload. You can take a picture and embed or convert to a PDF. Sven is a college student at MSU and an avid and expert skier who really thrives only on powder days (i.e., fresh snowfall 3\" or more). He has a decision to make for next year and needs all the information he can before he buys any season passes. His choices are (a) no passes; (b) 1 pass either Bridger or Big Sky; or (c) 2 passes1 each at Bridger and Big Sky. The Big Sky pass is $2,550 as he wants unlimited access to the Tram. Bridger pass is $1,075 as he needs to ski on the weekends. Sven recently took SOCI202 and knows that z-scores will give him the information he wants. He's trying to be realistic and just wants a good snow total. So, he calculates the following based on historical data in Assignment #2 Excel file: a. What is the statistical likelihood of having an epic winter like that in 2009? b. What is the statistical likelihood of having a dry winter like that in 2004? (Side note: it was so dry that MSU students would dance, chant, and pray to the snow god Ullr.) c. What is the statistical likelihood of between 75 and 100 inches? d. Lastly, what is the combined statistical likelihood of getting the extremes: lowest and highest ever snowfalls? 9. Based on 8a 8d, provide both a statistical and practical answer to the question: how many ski passes should Sven buy? Page1of2 537words [X English (United States) 'T,'; Accessibility: Investigate [T 2 Search (Cmd + Ctrl + U) AaBbCcDAH N 4% Strong S Di (J Comments / Editing v ) ictate Add-ins =11 E & o X FIRY 150% 3ASSIGN#2 ~ Q Search (Cmd + Ctrl + U) AutoSave WAFC ... Review View Automate Acrobat Comments Share Home Insert Draw Page Layout Formulas Data Calibri (Body) 12 AA do v General Conditional Formatting v Format as Table Cells $ ~ % 9 Editing Sensitivity Add-ins Analyze Solver Show Create and Share Paste BI Uv A Cell Styles v Data oolPak Adobe PDF D5 X V fx N P Q R S U B C D E F G H L M 57 1969 91.1 58 1968 112.1 1967 125.0 1966 88.9 1965 91.7 1964 115.3 63 1963 68.9 64 1962 71.4 65 1961 86.7 66 1960 94.1 67 1959 90.4 68 1958 80.0 69 1957 46.4 1956 43.8 1955 114.1 1954 56.8 1953 48.2 1952 76.1 1951 96.4 1950 46.1 1949 81.1 1948 77.2 1947 77.2 1946 85.5 1945 77.2 1944 36.9 83 1943 55.8 84 1942 36.8 85 1941 92.5 86 1940 110.6 1939 63.9 88 1938 100.4 89 1937 74.1 90 1936 54.3 1935 86.8 1934 39.9 1933 55.2 94 1932 47.8 95 1931 54.8 96 1930 30.3 97 Sheet1 + 100% Ready Accessibility: Good to goAutoSave " HE ? C ... 3ASSIGN#2 ~ Q Search (Cmd + Ctrl + U) Home Insert Draw Page Layout Formulas Data Review View Automate Acrobat Comments Share Calibri (Body) 12 AA do v General Conditional Formatting v Format as Table Paste BIUV A $ ~ % 9 Cells Editing Sensitivity Add-ins Analyze Solver Show Create and Share 207 Cell Styles v Data oolPak Adobe PDF G32 X V fx D G M 0 Q U V W AA AB Year now (inches) 2023 68.0 2022 145. 2021 96.5 2020 93.8 2019 90.7 2018 107.6 2017 129.5 2016 62.8 2015 70.4 2014 95.5 201 $7.6 2012 92.8 2011 112.9 16 201 95.0 200 149.9 18 2008 137.7 2007 104.5 20 200 80.9 21 200 96 .8 22 2004 45.8 23 200 102.3 200 63.2 2001 68.5 26 2000 90.7 27 199 80.5 199 109.2 29 1997 113.2 30 199 118.7 31 1995 83.3 32 1994 86.5 1993 74.4 1992 60.9 199 92.6 199 91.7 1989 102.7 38 1988 79.6 39 1987 39.5 40 1986 81.2 41 198 71.1 1984 119.9 1983 89.1 198: 143. 45 1981 80.0 46 1980 98.2 47 197 85.3 48 197 77,7 49 197 50 1976 70.8 51 197 159.5 52 197 70.3 197 126.6 54 1972 88.1 55 1971 82.6 1970 72.4 Sheet1 + Ready Accessibility: Good to go 75%
Step by Step Solution
There are 3 Steps involved in it
Step: 1
Get Instant Access to Expert-Tailored Solutions
See step-by-step solutions with expert insights and AI powered tools for academic success
Step: 2
Step: 3
Ace Your Homework with AI
Get the answers you need in no time with our AI-driven, step-by-step assistance