

Question: AutoSave O Off) Document3 - Word Search Brandy Majewski BM X File Home Insert Draw Design Layout References Mailings Review View Help Grammarly Share Comments
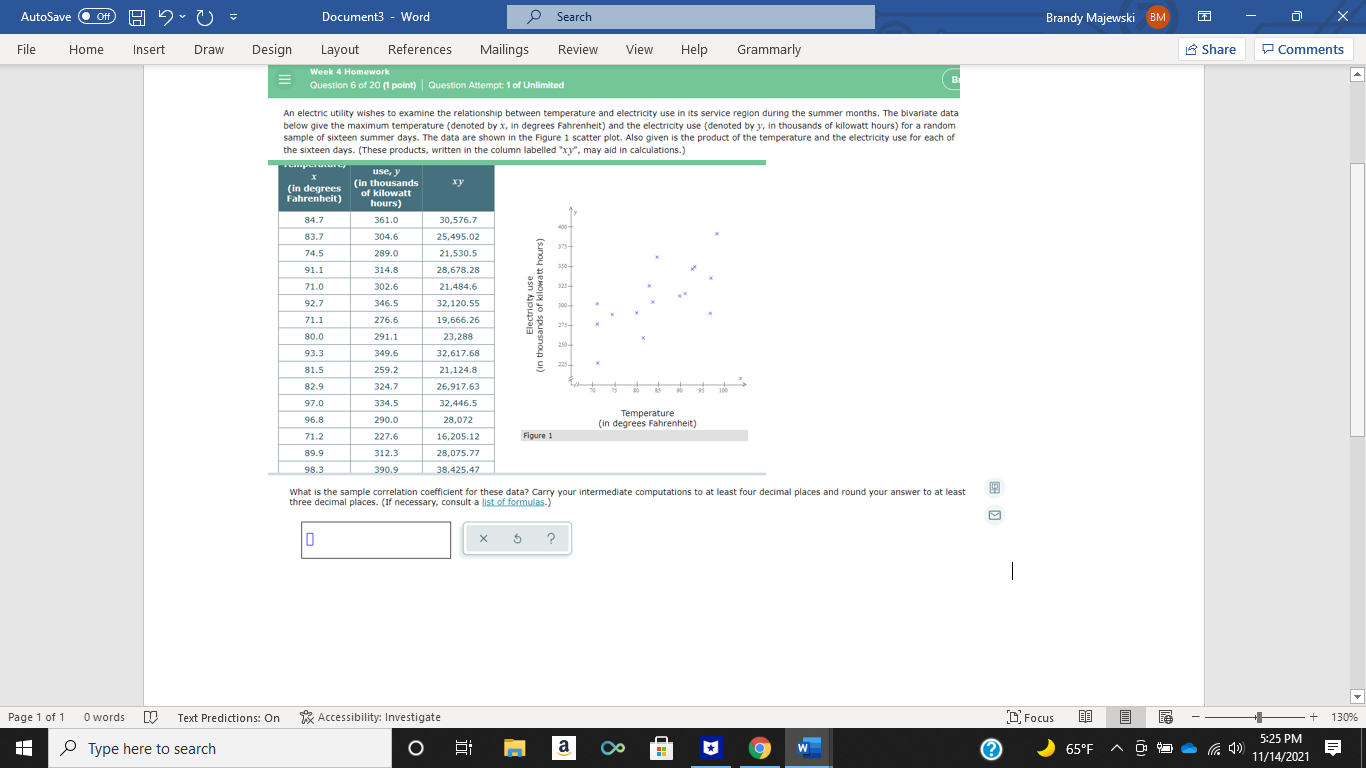
AutoSave O Off) Document3 - Word Search Brandy Majewski BM X File Home Insert Draw Design Layout References Mailings Review View Help Grammarly Share Comments Week 4 Homework = Question 6 of 20 (1 point) | Question Attempt: 1 of Unlimited An electric utility wishes to examine the relationship between temperature and electricity use in its service region during the summer months. The bivariate data below give the maximum temperature (denoted by x, in degrees Fahrenheit) and the electricity use (denoted by y, in thousands of kilowatt hours) for a random sample of sixteen summer days. The data are shown in the Figure 1 scatter plot. Also given is the product of the temperature and the electricity use for each of the sixteen days. (These products, written in the column labelled "xy", may aid in calculations.) use, } (in thousands xy (in degrees Fahrenheit) of kilowatt hours) 84.7 361.0 30,576.7 83.7 304.6 25,495.02 375- 74.5 289.0 21,530.5 91.1 314.8 28,678.28 350- 71.0 302.6 21,484.6 325- 92.7 346.5 32,120.55 Electricity use (in thousands of kilowatt hours) 71.1 276.6 19,666.26 275- 80.0 291.1 23,288 250- 93.3 349.6 32,617.68 225- 81.5 259.2 21,124.8 82.9 324.7 26,917.63 97.0 334.5 32,446.5 96.8 290.0 28,072 Temperature (in degrees Fahrenheit) 71.2 227.6 16,205.12 Figure 1 89.9 312.3 28,075.77 98.3 390.9 38.425.47 What is the sample correlation coefficient for these data? Carry your intermediate computations to at least four decimal places and round your answer to at least three decimal places. (If necessary, consult a list of formulas.) X Page 1 of 1 0words [ Text Predictions: On 1% Accessibility: Investigate [ Focus + 130% 5:25 PM Type here to search O a Co 9 W ? 65 F ~ 9 3 - /4)) 11/14/2021
Step by Step Solution
There are 3 Steps involved in it

Get step-by-step solutions from verified subject matter experts