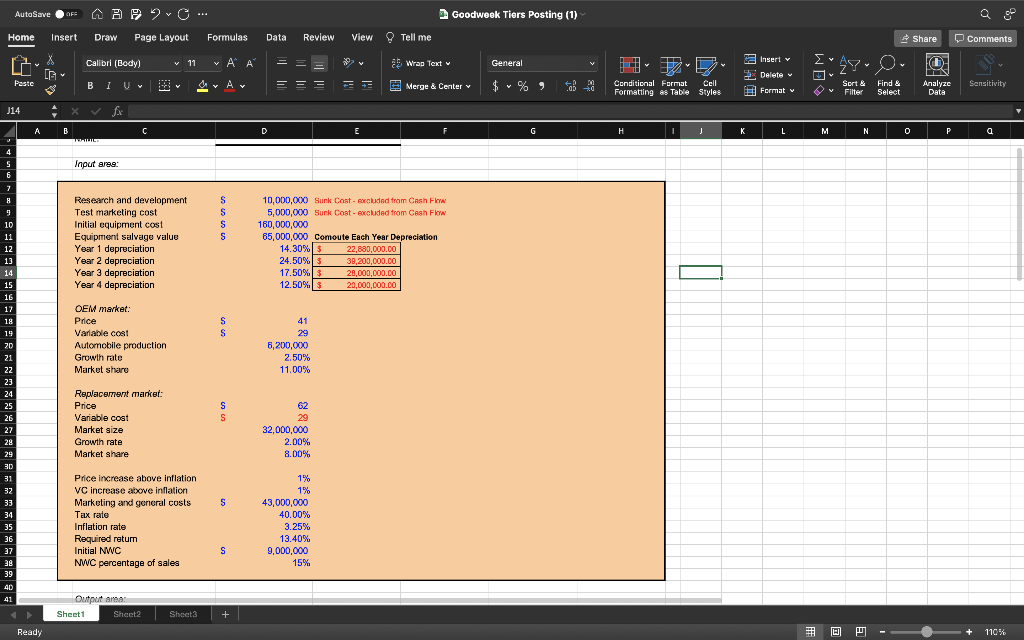
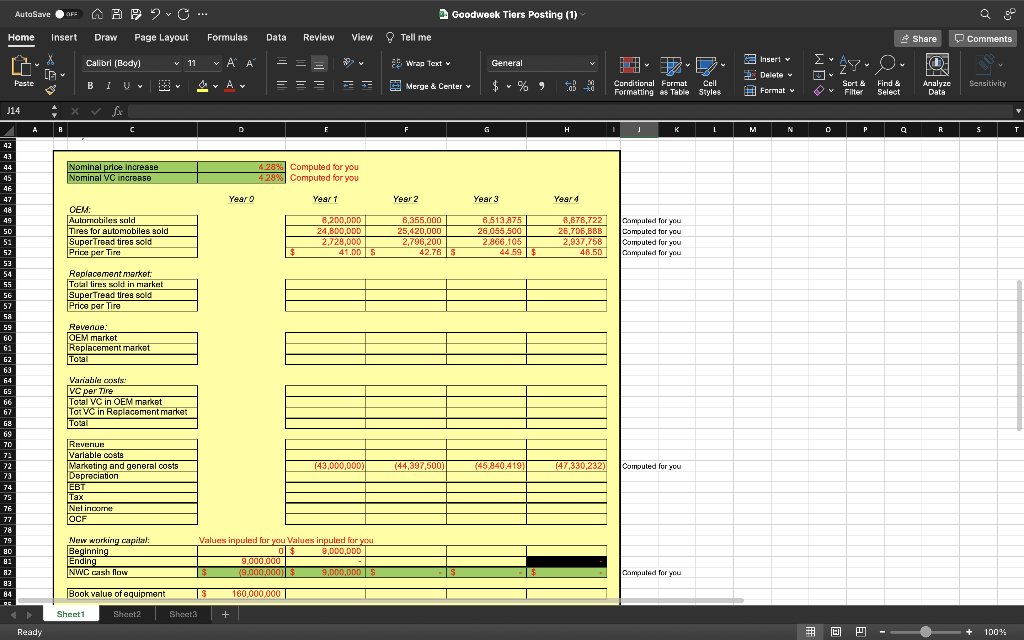
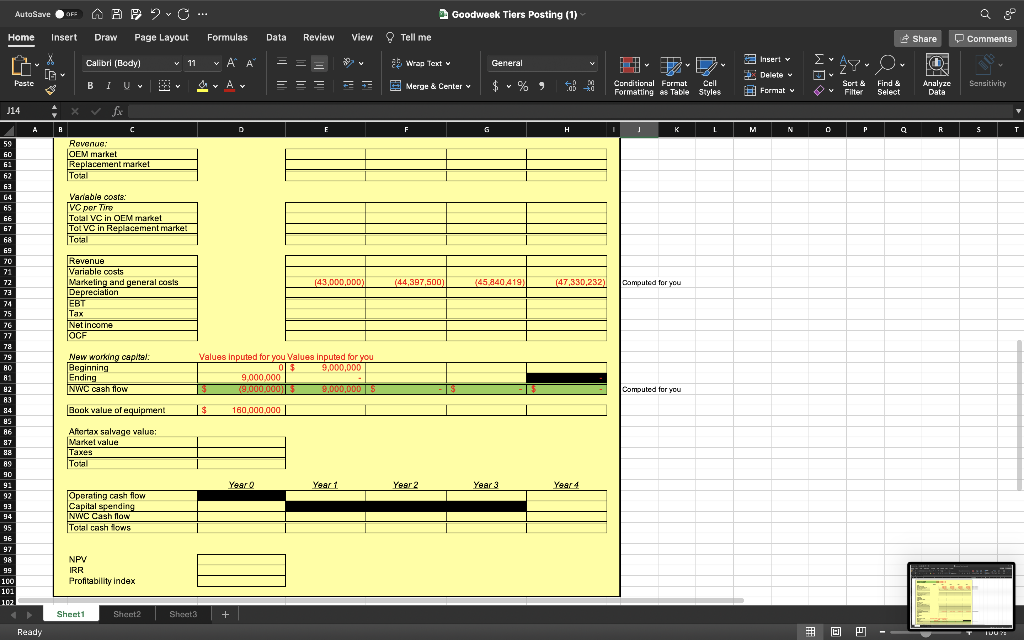
AutoSave OF A APO". Goodweek Tiers Posting (1) Home Insert Draw Page Layout Formulas Data Review View Tell me Share Comments Calibri (Body) v 11 v A A X G ab Wrap Text General Insert v ' , 0 v Delete v Paste ~ Ar Y = = = Merge & Center $ Conditional Format Cell Formatting es Table Styles Y Sort & Filter Sensitivity # Format Find & Select Analyze Data V J14 X fx A B C E G . I T J K L M N 0 P a Input ares: 4 S 6 7 8 S S S S 10 11 12 13 14 15 16 17 18 18 19 Research and development Test marketing cost Initial equipment cost Equipment salvage value Year 1 depreciation Year 2 depreciation Year 3 depreciation Year 4 depreciation 10,000,000 Sunk Costeoxoluded from Cash Flow 5,000,000 Sunk Cost-excluded from Cash Flow 180,000,000 85.000.000 Comoute Each Year Depreciation 14.30% 3 22,880,000.00 24.50% $ 39.200.000,00 17.50% 3 28,000,000.00 12.50% 20,000,000.00 S S OEM market: Price Variable cost Automobile production Growth rate Market share 41 29 6,200,000 2.50% 11.00% S S Replacement market: Price Variable cost Market size Growth rate Market share 32,000,000 2.00% 8.00% 21 22 23 24 25 26 27 28 29 30 31 32 33 34 35 36 37 38 39 40 41 S Price increase above inflation VC increase above inflation Marketing and general costs Tax rate Inflation rate Required return Initial NWC NWC percentage of sales 1% 1% 43,000,000 40.00% 3.25% 13.40% 9,000,000 15% S Output: Sheet1 Sheet2 Sheet3 + + Ready + 110% AutoSave OF A APO". Goodweek Tiers Posting (1) Home Insert Draw Page Layout Formulas Data Review View Tell me Share Comments Calibri (Body) v 11 v A A X G 5 Wrap Text General 2 Insert v 0 v Delete v Paste ~ Ar Y = = = - Merge & Center v Conditional Format Cell Formatting es Table Styles Sensitivity Sort & Filter Format v Find & Select Analyze Data V J14 fx . B C G H J K L M N o P Q R S Nominal price increase Nominal VC increase 4 28% Computed for you 428% Computed for you Year o Year 1 Year 2 Year 3 Year 1 OEM Automatiiles sold Tires for automobiles sold SuperTread tires sold Cunod Price per Tiret 8,200,000 24,800,00D 2,728,000 41.DDS 8,355,000 25,420,000 6,513 875 26.055,500 2,866,105 44.59 $ 2,796 200 8,878,722 26,706,8BB 2,937,758 48.50 Computed for you Domputed for you Computed for you Computed for you 42.78S Replacement market: Total tires sild in market Pepe SuperTread tires sold Price per Tire Revenue: OEM market Replacement market Total 42 43 44 45 46 47 48 49 50 51 52 53 54 55 56 57 58 59 60 61 62 63 64 GS 66 67 G2 69 70 71 72 73 74 75 76 77 78 79 80 81 82 83 84 DE Variable costs: VC per Tire Total VC in OEM market Tor VC in Replacement market Total (43,000,000) (44,397,500) (45,840,41991 (47,330,232) Computed for you Revenue Variable costs Marketing and general costs Depreciation | Net income OCF Now working capital Beginning Ending NWC cash flow Values inpuled for you Values inpuled for you 0 $ 9,000,0DD 9.000.000 $ (9.000.000) 9,000,000 S Computed for you Book value of oquipment IS 160,000,000 Sheet1 Sheet2 Sheet3 + Ready + 100% AutoSave OF AA2... Goodweek Tiers Posting (1) Home Insert Draw Page Layout Formulas Data Review View Tell me Share Comments Calibri (Body) v 11 X G v A A General 5 Wrap Text 0 0 2 Insert v Delete Format v v v Paste Y ~ Ar = = = Merge & Center v Y 4 Conditional Format Cell Formatting es Table Styles Sort & Filter Find & Select Analyze Data Sensitivity V J14 X fx A C E G H J K L M N 0 P Q Q R S Revenue OEM market Replacement market Total Variable costs: VC per Tire Total VC in OEM market Tot VC in Replacement market Total Revenue Variable costs (43,000,000) (44,397,500) (45.840419) (47,330,232) Comouted for you Marketing and general casis Depreciation EBT Tax Net Income OCF 59 60 61 62 63 G4 65 GE 67 68 69 20 71 72 73 74 75 76 77 78 29 AD 81 82 83 84 85 86 87 88 89 90 91 92 93 94 95 96 97 98 99 100 101 102 New working capital: Beginning Ending NWC cash flow Values Inputed for you Values inputed for you 03 9,000,000 9,000,000 3 (9.000.000 9,000,000S Computed for you Book value of equipment $ 160.000.000 Aftertax salvage value: Market value Taxes Total Year Yeart Year 2 Year 3 Year 4 Operating cash flow Capital spending NWC Cash flow Total cash lows NPV IRR Profitability Index Sheet1 Sheet2 Sheet: + Ready TUU? AutoSave OF A APO". Goodweek Tiers Posting (1) Home Insert Draw Page Layout Formulas Data Review View Tell me Share Comments Calibri (Body) v 11 v A A X G ab Wrap Text General Insert v ' , 0 v Delete v Paste ~ Ar Y = = = Merge & Center $ Conditional Format Cell Formatting es Table Styles Y Sort & Filter Sensitivity # Format Find & Select Analyze Data V J14 X fx A B C E G . I T J K L M N 0 P a Input ares: 4 S 6 7 8 S S S S 10 11 12 13 14 15 16 17 18 18 19 Research and development Test marketing cost Initial equipment cost Equipment salvage value Year 1 depreciation Year 2 depreciation Year 3 depreciation Year 4 depreciation 10,000,000 Sunk Costeoxoluded from Cash Flow 5,000,000 Sunk Cost-excluded from Cash Flow 180,000,000 85.000.000 Comoute Each Year Depreciation 14.30% 3 22,880,000.00 24.50% $ 39.200.000,00 17.50% 3 28,000,000.00 12.50% 20,000,000.00 S S OEM market: Price Variable cost Automobile production Growth rate Market share 41 29 6,200,000 2.50% 11.00% S S Replacement market: Price Variable cost Market size Growth rate Market share 32,000,000 2.00% 8.00% 21 22 23 24 25 26 27 28 29 30 31 32 33 34 35 36 37 38 39 40 41 S Price increase above inflation VC increase above inflation Marketing and general costs Tax rate Inflation rate Required return Initial NWC NWC percentage of sales 1% 1% 43,000,000 40.00% 3.25% 13.40% 9,000,000 15% S Output: Sheet1 Sheet2 Sheet3 + + Ready + 110% AutoSave OF A APO". Goodweek Tiers Posting (1) Home Insert Draw Page Layout Formulas Data Review View Tell me Share Comments Calibri (Body) v 11 v A A X G 5 Wrap Text General 2 Insert v 0 v Delete v Paste ~ Ar Y = = = - Merge & Center v Conditional Format Cell Formatting es Table Styles Sensitivity Sort & Filter Format v Find & Select Analyze Data V J14 fx . B C G H J K L M N o P Q R S Nominal price increase Nominal VC increase 4 28% Computed for you 428% Computed for you Year o Year 1 Year 2 Year 3 Year 1 OEM Automatiiles sold Tires for automobiles sold SuperTread tires sold Cunod Price per Tiret 8,200,000 24,800,00D 2,728,000 41.DDS 8,355,000 25,420,000 6,513 875 26.055,500 2,866,105 44.59 $ 2,796 200 8,878,722 26,706,8BB 2,937,758 48.50 Computed for you Domputed for you Computed for you Computed for you 42.78S Replacement market: Total tires sild in market Pepe SuperTread tires sold Price per Tire Revenue: OEM market Replacement market Total 42 43 44 45 46 47 48 49 50 51 52 53 54 55 56 57 58 59 60 61 62 63 64 GS 66 67 G2 69 70 71 72 73 74 75 76 77 78 79 80 81 82 83 84 DE Variable costs: VC per Tire Total VC in OEM market Tor VC in Replacement market Total (43,000,000) (44,397,500) (45,840,41991 (47,330,232) Computed for you Revenue Variable costs Marketing and general costs Depreciation | Net income OCF Now working capital Beginning Ending NWC cash flow Values inpuled for you Values inpuled for you 0 $ 9,000,0DD 9.000.000 $ (9.000.000) 9,000,000 S Computed for you Book value of oquipment IS 160,000,000 Sheet1 Sheet2 Sheet3 + Ready + 100% AutoSave OF AA2... Goodweek Tiers Posting (1) Home Insert Draw Page Layout Formulas Data Review View Tell me Share Comments Calibri (Body) v 11 X G v A A General 5 Wrap Text 0 0 2 Insert v Delete Format v v v Paste Y ~ Ar = = = Merge & Center v Y 4 Conditional Format Cell Formatting es Table Styles Sort & Filter Find & Select Analyze Data Sensitivity V J14 X fx A C E G H J K L M N 0 P Q Q R S Revenue OEM market Replacement market Total Variable costs: VC per Tire Total VC in OEM market Tot VC in Replacement market Total Revenue Variable costs (43,000,000) (44,397,500) (45.840419) (47,330,232) Comouted for you Marketing and general casis Depreciation EBT Tax Net Income OCF 59 60 61 62 63 G4 65 GE 67 68 69 20 71 72 73 74 75 76 77 78 29 AD 81 82 83 84 85 86 87 88 89 90 91 92 93 94 95 96 97 98 99 100 101 102 New working capital: Beginning Ending NWC cash flow Values Inputed for you Values inputed for you 03 9,000,000 9,000,000 3 (9.000.000 9,000,000S Computed for you Book value of equipment $ 160.000.000 Aftertax salvage value: Market value Taxes Total Year Yeart Year 2 Year 3 Year 4 Operating cash flow Capital spending NWC Cash flow Total cash lows NPV IRR Profitability Index Sheet1 Sheet2 Sheet: + Ready TUU