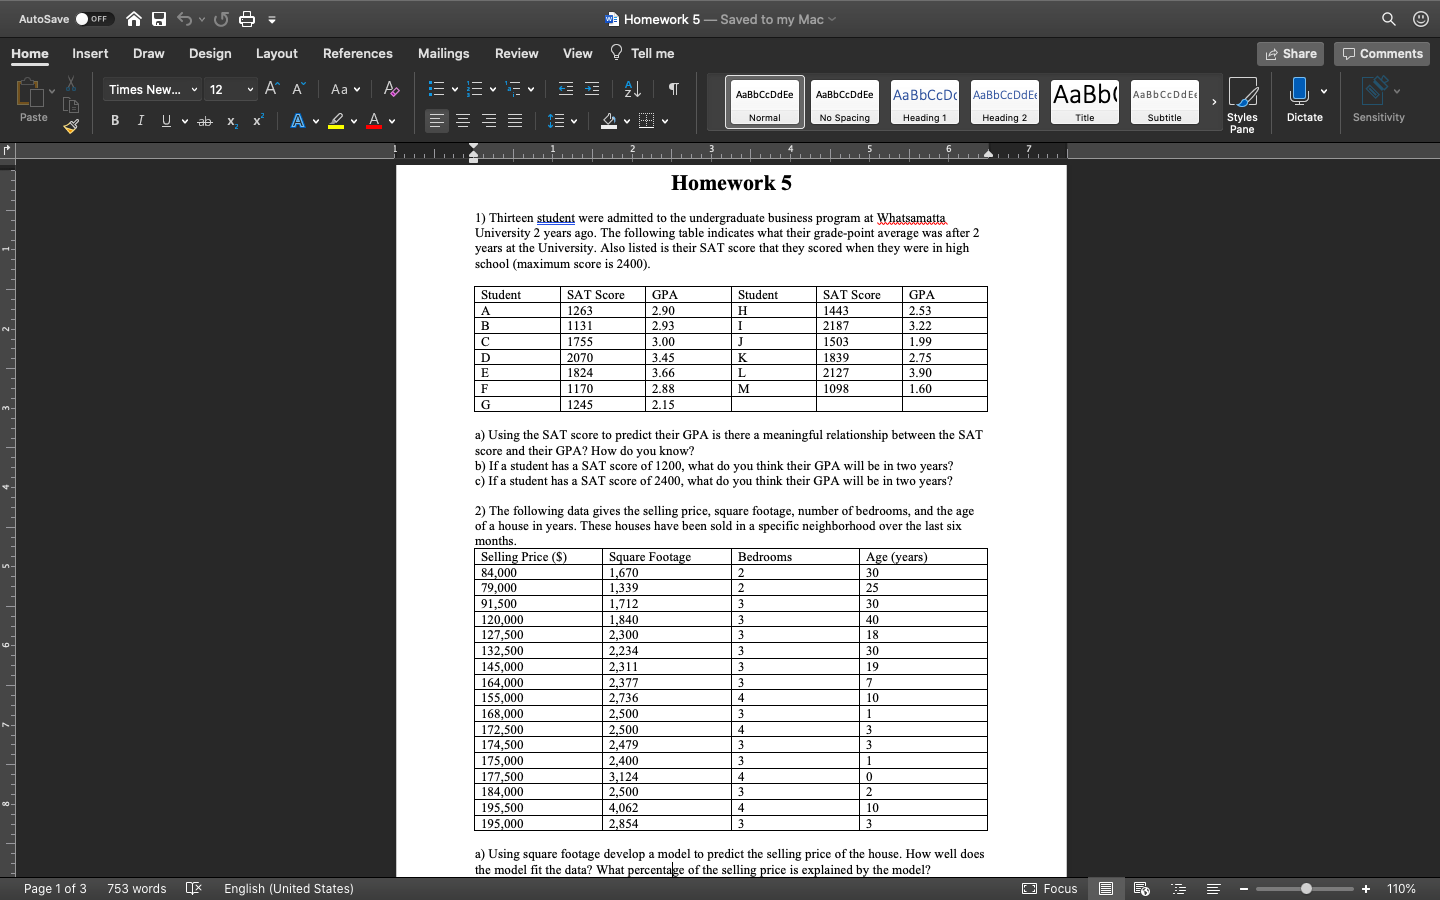
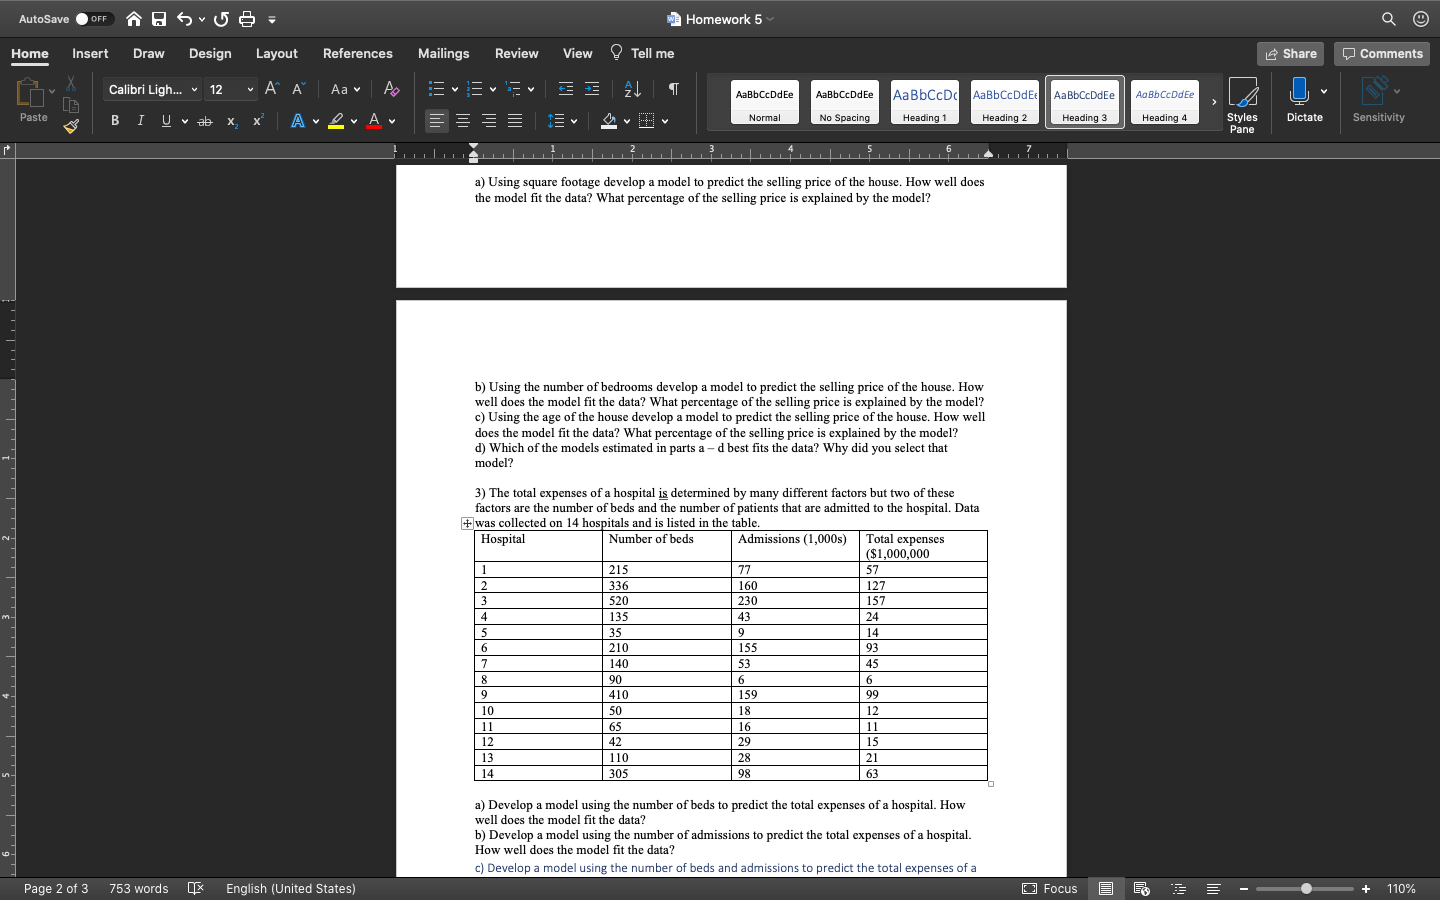
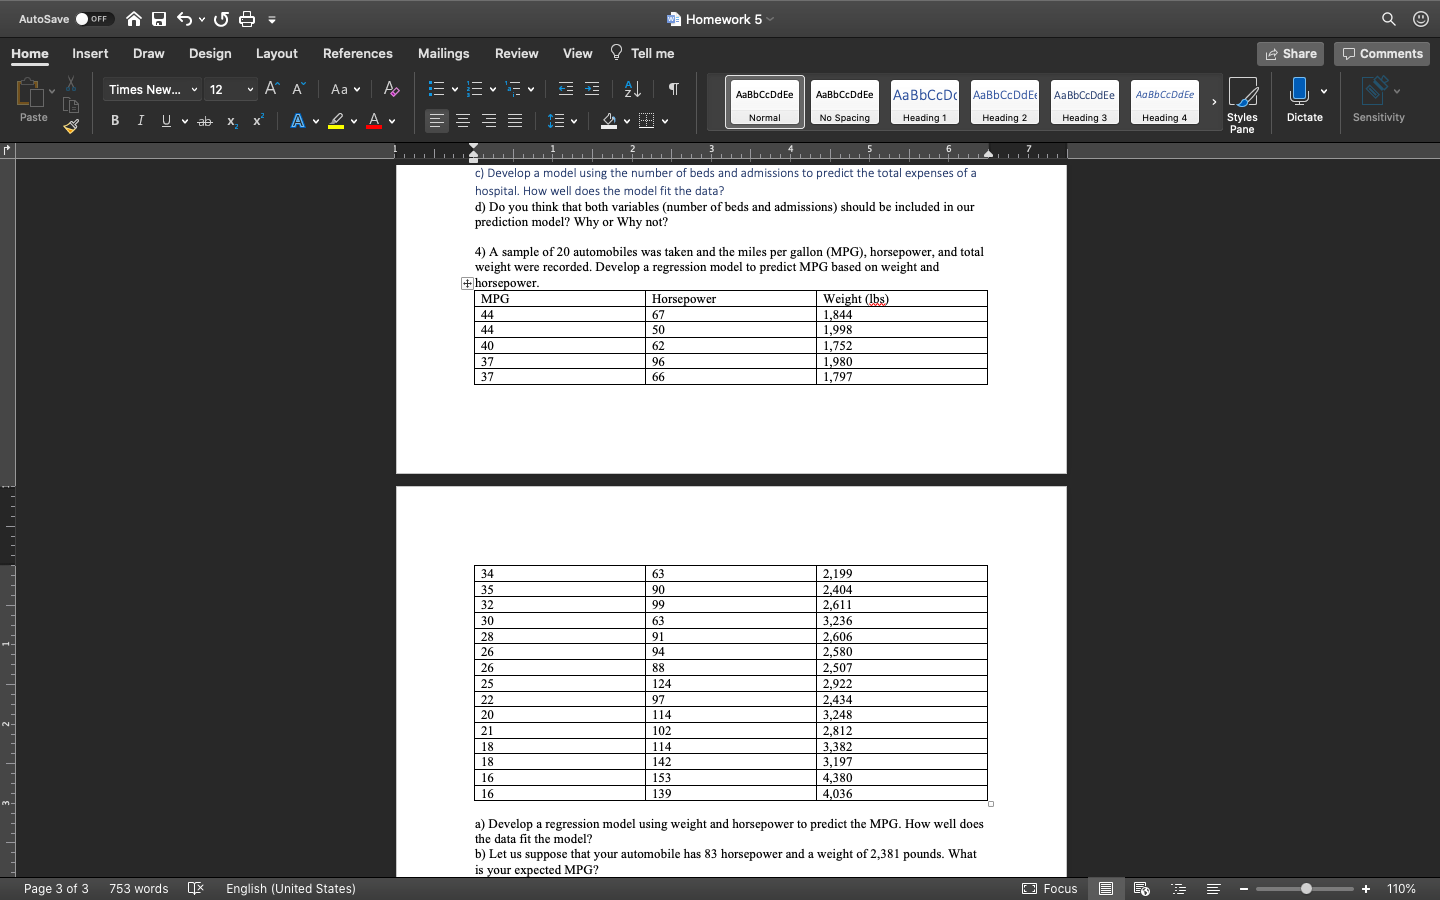
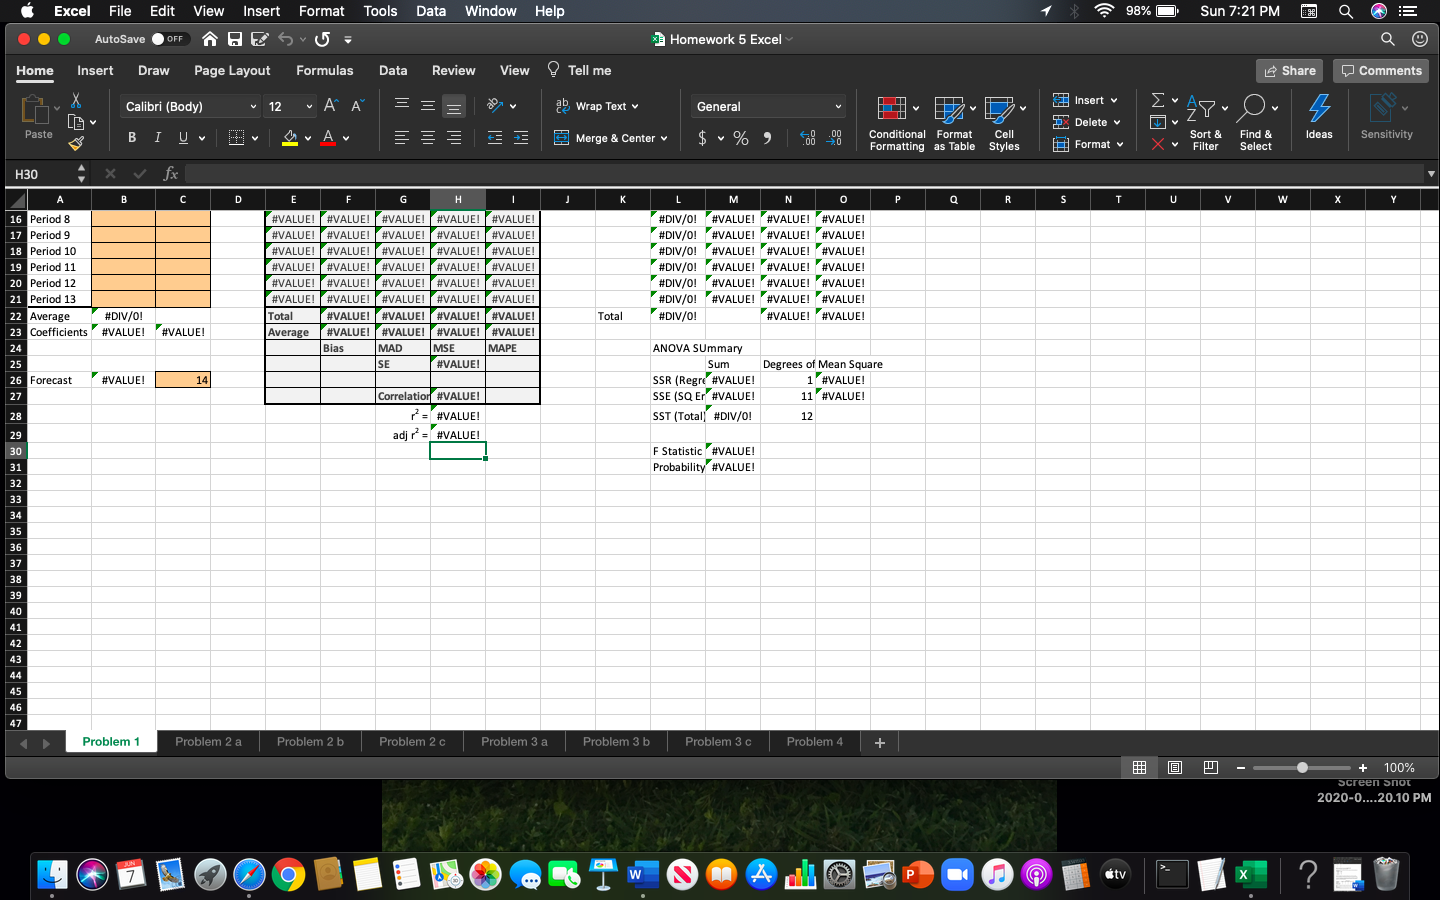
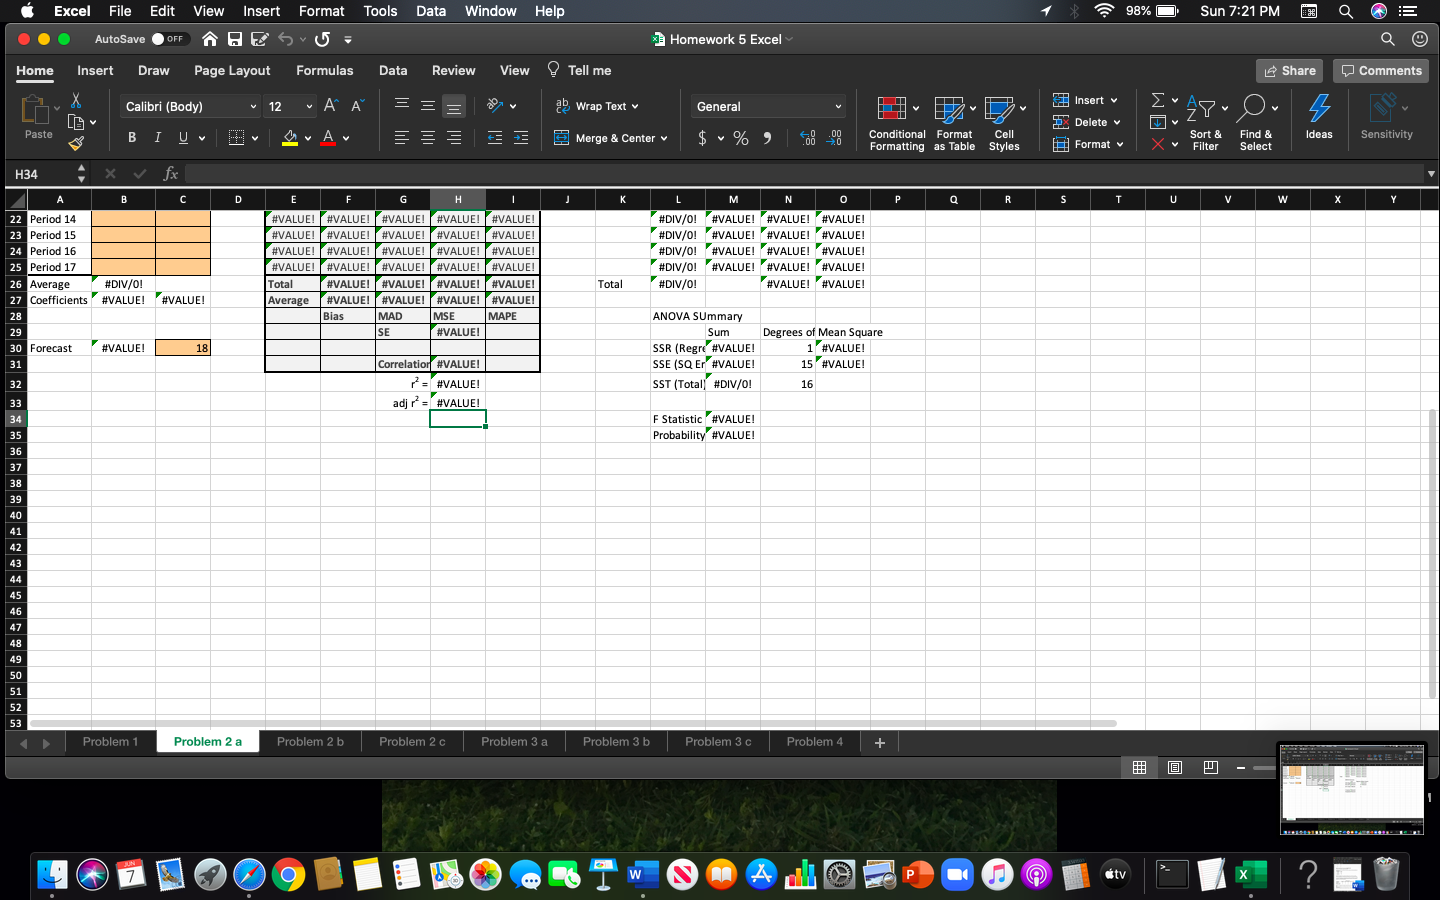
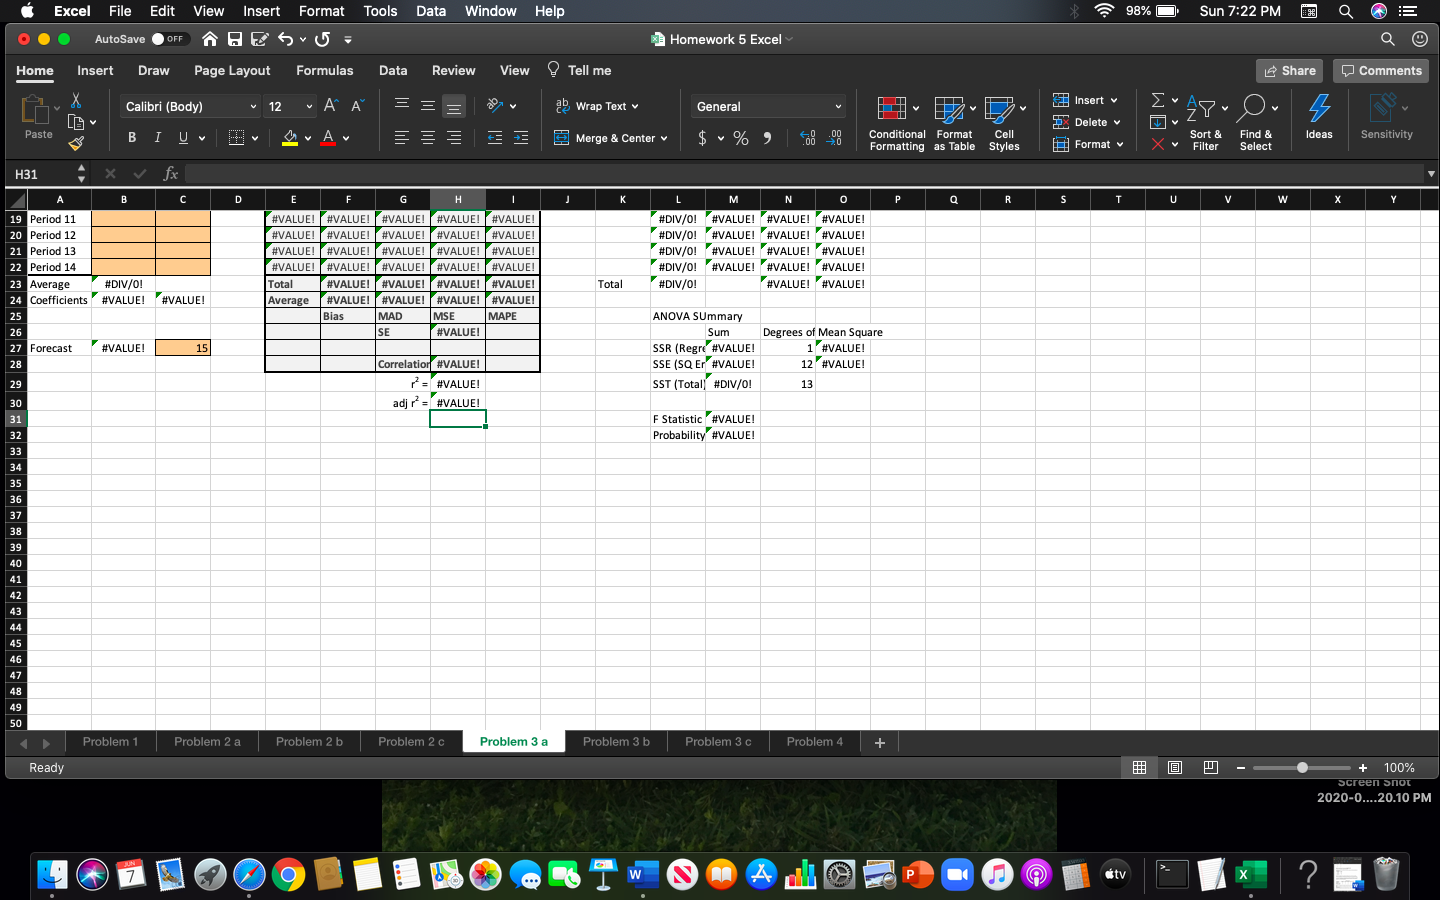
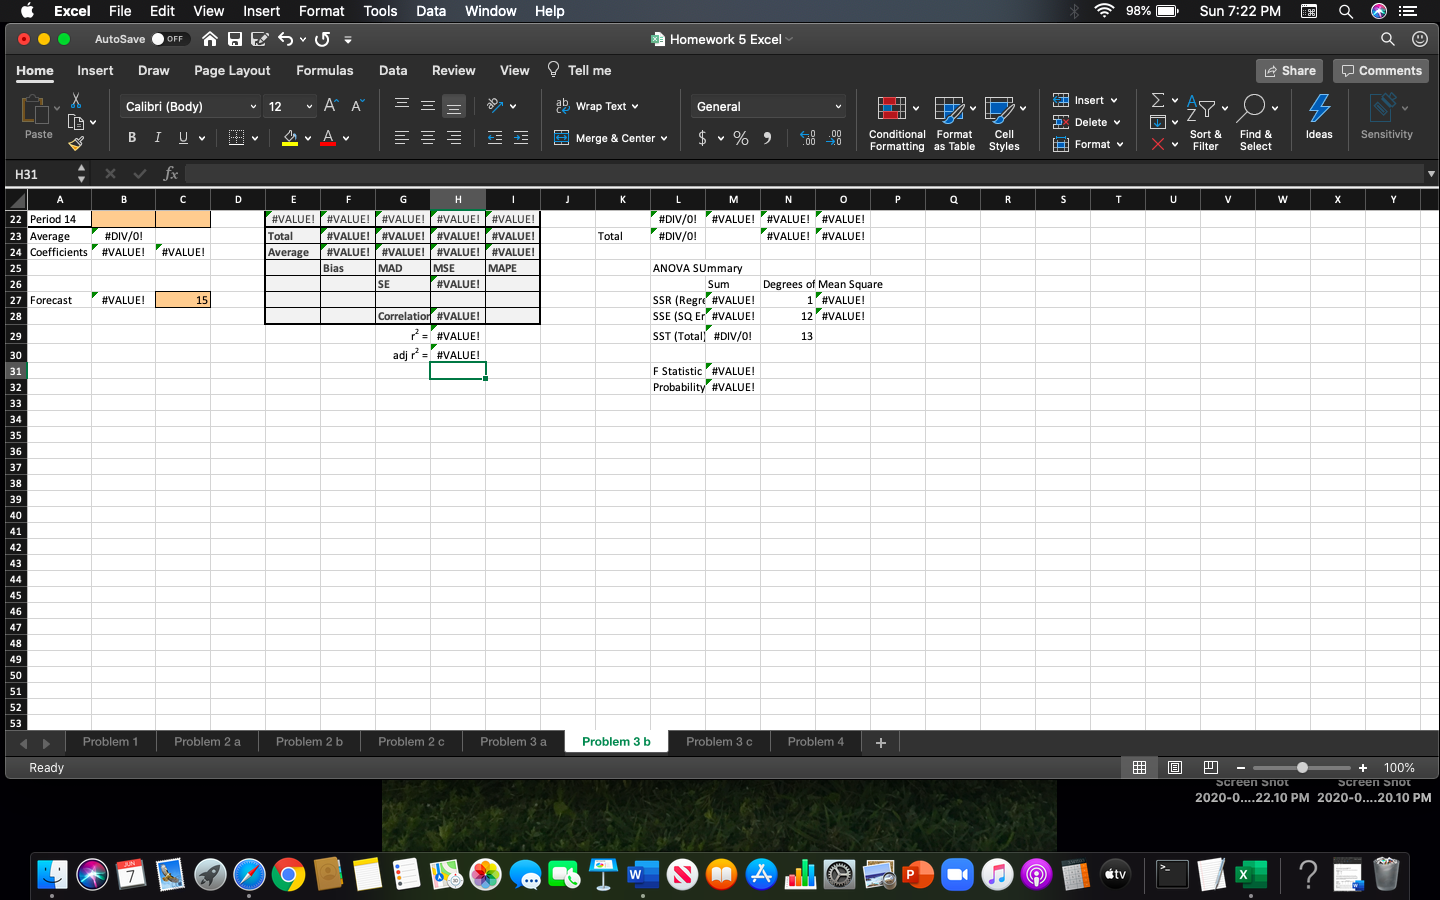
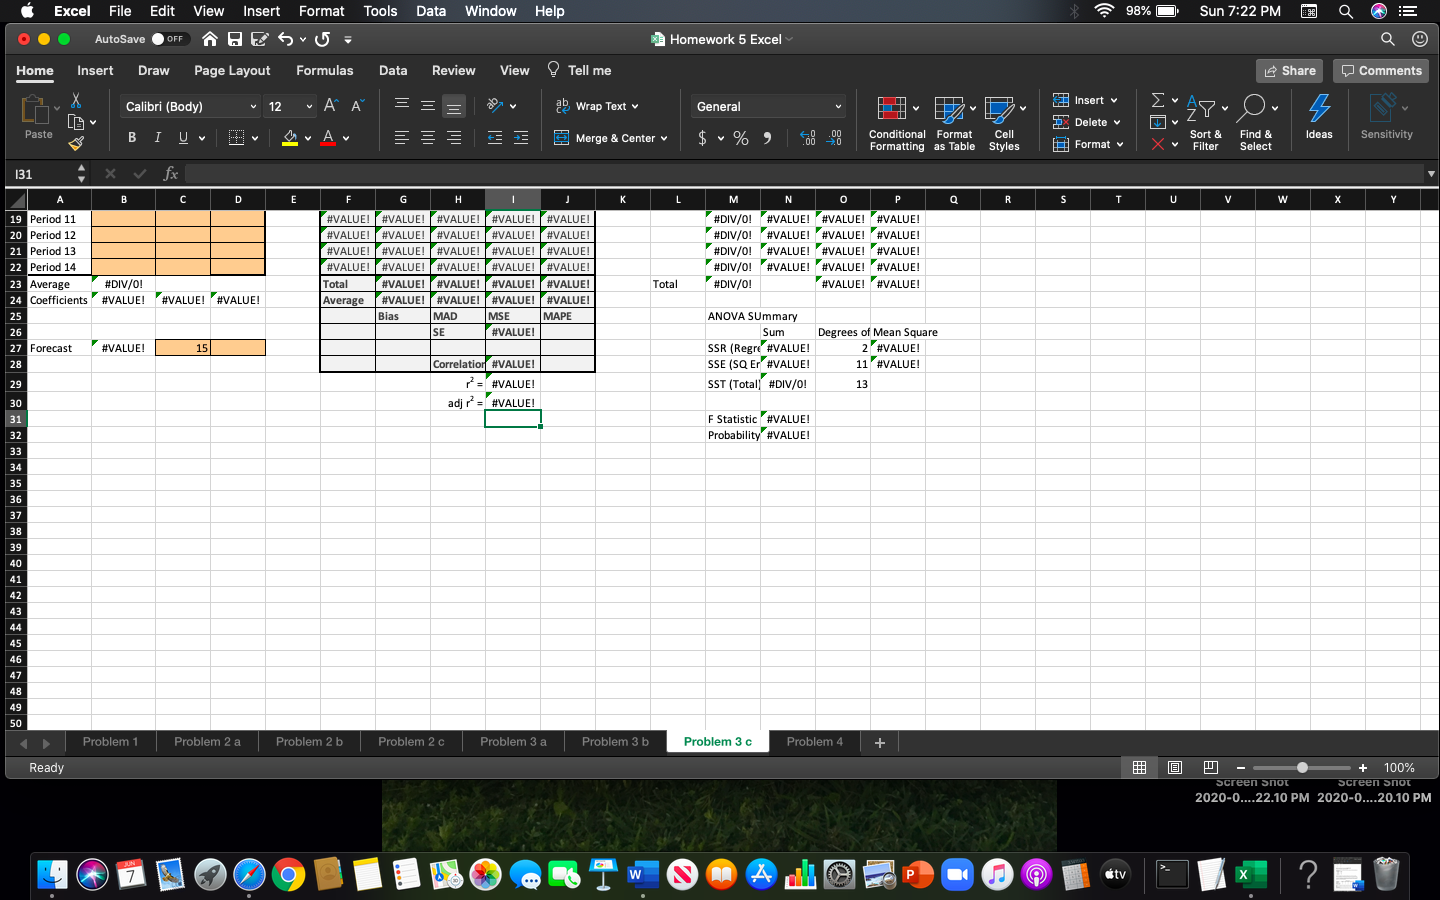
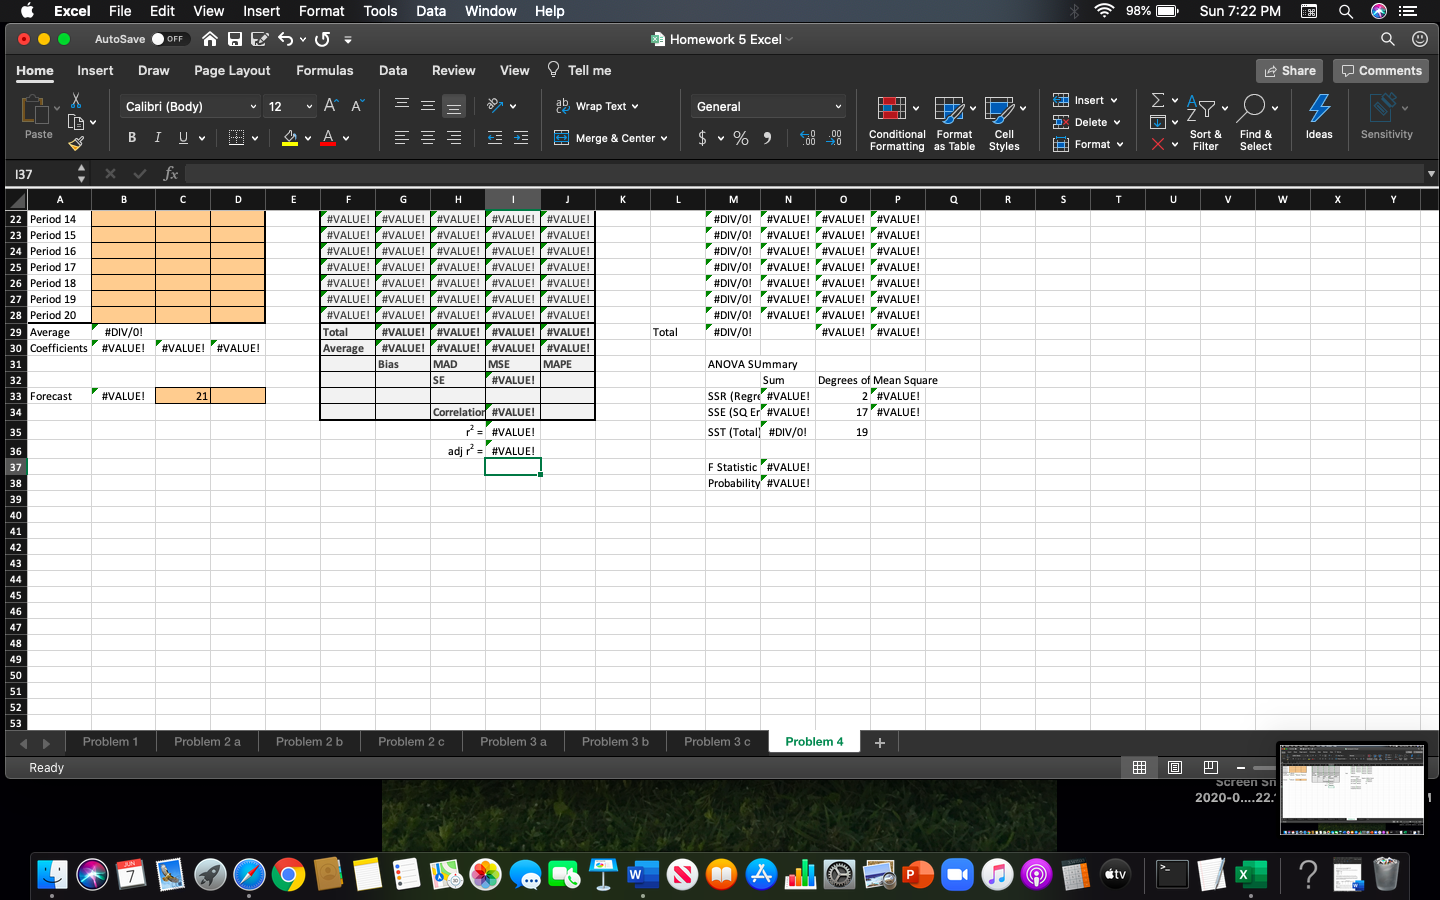
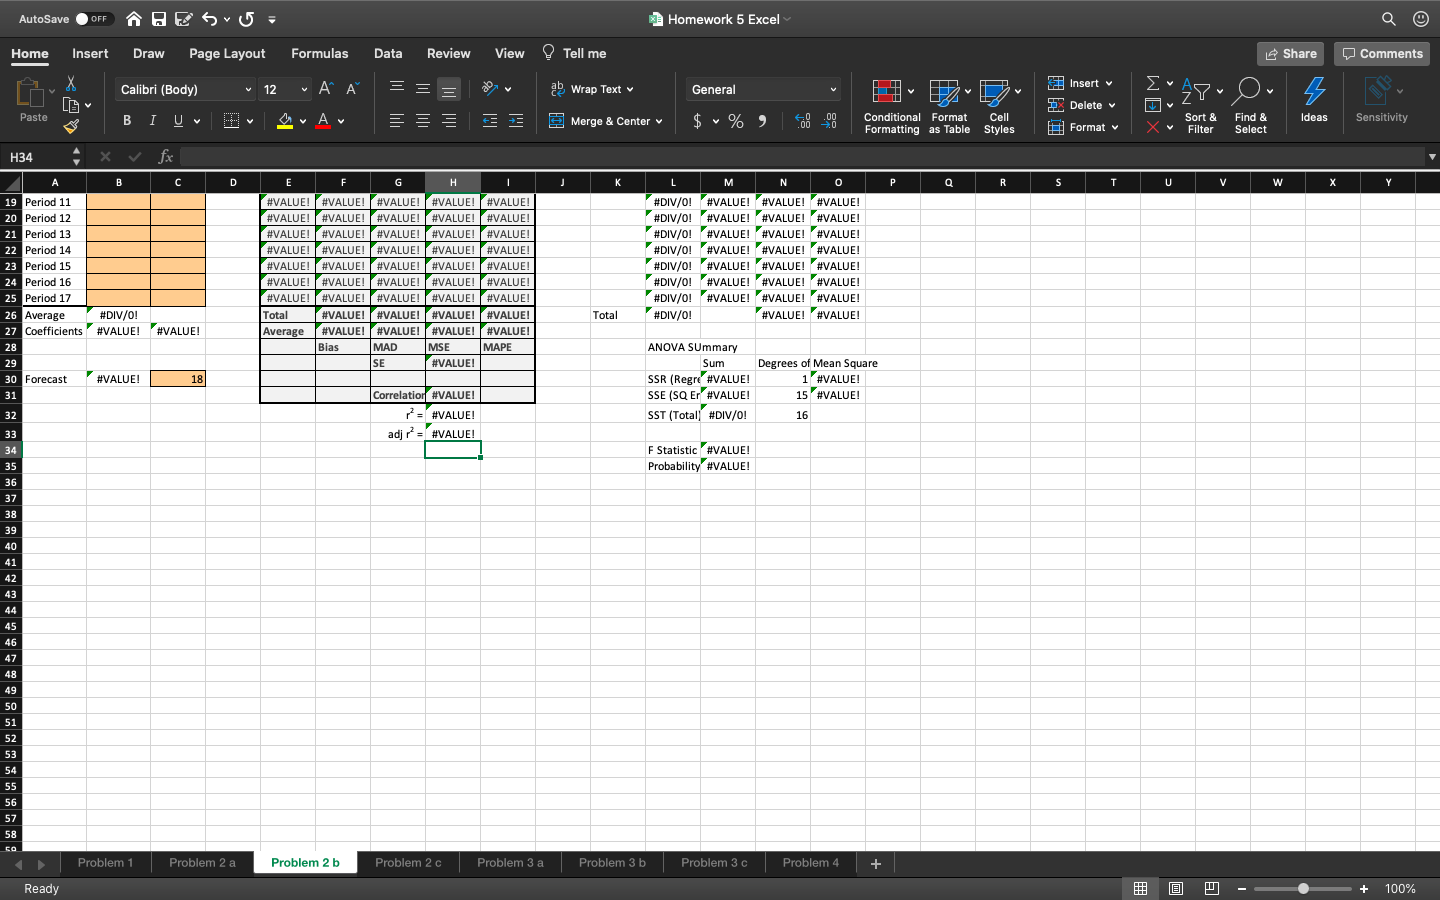
AutoSave . OFF Homework 5 - Saved to my Mac Home Insert Draw Design Layout References Mailings Review View Tell me Share Comments Times New... 12 A Aa v AaBbCcDdEe AaBbCcDdEe AaBbCcD AaBbCcDdE AaBbCcDdE Paste BIU v LV Av AaBb Normal No Spacing Heading 1 Heading 2 Title Subtitle Styles Dictate Pane Sensitivity Homework 5 1) Thirteen student were admitted to the undergraduate business program at Whatsamatta. University 2 years ago. The following table indicates what their grade-point average was after 2 years at the University. Also listed is their SAT score that they scored when they were in high school (maximum score is 2400). Student SAT Score GPA Student GPA A 1263 2.90 SAT Score B 1131 H 1443 2.53 2.93 2187 3.22 D 1755 3.00 207 1503 1.99 3.45 183 1824 3.66 2.75 F 2127 3.90 G 1170 2.88 1098 124 2.15 1.60 a) Using the SAT score to predict their GPA is there a meaningful relationship between the SAT score and their GPA? How do you know? b) If a student has a SAT score of 1200, what do you think their GPA will be in two years? c) If a student has a SAT score of 2400, what do you think their GPA will be in two years? 2) The following data gives the selling price, square footage, number of bedrooms, and the age of a house in years. These houses have been sold in a specific neighborhood over the last six months. Selling Price ($) Square Footage 84,000 Bedrooms Age (years) 1,670 |79,000 30 1,339 91,500 1,712 25 120,00 1,840 30 127,500 3 132,500 2,300 3 40 18 2,234 145,000 2,311 30 164,000 155,000 2,377 3 19 7 2,736 168,000 2,500 10 172,500 174,500 2,500 175,000 2,479 2,400 177,500 184,000 3,124 2,50 195,500 4,062 195,000 2,854 - NOW W - a) Using square footage develop a model to predict the selling price of the house. How well does Page 1 of 3 753 words OF English (United States) the model fit the data? What percentage of the selling price is explained by the model? Focus E + 110%AutoSave . OFF Homework 5 Home Insert Draw Design Layout References Mailings Review View Tell me Share Comments Calibri Ligh... 12 AA Aa v FE AaBbCcDdEe AaBbCcDdEe AaBbCcD AaBbCcDdE AaBbCcDdEe AaBbCcDdEe Paste B I ! v ab X2 v LA v Normal No Spacing Heading 1 Heading 2 Heading 3 Heading 4 Styles Dictate Sensitivity Pane a) Using square footage develop a model to predict the selling price of the house. How well does the model fit the data? What percentage of the selling price is explained by the model? b) Using the number of bedrooms develop a model to predict the selling price of the house. How well does the model fit the data? What percentage of the selling price is explained by the model? c) Using the age of the house develop a model to predict the selling price of the house. How well does the model fit the data? What percentage of the selling price is explained by the model? I) Which of the models estimated in parts a - d best fits the data? Why did you select that model? 3) The total expenses of a hospital is determined by many different factors but two of these factors are the number of beds and the number of patients that are admitted to the hospital. Data + was collected on 14 hospitals and is listed in the table. Hospital Number of beds Admissions (1,000s) Total expenses ($1,000,000 215 77 57 336 160 520 230 127 157 135 43 24 35 14 6 210 155 7 140 53 |93 45 8 90 9 6 6 410 159 99 10 50 18 12 11 12 65 42 16 29 11 13 110 14 28 15 21 305 98 63 a) Develop a model using the number of beds to predict the total expenses of a hospital. How well does the model fit the data? b) Develop a model using the number of admissions to predict the total expenses of a hospital. How well does the model fit the data? c) Develop a model using the number of beds and admissions to predict the total expenses of a Page 2 of 3 753 words English (United States) Focus E + 110%AutoSave . OFF Homework 5 Home Insert Draw Design Layout References Mailings Review View Tell me Share Comments Times New... 12 A Aa v FE AaBbCcDdEe AaBbCcDdEe AaBbCcD AaBbCcDdE AaBbCcDdEe AoBbCcDdEe Paste BIU v LA ~ Normal No Spacing Heading 1 Heading 2 Heading 3 Heading 4 Styles Dictate Sensitivity pane ) Develop a model using the number of beds and admissions to predict the total expenses of a hospital. How well does the model fit the data? d) Do you think that both variables (number of beds and admissions) should be included in our prediction model? Why or Why not? 4) A sample of 20 automobiles was taken and the miles per gallon (MPG), horsepower, and total weight were recorded. Develop a regression model to predict MPG based on weight and + horsepower MPG Horsepower Weight (lbs) 44 67 1,844 44 50 1,99 40 62 1,752 37 96 37 1,980 66 1,797 63 2,199 90 99 2,404 63 2,61 1 91 3,236 2,606 94 8 8 2,580 2,507 124 2,922 97 114 2,43 3,248 21 18 102 2,812 18 114 3,38 142 3,197 16 16 153 4,380 139 4,036 a) Develop a regression model using weight and horsepower to predict the MPG. How well does the data fit the model? b) Let us suppose that your automobile has 83 horsepower and a weight of 2,381 pounds. What is your expected MPG? Page 3 of 3 753 words English (United States) Focus E + 110%Excel File Edit View Insert Format Tools Data Window Help 98% Sun 7:21 PM AutoSave O OFF ~ H E - 5 1 Homework 5 Excel Home Insert Draw Page Layout Formulas Data Review View Tell me Share Comments Calibri (Body) 12 A ab Wrap Text General Insert v E Six Delete v Paste B IUV A FE Merge & Center v % " Conditional Format Cell Ideas X Sort & Find & Sensitivity Formatting as Table Styles Format v Filter Select H30 X V fx A B C D E F G H K M N O P Q R S T U V W X Y 16 Period 8 #VALUE! |#VALUE! |#VALUE! | #VALUE! | #VALUE! #DIV/O! #VALUE! #VALUE! #VALUE! 17 Period 9 #VALUE! #VALUE! |#VALUE! |#VALUE! |#VALUE! #DIV/O! #VALUE! #VALUE! #VALUE! 18 Period 10 #VALUE! |#VALUE! |#VALUE! |#VALUE! |#VALUE! #DIV/O! #VALUE! #VALUE! #VALUE! 19 Period 11 #VALUE! #VALUE! |#VALUE! |#VALUE! |#VALUE! #DIV/O! #VALUE! #VALUE! #VALUE! 20 Period 12 #VALUE! |#VALUE!|#VALUE! |#VALUE! |#VALUE! #DIV/O! "#VALUE! #VALUE! #VALUE! 21 Period 13 #VALUE! | #VALUE! |#VALUE! |#VALUE! |#VALUE! #DIV/O! #VALUE! #VALUE! #VALUE! 22 Average #DIV/O! Tota #VALUE! |#VALUE! #VALUE! #VALUE! Total #DIV/O! #VALUE! #VALUE! 23 Coefficients #VALUE! #VALUE! Average #VALUE! |#VALUE! |#VALUE! |#VALUE! 24 Bias MAD I MSE MAPE ANOVA SUmmary 25 #VALUE! Sum Degrees of Mean Square 26 #VALUE! 14 SSR (Regre #VALUE 1 #VALUE 27 Correlation #VALUE! SSE (SQ Er #VALUE! 11 #VALUE! 28 2 = #VALUE! SST (Total] #DIV/O! 12 29 adj r? = #VALUE! 30 F Statistic #VALUE! Probability #VALUE! Problem 1 Problem 2 a Problem 2 b Problem 2 c Problem 3 a Problem 3 b Problem 3 c Problem 4 + + Screen snot 2020-0....20.10 PM 7 O w A P XExcel File Edit View Insert Format Tools Data Window Help 98% Sun 7:21 PM AutoSave O OFF ~ H E - 5 1 Homework 5 Excel Home Insert Draw Page Layout Formulas Data Review View Tell me Share Comments Calibri (Body) 12 A ab Wrap Text General Insert v E Six Delete v Paste B IUV A FE Merge & Center v v % " Conditional Format Cell Formatting as Table Styles Format v Ideas X Sort & Find & Sensitivity Filter Select H34 X V fx B C D E F G H K M N O P Q R S T U V W X Y 22 Period 14 #VALUE! |#VALUE! |#VALUE! | #VALUE! |#VALUE! #DIV/O! #VALUE! #VALUE! #VALUE! 23 Period 15 #VALUE! #VALUE! |#VALUE! |#VALUE! |#VALUE! #DIV/O! #VALUE! #VALUE! #VALUE! 24 Period 16 #VALUE! |#VALUE! |#VALUE! |#VALUE! |#VALUE! #DIV/O! #VALUE! #VALUE! #VALUE! 25 #VALUE! |#VALUE! |#VALUE! |#VALUE! |#VALUE! #DIV/O! #VALUE! #VALUE! #VALUE! 26 #DIV/0! Total #VALUE! | #VALUE! | #VALUE! | #VALUE! Total #DIV/O! #VALUE! #VALUE! 27 Coefficients |#VALUE! #VALUE! Average #VALUE!|#VALUE! | #VALUE! | #VALUE! 28 Bias MAD MSE MAPE ANOVA SUmmary 29 SE #VALUE! Sum Degrees of Mean Square 30 #VALUE! 18 SSR (Regre #VALUE! 1 #VALUE! 31 Correlation #VALUE! SSE (SQ Er #VALUE! 15 #VALUE! 32 2 = #VALUE! SST (Total] #DIV/0! 16 33 adj r = #VALUE! 34 F Statistic #VALUE! 35 Probability #VALUE! Problem 1 Problem 2 a Problem 2 b Problem 2 c Problem 3 a Problem 3 b Problem 3 c Problem 4 + 7 O w A PExcel File Edit View Insert Format Tools Data Window Help 98% Sun 7:22 PM : AutoSave O OFF ~ H E - 0 . Homework 5 Excel Home Insert Draw Page Layout Formulas Data Review View Tell me Share Comments Calibri (Body) 12 A ab Wrap Text General Insert E Six Delete v 27- O. Paste B IUV A FE Merge & Center v v % " Conditional Format Cell Sort & Find & Ideas Sensitivity Formatting as Table Styles Format v X Filter Select H31 X V fx A B C D E F G H K M N O P Q R S T U V W X Y 19 Period 11 #VALUE! |#VALUE! |#VALUE! | #VALUE! |#VALUE! #DIV/O! #VALUE! #VALUE! #VALUE! 20 Period 12 #VALUE! #VALUE! |#VALUE! |#VALUE! |#VALUE! #DIV/O! #VALUE! #VALUE! #VALUE! 21 Period 13 #VALUE! |#VALUE! |#VALUE! |#VALUE! |#VALUE! #DIV/O! #VALUE! #VALUE! #VALUE! 22 Period 14 #VALUE! #VALUE! |#VALUE! |#VALUE! |#VALUE! #DIV/O! #VALUE! #VALUE! #VALUE! 23 Average #DIV/0! Total #VALUE! | #VALUE! | #VALUE! | #VALUE! Total #DIV/O! #VALUE! #VALUE! 24 Coefficients #VALUE! #VALUE! Average #VALUE!|#VALUE! | #VALUE! | #VALUE! 25 Bias MAD MSE MAPE ANOVA SUmmary 26 SE #VALUE! Sum Degrees of Mean Square 27 #VALUE! 15 SSR (Regre #VALUE! 1 #VALUE! 28 Correlation #VALUE! SSE (SQ Er #VALUE! 12 #VALUE! 29 2 = #VALUE! SST (Total] #DIV/0! 13 30 adj r = #VALUE! 31 F Statistic #VALUE! 32 Probability #VALUE! Problem 1 Problem 2 a Problem 2 b Problem 2 c Problem 3 a Problem 3 b Problem 3 c Problem 4 + Ready + Screen snot 2020-0....20.10 PM 7 O w A P XExcel File Edit View Insert Format Tools Data Window Help 98% Sun 7:22 PM 83 AutoSave O OFF ~ H E - 0 . Homework 5 Excel Home Insert Draw Page Layout Formulas Data Review View Tell me Share Comments Calibri (Body) 12 A ab Wrap Text General Insert E Six Delete v Paste B IUV A EE Merge & Center v v % " Conditional Format Cell Format v Sort & Find & Ideas X Sensitivity Formatting as Table Styles Filter Select H31 X V fx A B C D E F G H K M N O P Q R S T U V W X Y 22 Period 14 #VALUE! | #VALUE! | #VALUE! | #VALUE! | #VALUE! #DIV/O! #VALUE! #VALUE! #VALUE! 23 #DIV/O! Total #VALUE! |#VALUE! |#VALUE! |#VALUE! Total #DIV/O! #VALUE! #VALUE! 24 Coefficients |#VALUE! #VALUE! Average #VALUE!|#VALUE! | #VALUE! | #VALUE! 25 Bias MAD MSE MAPE ANOVA SUmmary 26 SE #VALUE! Sum Degrees of Mean Square 27 #VALUE! 15 SSR (Regre #VALUE 1 #VALUE! 28 Correlation #VALUE! SSE (SQ Er #VALUE! 12 #VALUE! 29 2 =#VALUE! SST (Total] #DIV/O! 13 30 adj r = #VALUE! 31 F Statistic #VALUE! 32 Probability #VALUE! D Problem 1 Problem 2 a Problem 2 b Problem 2 c Problem 3 a Problem 3 b Problem 3 c Problem 4 + Ready + Screen Snot Screen snot 2020-0....22.10 PM 2020-0....20.10 PM 7 O w A PExcel File Edit View Insert Format Tools Data Window Help 98% Sun 7:22 PM 98 AutoSave O OFF ~ H E - 0 . Homework 5 Excel Home Insert Draw Page Layout Formulas Data Review View Tell me Share Comments Calibri (Body) 12 A ab Wrap Text General Insert v E Fix Delete v Paste B IUV A EE Merge & Center v v % " Conditional Format Cell Format v X Sort & Find & Ideas Sensitivity Formatting as Table Styles Filter Select 131 X V fx A B C D E F G H K M N O P Q R S T U V W X Y 19 Period 11 #VALUE! |#VALUE! | #VALUE! |#VALUE! |#VALUE! #DIV/O! #VALUE! #VALUE! #VALUE! 20 Period 12 #VALUE! |#VALUE! |#VALUE! |#VALUE!|#VALUE! #DIV/O! #VALUE! #VALUE! #VALUE! 21 Period 13 #VALUE!|#VALUE!|#VALUE! |#VALUE! | #VALUE! #DIV/O! #VALUE! #VALUE! #VALUE! 22 Period 14 #VALUE! |#VALUE! |#VALUE! |#VALUE! #VALUE! #DIV/O! #VALUE! #VALUE! #VALUE! 23 Average #DIV/O! Total #VALUE! | #VALUE!|#VALUE! |#VALUE! Total #DIV/O! #VALUE! #VALUE! 24 Coefficients |#VALUE! #VALUE! #VALUE! Average #VALUE! | #VALUE! | #VALUE! | #VALUE! 25 Bias MAD MSE MAPE ANOVA SUmmary 26 SE #VALUE! Sum Degrees of Mean Square 27 #VALUE! 15 SSR (Regre #VALUE 2 #VALUE! 28 Correlation #VALUE! SSE (SQ Er #VALUE! 11 #VALUE! 29 2= #VALUE! SST (Total] #DIV/O! 13 30 adj r = #VALUE! 31 F Statistic #VALUE! 32 Probability #VALUE! Problem 1 Problem 2 a Problem 2 b Problem 2 c Problem 3 a Problem 3 b Problem 3 c Problem 4 + Ready + Screen Snot Screen snot 2020-0....22.10 PM 2020-0....20.10 PM 7 O w A PExcel File Edit View Insert Format Tools Data Window Help 98% Sun 7:22 PM 98 AutoSave O OFF ~ H E - 5 - Homework 5 Excel Home Insert Draw Page Layout Formulas Data Review View Tell me Share Comments Calibri (Body) 12 A ab Wrap Text General Insert v E Fix Delete v Paste B IUV A EE Merge & Center v v % " Conditional Format Cell Format v X Sort & Find & Ideas Sensitivity Formatting as Table Styles Filter Select 13 X V fx A B C D E F G H K M N O P Q R S T U V W X Y 22 Period 14 #VALUE! |#VALUE! |#VALUE! |#VALUE! |#VALUE! #DIV/O! #VALUE! #VALUE! #VALUE! 23 Period 15 #VALUE! |#VALUE! |#VALUE! |#VALUE! |#VALUE! #DIV/O! #VALUE! #VALUE! #VALUE! 24 Period 16 #VALUE!|#VALUE! |#VALUE! |#VALUE! |#VALUE! #DIV/O! "#VALUE! #VALUE! #VALUE! 25 Period 17 #VALUE! |#VALUE! |#VALUE! |#VALUE! |#VALUE! #DIV/O! #VALUE! #VALUE! #VALUE! 26 Period 18 #VALUE! |#VALUE! |#VALUE! |#VALUE! |#VALUE! #DIV/O! #VALUE! #VALUE! #VALUE! 27 Period 19 #VALUE! |#VALUE! | #VALUE! | #VALUE! |#VALUE! #DIV/O! #VALUE! #VALUE! #VALUE! 28 #VALUE! |#VALUE! |#VALUE! |#VALUE! |#VALUE! #DIV/O! #VALUE! #VALUE! #VALUE! 29 Average #DIV/O! Total #VALUE! | #VALUE! |#VALUE! |#VALUE! Total #DIV/O! #VALUE! #VALUE! 30 Coefficients #VALUE! #VALUE! #VALUE! Average #VALUE! | #VALUE! | #VALUE! | #VALUE! 31 Bias MAD MSE MAPE ANOVA SUmmary 32 SE #VALUE! Sum Degrees of Mean Square 33 #VALUE! 21 SSR (Regre #VALUE! 2 #VALUE! 34 Correlation #VALUE! SSE (SQ Er #VALUE 17 #VALUE! 35 2 = #VALUE! SST (Total] #DIV/O! 19 36 adj r = #VALUE! F Statistic |#VALUE! Probability #VALUE! D Problem 1 Problem 2 a Problem 2 b Problem 2 c Problem 3 a Problem 3 b Problem 3 c Problem 4 + Ready Screen Sn 2020-0....22.' 7 O w A PAutoSave . OFF Homework 5 Excel Home Insert Draw Page Layout Formulas Data Review View Tell me Share Comments Calibri (Body) 12 A B Wrap Text v General Insert v Paste Delete BIUV A Merge & Center v v % " Conditional Format Cell Formatting as Table Styles Format v X v Sort & Find & Ideas Sensitivity Filter select H34 X V fx C D M P R U W 19 Period 11 #VALUE! |#VALUE! |#VALUE! |#VALUE! |#VALUE! #DIV/O! #VALUE! #VALUE! #VALUE! 20 Period 12 #VALUE! |#VALUE!|#VALUE! |#VALUE! |#VALUE! 21 Period 13 #VALUE! |#VALUE! |#VALUE! |#VALUE! |#VALUE! #DIV/O! #VALUE! #VALUE! #VALUE! #DIV/O! #VALUE! #VALUE! #VALUE! 22 Period 14 #VALUE! |#VALUE! |#VALUE! |#VALUE! |#VALUE! #DIV/O! #VALUE! #VALUE! #VALUE! Period 15 #VALUE! |#VALUE! |#VALUE! |#VALUE! | #VALUE! #VALUE! |#VALUE! |#VALUE! |#VALUE! |#VALUE! #DIV/O! #VALUE! #VALUE! #VALUE! 24 Period 16 #DIV/O! #VALUE! #VALUE! #VALUE! 25 Period 17 #VALUE! |#VALUE! | #VALUE! |#VALUE! |#VALUE! #DIV/O! #VALUE! #VALUE! #VALUE! 26 Average #DIV/O! Total #VALUE! |#VALUE! #VALUE! |#VALUE! Total #DIV/O! 27 Coefficients |#VALUE! #VALUE! #VALUE! #VALUE! Average #VALUE! | #VALUE! | #VALUE! | #VALUE! MAD MSE MAPE ANOVA SUmmary SE #VALUE! Sum Degrees of Mean Square 30 Forecast #VALUE! 18 SSR (Regre #VALUE! 1 #VALUE! 31 Correlation #VALUE! SSE (SQ Er #VALUE! 15 #VALUE! 2 = #VALUE! SST (Total] #DIV/O! 16 adj r? = #VALUE! F Statistic #VALUE! Probability #VALUE! Problem 1 Problem 2 a Problem 2 b Problem 2 c Problem 3 a Problem 3 b Problem 3 c Problem 4 + Ready + 100%AutoSave . OFF Homework 5 Excel Home Insert Draw Page Layout Formulas Data Review View Tell me Share Comments Calibri (Body) 12 AA B Wrap Text v General Insert v Paste A Delete BIUV = E Merge & Center v v % " Conditional Format Cell Sort & Find & Ideas Sensitivity Formatting as Table Styles Format v X v Filter select H34 X V fx # C D E F G H K M 0 P R U W 28 Bias MAD MSE MAPE 29 ANOVA SUmmary SE #VALUE! Sum Degrees of Mean Square 30 Forecast #VALUE! 18 SSR (Regre #VALUE! 1 #VALUE! Correlation #VALUE! SSE (SQ Er #VALUE! 15 #VALUE! 32 2 = #VALUE! SST (Total] #DIV/O! 16 33 adj r? = #VALUE! # F Statistic #VALUE! Probability #VALUE! 9 8 Problem 1 Problem 2 a Problem 2 b Problem 2 c Problem 3 a Problem 3 b Problem 3 c Problem 4 + Ready + 100%
