

Answered step by step
Verified Expert Solution
Question
1 Approved Answer
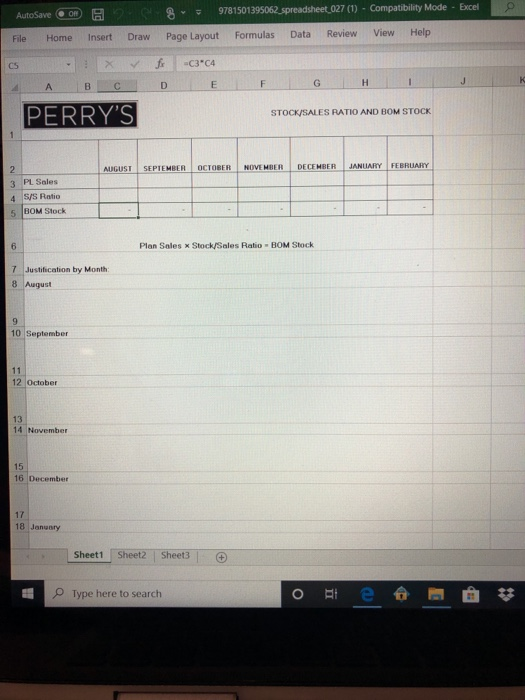
AutoSave OR pg 8 9781501395062 spreadsheet_027 (1) - Compatibility Mode - Excel Home Insert File Draw Formulas View Page Layout Data Review Help CS f
Step by Step Solution
There are 3 Steps involved in it
Step: 1

Get Instant Access to Expert-Tailored Solutions
See step-by-step solutions with expert insights and AI powered tools for academic success
Step: 2

Step: 3
Ace Your Homework with AI
Get the answers you need in no time with our AI-driven, step-by-step assistance
Get Started
Financial Accounting The Impact On Decision Makers
Authors: Curtis L. Norton, Gary A. Porter
6th Edition
9781439037119, 1439037116