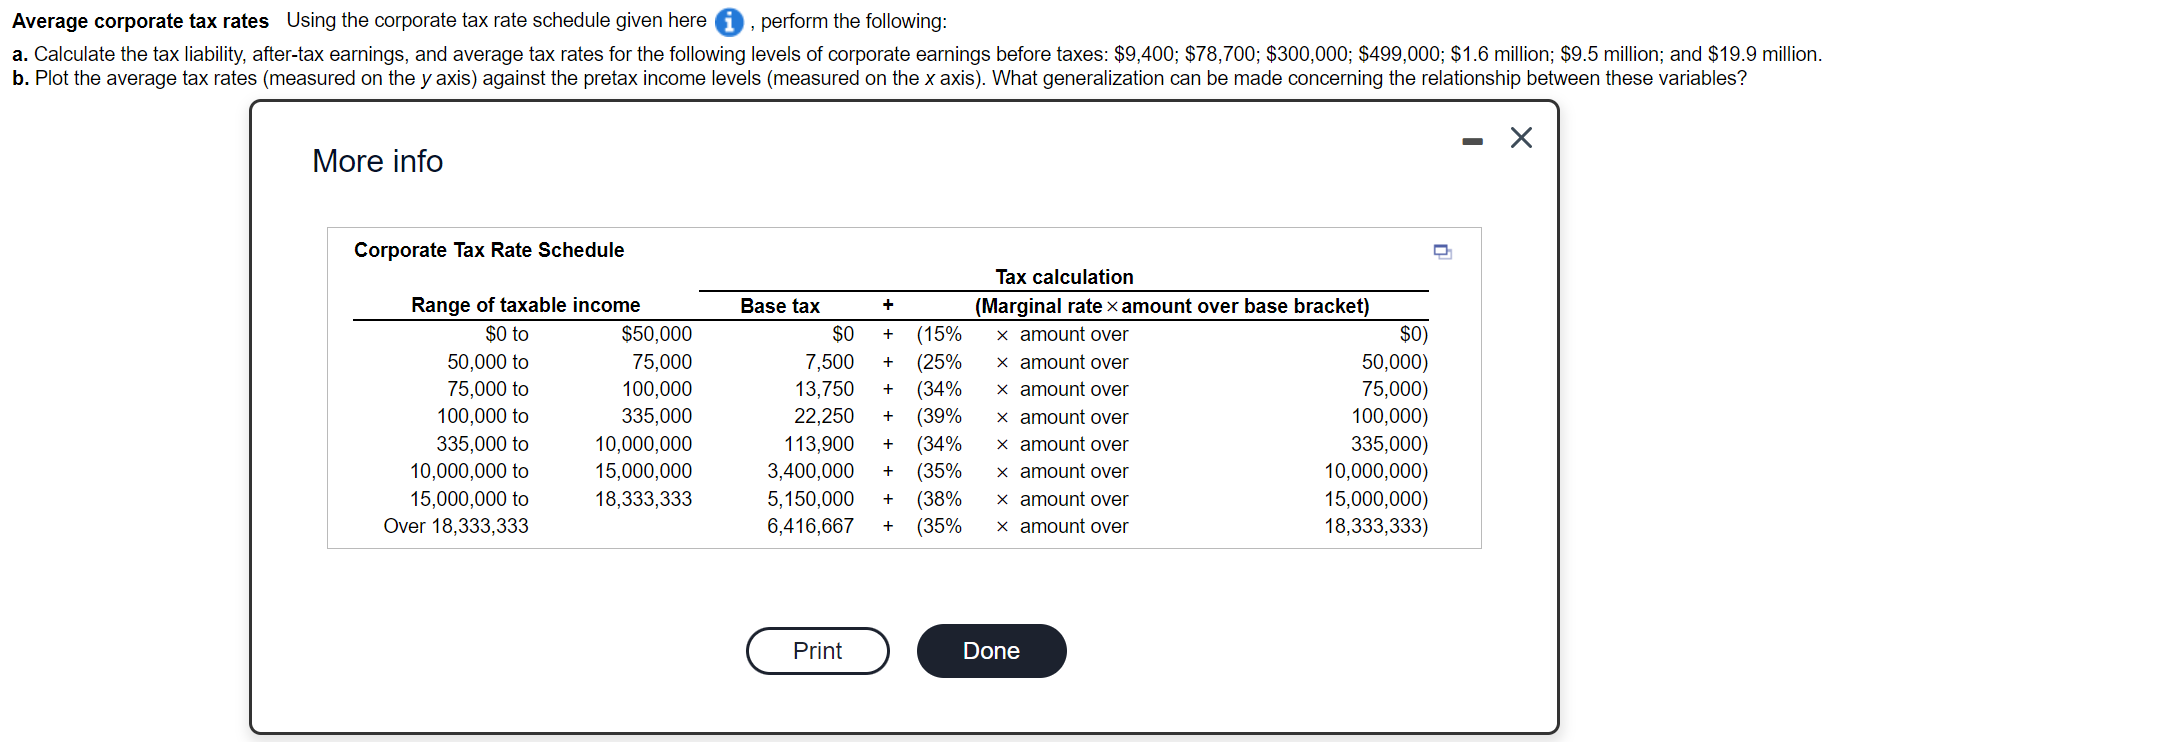
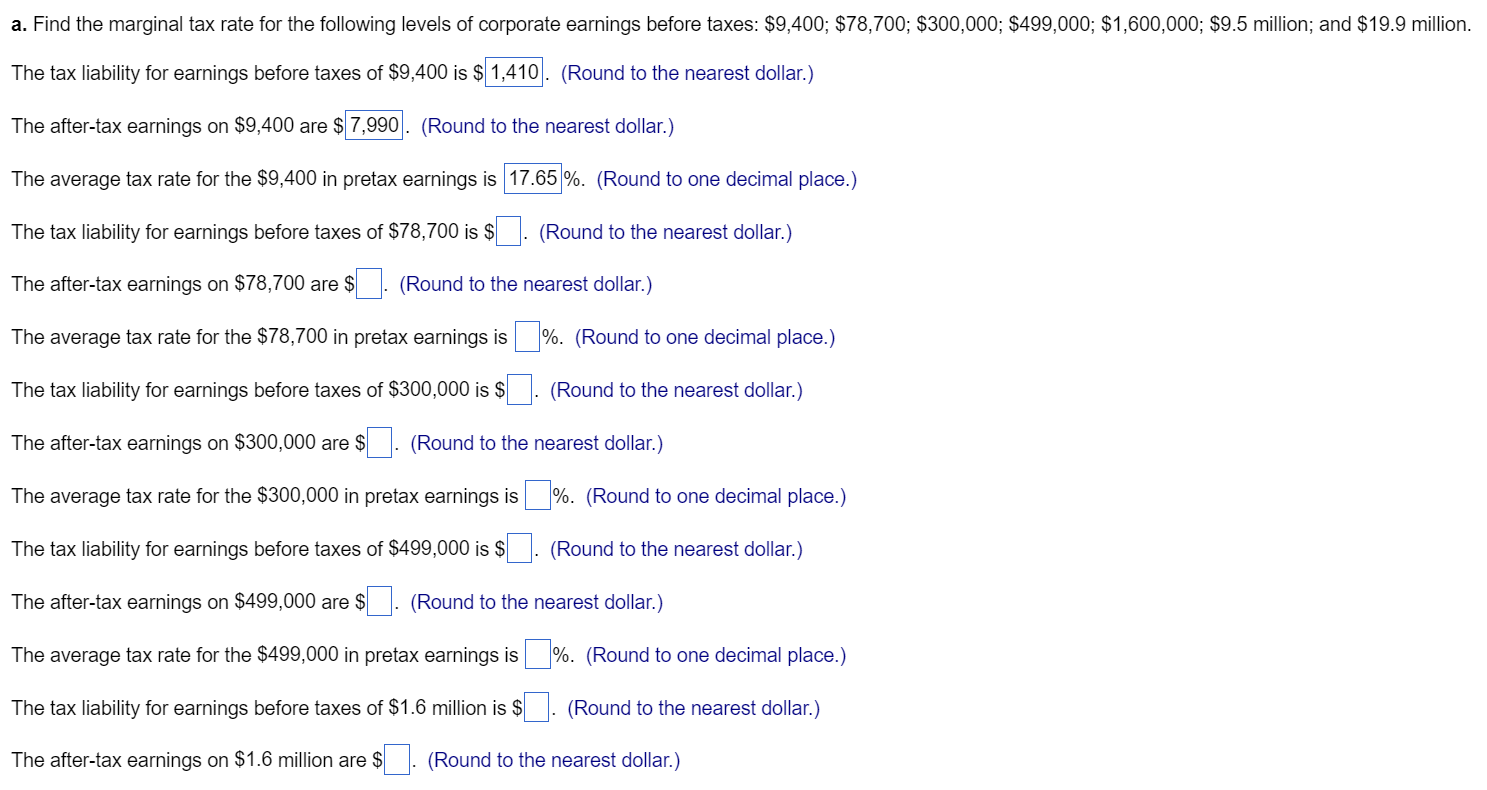
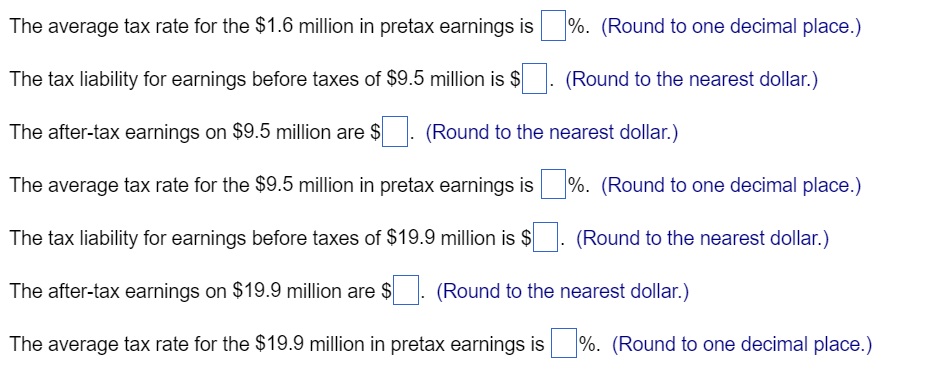
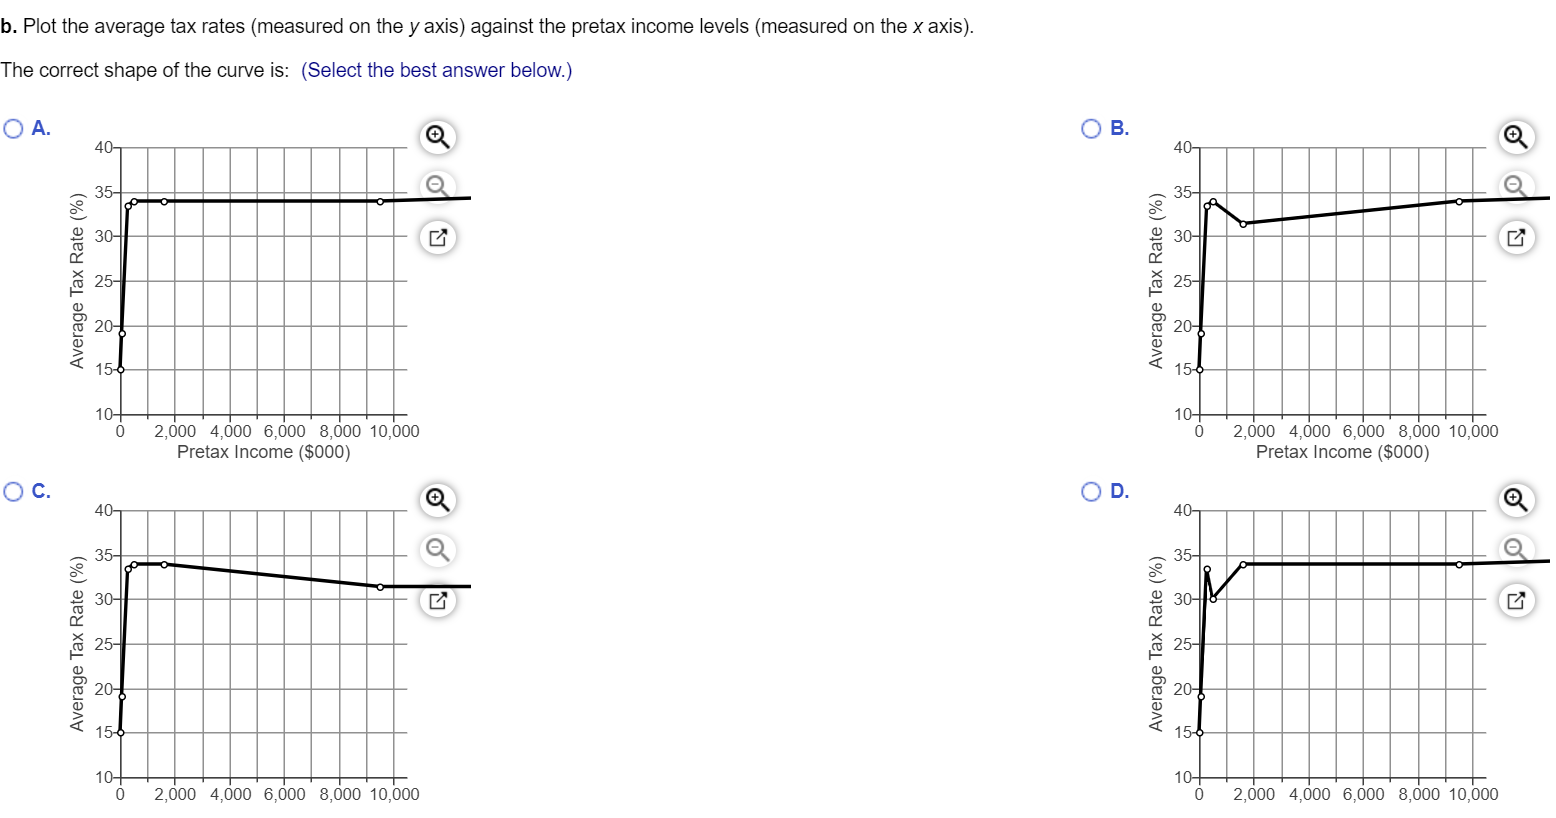

Average corporate tax rates Using the corporate tax rate schedule given here , perform the following: a. Calculate the tax liability, after-tax earnings, and average tax rates for the following levels of corporate earnings before taxes: $9,400; $78,700; $300,000; $499,000; $1.6 million; $9.5 million; and $19.9 million. b. Plot the average tax rates (measured on the y axis) against the pretax income levels (measured on the x axis). What generalization can be made concerning the relationship between these variables? y - More info Corporate Tax Rate Schedule + + M + Range of taxable income $0 to $50,000 50,000 to 75,000 75,000 to 100,000 100,000 to 335,000 335,000 to 10,000,000 10,000,000 to 15,000,000 15,000,000 to 18,333,333 Over 18,333,333 + Base tax $0 7,500 13,750 22,250 113,900 3,400,000 5,150,000 6,416,667 (15% (25% (34% (39% (34% (35% (38% (35% Tax calculation (Marginal rate x amount over base bracket) x amount over $0) x amount over 50,000) x amount over 75,000) x amount over 100,000) x amount over 335,000) x amount over 10,000,000) x amount over 15,000,000) x amount over 18,333,333) + + + + + Print Done a. Find the marginal tax rate for the following levels of corporate earnings before taxes: $9,400; $78,700; $300,000; $499,000; $1,600,000; $9.5 million; and $19.9 million. The tax liability for earnings before taxes of $9,400 is $ 1,410. (Round to the nearest dollar.) The after-tax earnings on $9,400 are $ 7,990. (Round to the nearest dollar.) The average tax rate for the $9,400 in pretax earnings is 17.65 %. (Round to one decimal place.) The tax liability for earnings before taxes of $78,700 is $ - (Round to the nearest dollar.) The after-tax earnings on $78,700 are $. (Round to the nearest dollar.) The average tax rate for the $78,700 in pretax earnings is %. (Round to one decimal place.) The tax liability for earnings before taxes of $300,000 is $ (Round to the nearest dollar.) The after-tax earnings on $300,000 are $ (Round to the nearest dollar.) The average tax rate for the $300,000 in pretax earnings is %. (Round to one decimal place.) The tax liability for earnings before taxes of $499,000 is $ (Round to the nearest dollar.) The after-tax earnings on $499,000 are $ (Round to the nearest dollar.) The average tax rate for the $499,000 in pretax earnings is %. (Round to one decimal place.) The tax liability for earnings before taxes of $1.6 million is $ (Round to the nearest dollar.) The after-tax earnings on $1.6 million are $ (Round to the nearest dollar.) The average tax rate for the $1.6 million in pretax earnings is %. (Round to one decimal place.) The tax liability for earnings before taxes of $9.5 million is $ (Round to the nearest dollar.) The after-tax earnings on $9.5 million are $ (Round to the nearest dollar.) The average tax rate for the $9.5 million in pretax earnings is %. (Round to one decimal place.) The tax liability for earnings before taxes of $19.9 million is $ (Round to the nearest dollar.) The after-tax earnings on $19.9 million are $. (Round to the nearest dollar.) ( The average tax rate for the $19.9 million in pretax earnings is %. (Round to one decimal place.) $ b. Plot the average tax rates (measured on the y axis) against the pretax income levels (measured on the x axis). The correct shape of the curve is: (Select the best answer below.) OA. B. 40- 40- 35- 35- 30- 30- Average Tax Rate (%) 25- Average Tax Rate (%) 25- 20-1 20-1 10- 0 10- 0 2,000 4,000 6,000 8,000 10,000 Pretax Income ($000) 2,000 4,000 6,000 8,000 10,000 Pretax Income ($000) Oc. OD. 40- 40- 35- 35- 30-4 30 0- Average Tax Rate (%) 25- Average Tax Rate (%) 25- 20- 20-4 15-6 15-6 10- 0 2,000 4,000 6,000 8,000 10,000 10- 0 2,000 4,000 6,000 8,000 10,000 What generalization can be made concerning the relationship between these variables? (Select from the drop-down menu.) This chart demonstrates the "progressive" nature of the U.S. tax code in that income tax rates increase dramatically as the level of income rises. The top corporate average tax rate is