

Answered step by step
Verified Expert Solution
Question
1 Approved Answer
Average Rate of Change of a Function 1. [-12 Points] DETAILS SPRECALC7 2.4.009. Y NOTES ASK YOUR TEACHER PRACTICE ANOTHER The graph of a function
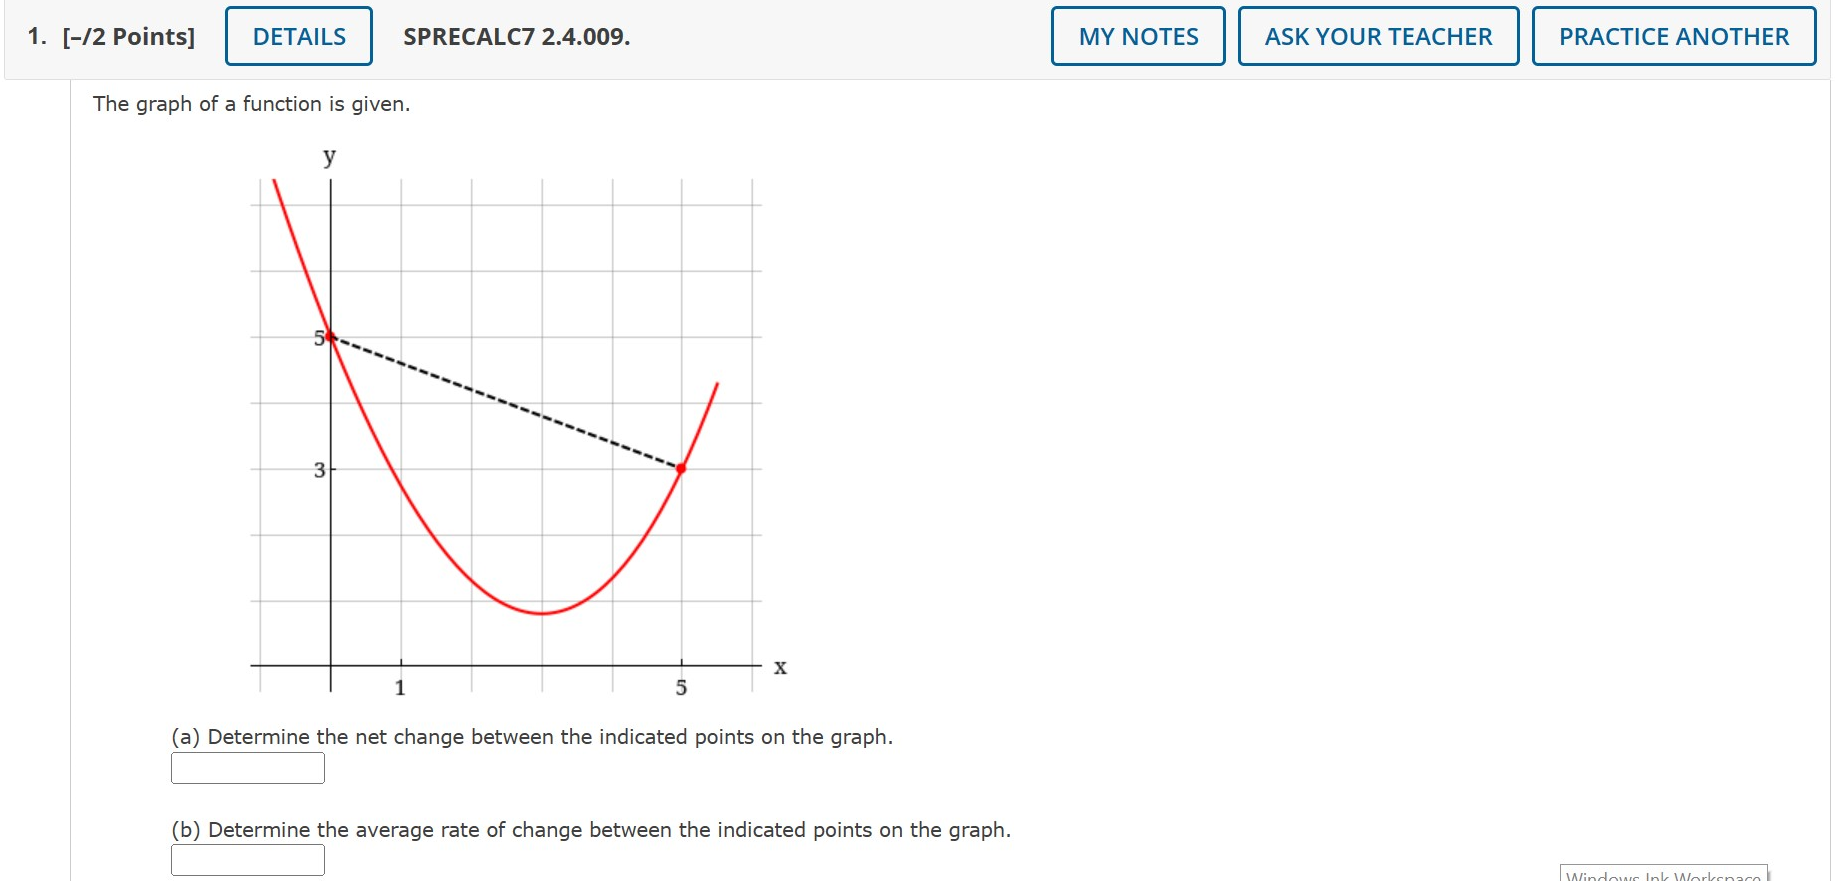


Average Rate of Change of a Function


Step by Step Solution
There are 3 Steps involved in it
Step: 1

Get Instant Access to Expert-Tailored Solutions
See step-by-step solutions with expert insights and AI powered tools for academic success
Step: 2

Step: 3
Ace Your Homework with AI
Get the answers you need in no time with our AI-driven, step-by-step assistance
Get Started
Precalculus Enhanced With Graphing Utilities
Authors: Michael Sullivan
5th Edition
0321830822, 9780321830821