Answered step by step
Verified Expert Solution
Question
1 Approved Answer
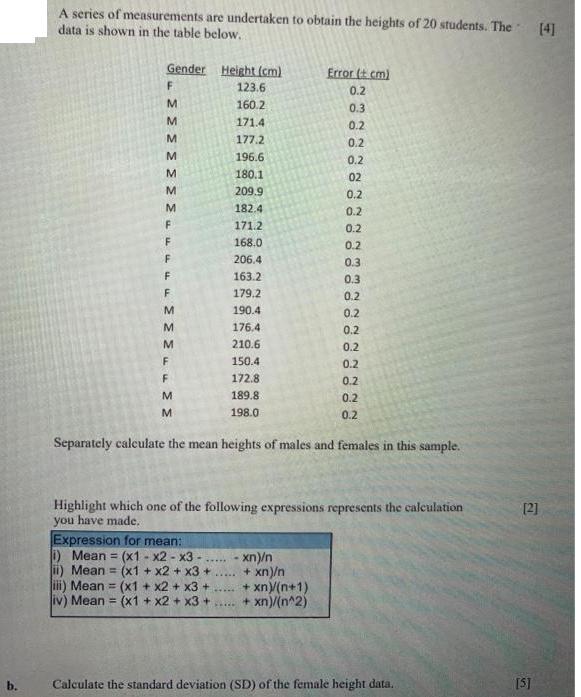
b. A series of measurements are undertaken to obtain the heights of 20 students. The data is shown in the table below.. Gender F

b. A series of measurements are undertaken to obtain the heights of 20 students. The data is shown in the table below.. Gender F M M M M M M M F F F F F M M M F F M M Height (cm) 123.6 160.2 171.4 177.2 196.6 180.1 209.9 182.4 171.2 168.0 206.4 163.2 179.2 190.4 176.4 210.6 150.4 172.8 189.8. 198.0 Expression for mean: i) Mean = (x1 - x2-x3- ii) Mean= (x1+x2 + x3+ iii) Mean = (x1+x2 + x3+ iv) Mean = (x1+x2 + x3 + Error (t cm) 0.2 0.3 0.2 0.2 800 xn)/n + xn)/n + xn)/(n+1) + xn)/(n^2) 0.2 02 0.2 0.2 0.2 0.2 0.3 0.3 0.2 0.2 0.2 0.2 Separately calculate the mean heights of males and females in this sample. 0.2 0.2 0.2 0.2 Highlight which one of the following expressions represents the calculation you have made. Calculate the standard deviation (SD) of the female height data. [4] [2] [5]
Step by Step Solution
★★★★★
3.30 Rating (156 Votes )
There are 3 Steps involved in it
Step: 1

Get Instant Access to Expert-Tailored Solutions
See step-by-step solutions with expert insights and AI powered tools for academic success
Step: 2

Step: 3

Ace Your Homework with AI
Get the answers you need in no time with our AI-driven, step-by-step assistance
Get Started


