Question
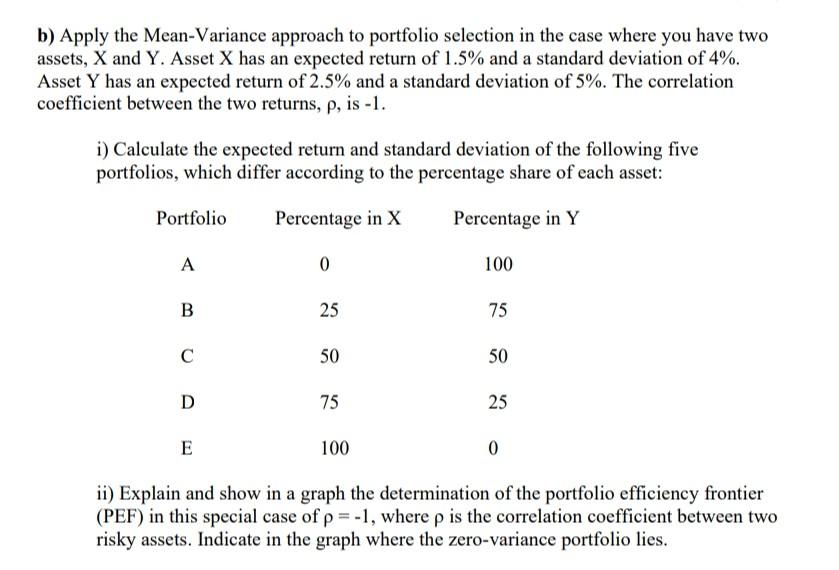
b) Apply the Mean-Variance approach to portfolio selection in the case where you have two assets, X and Y. Asset X has an expected return
b) Apply the Mean-Variance approach to portfolio selection in the case where you have two assets, X and Y. Asset X has an expected return of 1.5% and a standard deviation of 4%. Asset Y has an expected return of 2.5% and a standard deviation of 5%. The correlation coefficient between the two returns, , is -1. i) Calculate the expected return and standard deviation of the following five portfolios, which differ according to the percentage share of each asset: Portfolio Percentage in X Percentage in Y A 0 100 B 25 75 C 50 50 D 75 25 E 100 0 ii) Explain and show in a graph the determination of the portfolio efficiency frontier (PEF) in this special case of = -1, where is the correlation coefficient between two risky assets. Indicate in the graph where the zero-variance portfolio lies.

want the answer for part b especially.
question b part 2 is needed. the graphical explanation and the details related to it.
b) Apply the Mean-Variance approach to portfolio selection in the case where you have two assets, X and Y. Asset X has an expected return of 1.5% and a standard deviation of 4%. Asset Y has an expected return of 2.5% and a standard deviation of 5%. The correlation coefficient between the two returns, p, is -1. i) Calculate the expected return and standard deviation of the following five portfolios, which differ according to the percentage share of each asset: Portfolio Percentage in X Percentage in Y A 0 100 B 25 75 C 50 50 D 75 25 E 100 0 ii) Explain and show in a graph the determination of the portfolio efficiency frontier (PEF) in this special case of p= -1, where p is the correlation coefficient between two risky assets. Indicate in the graph where the zero-variance portfolio lies. b) Apply the Mean-Variance approach to portfolio selection in the case where you have two assets, X and Y. Asset X has an expected return of 1.5% and a standard deviation of 4%. Asset Y has an expected return of 2.5% and a standard deviation of 5%. The correlation coefficient between the two returns, p, is -1. i) Calculate the expected return and standard deviation of the following five portfolios, which differ according to the percentage share of each asset: Portfolio Percentage in X Percentage in Y A 0 100 B 25 75 C 50 50 D 75 25 E 100 0 ii) Explain and show in a graph the determination of the portfolio efficiency frontier (PEF) in this special case of p= -1, where p is the correlation coefficient between two risky assets. Indicate in the graph where the zero-variance portfolio liesStep by Step Solution
There are 3 Steps involved in it
Step: 1

Get Instant Access to Expert-Tailored Solutions
See step-by-step solutions with expert insights and AI powered tools for academic success
Step: 2

Step: 3

Ace Your Homework with AI
Get the answers you need in no time with our AI-driven, step-by-step assistance
Get Started


