Answered step by step
Verified Expert Solution
Link Copied!

Question

1 Approved Answer

B C D E F H Equity Valuations using Multiples and Transactions EPS BV Sales EBITDA Premium Synergy Historical Multiples: - Average - Median 14.00
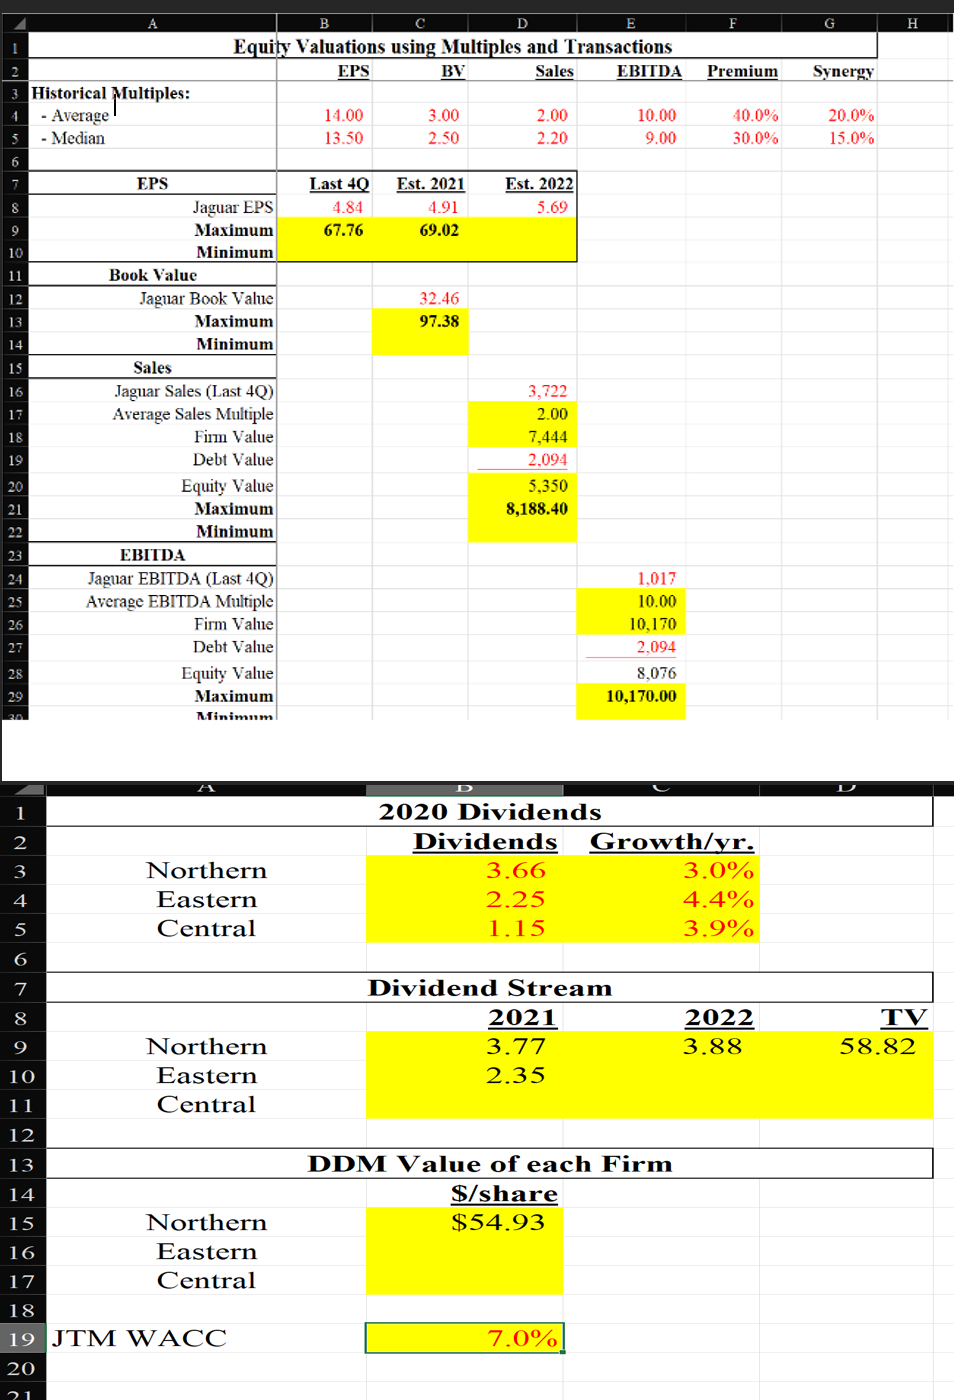
image text in transcribed

B C D E F H Equity Valuations using Multiples and Transactions EPS BV Sales EBITDA Premium Synergy Historical Multiples: - Average - Median 14.00 13.50 3.00 2.50 2.00 2.20 10.00 9.00 40.0% 30.0% 20.0% 15.0% 6 Last 40 4.84 67.76 8 9 Est. 2021 4.91 69.02 Est. 2022 5.69 10 EPS Jaguar EPS Maximum Minimum Book Value Jaguar Book Value Maximum Minimum 11 12 32.46 97.38 13 14 Sales 15 16 17 18 3,722 2.00 7,444 2,094 5,350 8,188.40 19 20 21 22 23 24 Jaguar Sales (Last 4Q) Average Sales Multiple Fiim Value Debt Value Equity Value Maximum Minimum EBITDA Jaguar EBITDA (Last 4Q) Average EBITDA Multiple Firm Value Debt Value Equity Value Maximum Minimum 25 26 1,017 10.00 10,170 2.094 8.076 10,170.00 27 28 29 A D D 1 2 3 2020 Dividends Dividends Growth/yr. 3.66 3.0% 2.25 4.4% 1.15 3.9% Northern Eastern Central 4 5 6 7 8 Dividend Stream 2021 3.77 2.35 2022 3.88 TV 58.82 9 10 Northern Eastern Central 11 12 13 DDM Value of each Firm $/share $54.93 14 15 Northern 16 Eastern 17 Central 18 19 JTM WACC 20 7.0% 21 B C D E F H Equity Valuations using Multiples and Transactions EPS BV Sales EBITDA Premium Synergy Historical Multiples: - Average - Median 14.00 13.50 3.00 2.50 2.00 2.20 10.00 9.00 40.0% 30.0% 20.0% 15.0% 6 Last 40 4.84 67.76 8 9 Est. 2021 4.91 69.02 Est. 2022 5.69 10 EPS Jaguar EPS Maximum Minimum Book Value Jaguar Book Value Maximum Minimum 11 12 32.46 97.38 13 14 Sales 15 16 17 18 3,722 2.00 7,444 2,094 5,350 8,188.40 19 20 21 22 23 24 Jaguar Sales (Last 4Q) Average Sales Multiple Fiim Value Debt Value Equity Value Maximum Minimum EBITDA Jaguar EBITDA (Last 4Q) Average EBITDA Multiple Firm Value Debt Value Equity Value Maximum Minimum 25 26 1,017 10.00 10,170 2.094 8.076 10,170.00 27 28 29 A D D 1 2 3 2020 Dividends Dividends Growth/yr. 3.66 3.0% 2.25 4.4% 1.15 3.9% Northern Eastern Central 4 5 6 7 8 Dividend Stream 2021 3.77 2.35 2022 3.88 TV 58.82 9 10 Northern Eastern Central 11 12 13 DDM Value of each Firm $/share $54.93 14 15 Northern 16 Eastern 17 Central 18 19 JTM WACC 20 7.0% 21

Step by Step Solution

There are 3 Steps involved in it

Step: 1

blur-text-image

Get Instant Access to Expert-Tailored Solutions

See step-by-step solutions with expert insights and AI powered tools for academic success

Step: 2

blur-text-image_2

Step: 3

blur-text-image_3

Ace Your Homework with AI

Get the answers you need in no time with our AI-driven, step-by-step assistance

Get Started

Recommended Textbook for

Integral Green Zimbabwe An African Phoenix Rising

Authors: Elizabeth Mamukwa , Ronnie Lessem , Alexander Schieffer

1st Edition

1472438191, 1472438205, 9781472438201

More Books

Students also viewed these Finance questions

Question

8. What is the difference between JIT and MRP?

Answered: 1 week ago