

Question
b) Conduct an index number trend analysis for all the items reported. Use year 2017 as the base year. Discuss your findings. d) Using any
b) Conduct an index number trend analysis for all the items reported. Use year 2017 as the base year. Discuss your findings.
d) Using any one of the financial analysis tools that you have learned from this subject, perform the before and after restructuring analysis for this company.
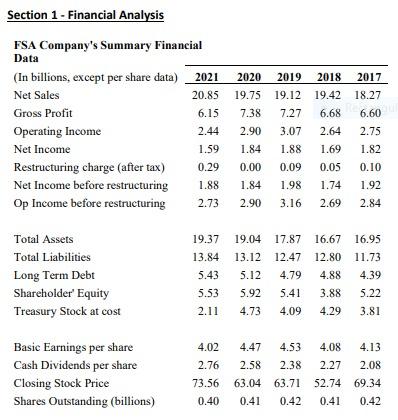
Section 1 - Financial Analysis FSA Company's Summary Financial Data (In billions, except per share data) Net Sales Gross Profit \begin{tabular}{rrrrr} \hline 2021 & 2020 & 2019 & 2018 & 2017 \\ \hline 20.85 & 19.75 & 19.12 & 19.42 & 18.27 \\ 6.15 & 7.38 & 7.27 & 6.68 & 6.60 \\ 2.44 & 2.90 & 3.07 & 2.64 & 2.75 \\ 1.59 & 1.84 & 1.88 & 1.69 & 1.82 \\ 0.29 & 0.00 & 0.09 & 0.05 & 0.10 \\ 1.88 & 1.84 & 1.98 & 1.74 & 1.92 \\ 2.73 & 2.90 & 3.16 & 2.69 & 2.84 \end{tabular} TotalAssetsTotalLiabilitiesLongTermDebtShareholderEquityTreasuryStockatcost19.3713.845.435.532.1119.0413.125.125.924.7317.8712.474.795.414.0916.6712.804.883.884.2916.9511.734.395.223.81 BasicEarningspershareCashDividendspershareClosingStockPriceSharesOutstanding(billions)4.022.7673.560.404.472.5863.040.414.532.3863.710.424.082.2752.740.414.132.0869.340.42 Section 1 - Financial Analysis FSA Company's Summary Financial Data (In billions, except per share data) Net Sales Gross Profit \begin{tabular}{rrrrr} \hline 2021 & 2020 & 2019 & 2018 & 2017 \\ \hline 20.85 & 19.75 & 19.12 & 19.42 & 18.27 \\ 6.15 & 7.38 & 7.27 & 6.68 & 6.60 \\ 2.44 & 2.90 & 3.07 & 2.64 & 2.75 \\ 1.59 & 1.84 & 1.88 & 1.69 & 1.82 \\ 0.29 & 0.00 & 0.09 & 0.05 & 0.10 \\ 1.88 & 1.84 & 1.98 & 1.74 & 1.92 \\ 2.73 & 2.90 & 3.16 & 2.69 & 2.84 \end{tabular} TotalAssetsTotalLiabilitiesLongTermDebtShareholderEquityTreasuryStockatcost19.3713.845.435.532.1119.0413.125.125.924.7317.8712.474.795.414.0916.6712.804.883.884.2916.9511.734.395.223.81 BasicEarningspershareCashDividendspershareClosingStockPriceSharesOutstanding(billions)4.022.7673.560.404.472.5863.040.414.532.3863.710.424.082.2752.740.414.132.0869.340.42Step by Step Solution
There are 3 Steps involved in it
Step: 1

Get Instant Access to Expert-Tailored Solutions
See step-by-step solutions with expert insights and AI powered tools for academic success
Step: 2

Step: 3
Ace Your Homework with AI
Get the answers you need in no time with our AI-driven, step-by-step assistance
Get Started
Finance And Financial Intermediation
Authors: Harold L. Cole
1st Edition
0190941707, 978-0190941703