

Answered step by step
Verified Expert Solution
Question
1 Approved Answer
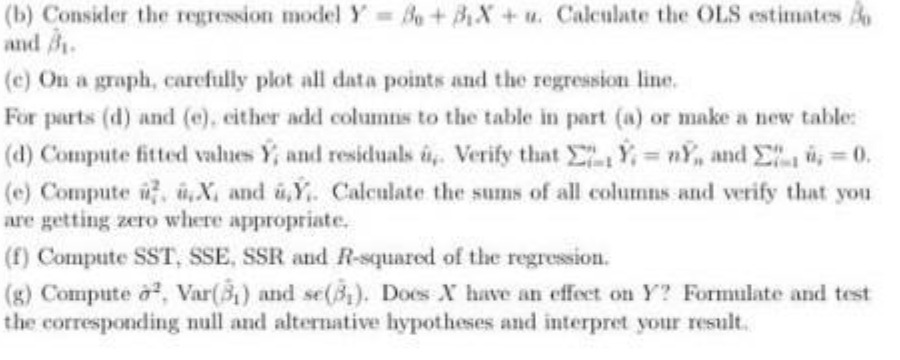
(b) Consider the regression model Y = B + BX + u. Calculate the OLS estimates By and #1. (c) On a graph, carefully plot

Step by Step Solution
There are 3 Steps involved in it
Step: 1

Get Instant Access to Expert-Tailored Solutions
See step-by-step solutions with expert insights and AI powered tools for academic success
Step: 2

Step: 3
Ace Your Homework with AI
Get the answers you need in no time with our AI-driven, step-by-step assistance
Get Started
Algebra And Trigonometry Enhanced With Graphing Utilities
Authors: Michael Sullivan, Michael Sullivan III
7th Edition
0134269039, 9780134269030